VWAP Anomaly V1I made some late reading yesterday and discovered the importance of the VWAP indicator, above all the idea that when the current price exits it it will always bounce back. Therefore I decided to build an indicator which detects when the current price escapes the VWAP margin. The indicator shows this three things:
1) When the current price exits the VWAP margin.
2) The strength of a VWAP trend
3) VWAP bounce point (Blue dots which can be used as support or resistance)
By using the VWAP Anomaly V1 indicator, you can know if you find yourself in a reversal zone, and get a great entry point. Please, do have in mind no indicator is perfect, by using other indicator with the VWAP Anomaly Indicator your chances of success increase by a significant level. NOTE: Follow my predictions under your own risk
In den Scripts nach "entry" suchen

T3 Entry and ExitI made this indicator to give clear entry and exit signals plus give signals when I should add onto my trades with no repainting!! The bottom indicator is set to 34 (the default settings). This gives me my entries and exits as shown by the green and red arrow. I use a 14 period setting for my signals to add onto my trade. If I am in a long trade as shown in the chart above and the 14 period T3EE has a fast line cross under the slow line and then a cross back over and I have not had my signal to close trade yet on the 34 period T3EE I will add to my long position. I cut the size of they order in half with each addition to my position. So if I entered with 2 lots I would add 1 lot with my first signal to add (shown by orange arrow) and then .5 lots with the second signal to add to my position and so on until it is time to close the position. If you day trade avoid entering positions between 4pm est and 9pm est. and the larger the ranges and the more trendy the market the better. Good Luck!!!
If you have any questions let me know :)


Price Action + Support/Resistance with LabelsEntry Conditions:
Long Entry (BUY): Based on the bullish engulfing pattern and price being above the resistance level.
Short Entry (SELL): For demonstration, the short entry condition is set as price being below the support level and a bullish candle in the previous bar. You can modify this logic for your own use case.
Stop Loss and Take Profit:
Stoploss is plotted at the calculated stop loss level.
Target is plotted at the calculated take profit level.
Labels:
For long trades, labels are added with "BUY", "STOPLOSS", and "TARGET".
For short trades (if enabled), labels are added with "SELL", "STOPLOSS", and "TARGET".
Labels are placed using label.new at specific locations on the chart (above or below bars).
Alert Conditions:
Alerts are created for both long and short entry signals so you can get notified when the entry conditions are met.
How it works:
BUY label will appear below the bar when a long entry condition is met.
SELL label will appear above the bar when a short entry condition is met.
STOPLOSS and TARGET labels will appear at their respective levels when an entry signal is triggered.
The labels will appear on the chart to give you a clear visual cue of the entry, stop loss, and take profit levels.
How to Use:
Copy the script into your Pine Editor on TradingView and apply it to your chart.
Observe the labels that show up on the chart:
"BUY" will appear below the bar when long conditions are met.
"SELL" will appear above the bar when short conditions are met (if using short logic).
"STOPLOSS" will be plotted at the stop loss level.
"TARGET" will be plotted at the take profit level.
Optional Customization:
You can modify the short entry condition based on your preferred method.
You can adjust the length for the support/resistance calculation, the stopLossRR, and other parameters to fine-tune the strategy for Nifty 50 or any other asset.
Let me know if you have any further questions or need additional modifications!

Raeinex Momentum Liquidity IndexEntry arrow signals with volumetric momentum (buying and selling pressure) and the possibility to use all entry signals as liquidity area for price retest.

Bovo Study version 5entry long, stop long, entry short, stop short, perfect 8 and 9 alerts.
for acesse pvt me

Entry / TP / SL Alert Bands (Simple & Stable)
Get an alert before you reach your take profit or stop loss. Set as a percentage over the distance to your stop loss and take profit and improve your Money Management

ALI-2-OptionsEntry strategy and indicator on the contracts chart only, 5-minute frame, by crossing the green line + the average

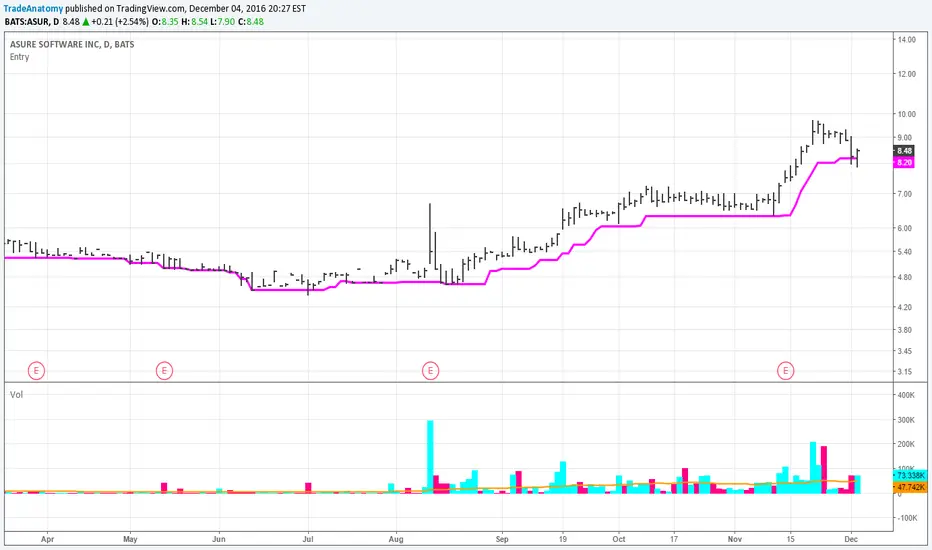
Entry ChecklistThis Pine Script creates a checklist table displayed in the bottom-right corner of the chart. It shows:
1. Whether the next earnings date is within the next 2 weeks
2. Whether the current month is a traditionally weak month (May, August, or September)
Each row includes:
• A check title
• The current value (e.g., date or month)
• A ❌ red cross if the condition is met (warning signal)
Useful for quickly assessing seasonal and earnings-related risks.

ENTRY CONFIRMATION V2An indicator from candle man. Helps determine whether supply and demand zone are truly supply or demand.

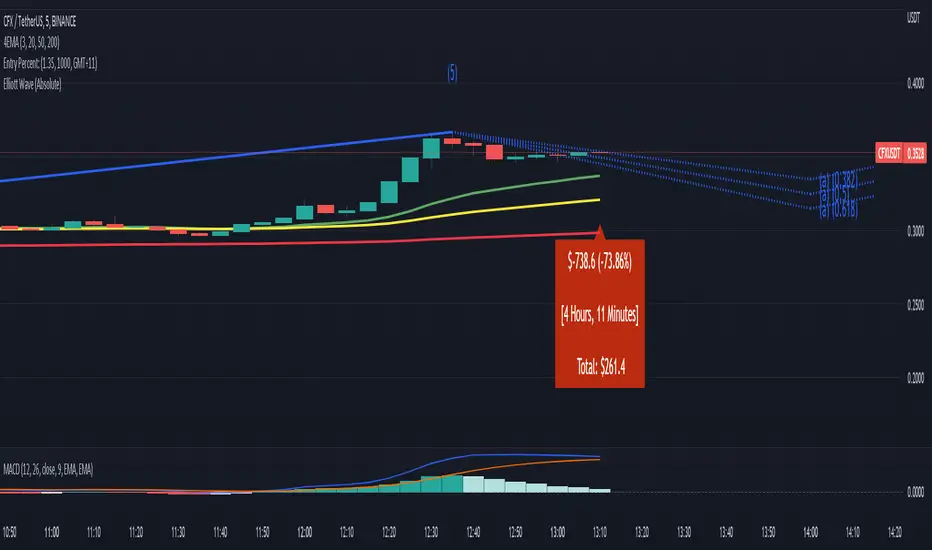
Entry Percent: EssamThis Pine Script code is designed to perform the task of computing and showcasing the profit percentage, profit value, and the duration for which a specific asset is held, all in real-time. The script effectively leverages the built-in resources to provide a seamless and robust experience, as it presents the calculated figures in an easily readable format on the chart, without causing any lag or disruptions to the chart.
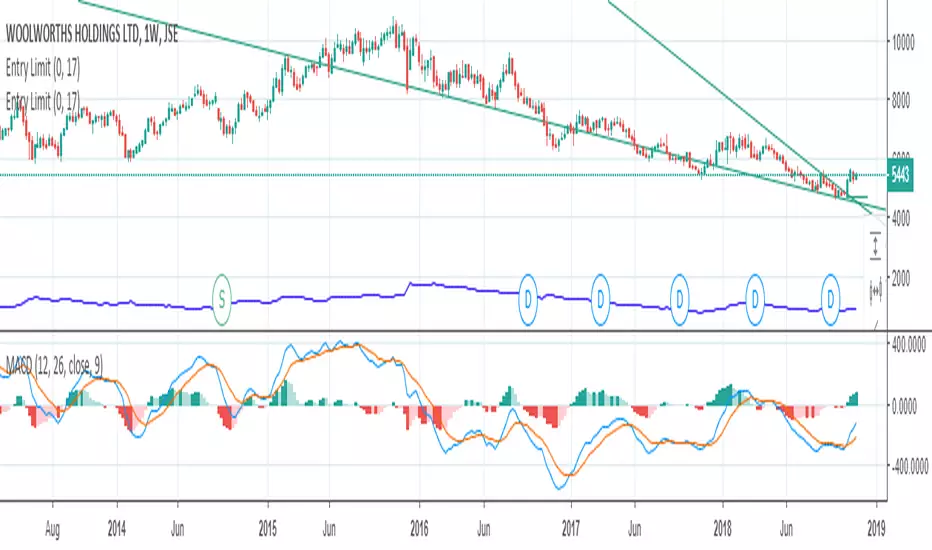
Positional Swings by Batman TradesEntry and Exit Signals for higher timeframes based on Ema & Sma with RSI overbought/oversold plots for possible reversal indication.
It can be used for booking profit in the existing trade and take fresh position once the new candle breaks the high/low of alert candle depending upon the side.
Best work with high timeframes. (>1 Hour)
Best recommended for stocks

Entry Size 1barCalculates how many lots (100) you should buy/sell for any given bar with a fixed risk in USD and shows if Long (L), Short (S) or wait (w) with a label.
Requires max loss per week, trading days per day and lossing trading per day.

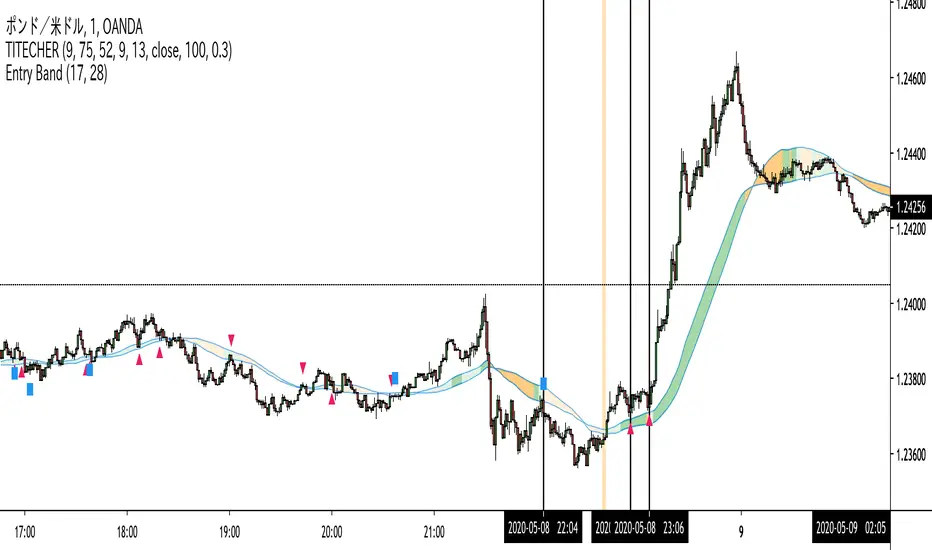
Entry Band(trial)This indicator is trial version. You can use for a month for free.
The indicator includes moving average and exponential moving average .
you can set the parameters you want.
you can see the trend.
green : up trend
orange : down trend
if you want to use this indicator, Please join the URL:

Entry BandThe indicator includes moving average and exponential moving average.
you can set the parameters you want.
you can see the trend.
green : up trend
orange : down trend
if you want to use this indicator, Please join the URL:
Entry FactorFind the most relevant price direction changes with ease, with this geometry-based indicator.
Stop wasting your time with moves that don't offer a satisfactory range for good profits.

Entry Bars -This algorithm takes in consideration Media averages, Volatility Movements and other Mathematical Properties.
-After adding this signal on TradingView, you will get notified every of potential long and short points triggered by the indicator.
-This signal alerts you anytime bars form a bullish or bearish pattern and price start to move in the suggested direction.
-It works in any time frame or market like Forex, Crypto, Commodities even Stocks.
-Recommended for bots or manual trading.
Do you need an Script or an expert adviser for Forex, contact our coding service
Get this indicator today! contact us

RocketScalperEntry follows the first normal candle after the highlights - use in conjunction with basic patterns, SFPs, and the until1mil indicators (SSO/MACD/MI/BZ)