Reverse Pulse System FractalTP# Reverse Pulse System FractalTP – Strategy Description for TradingView
---
## Overview
**Reverse Pulse System FractalTP** is a variant of the Reverse Pulse sweep-and-reverse system with **Fractal-based Take-Profit**. Instead of a fixed R:R, the TP can target the next fractal level—the nearest resistance (long) or support (short).
- **Type:** Mean-reversion / Sweep-reversal
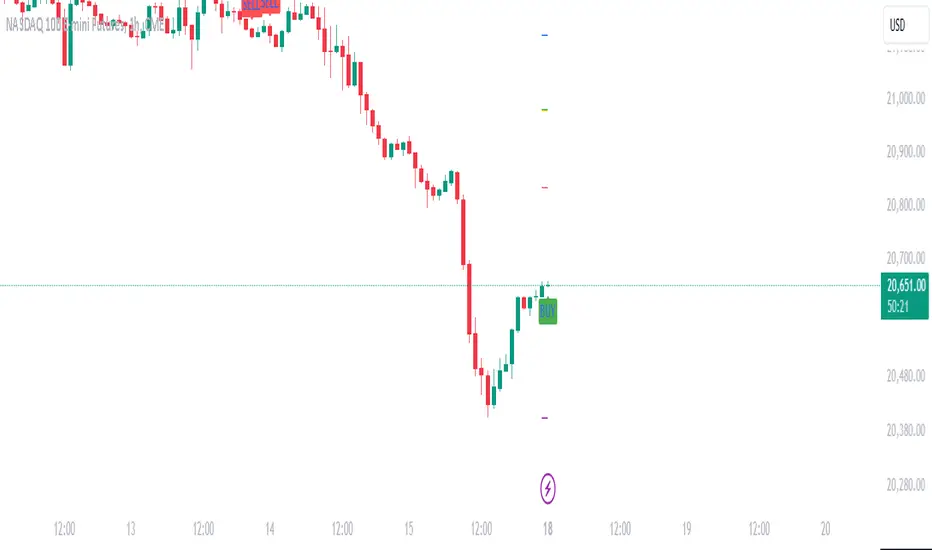
- **Timeframe:** M5 (recommended)
- **Instruments:** XAUUSD, EURUSD, and similar liquid pairs
- **Session:** 09:00–17:00 (Europe/Berlin, DST-safe)
- **Non-repainting:** Closed-bar logic, no lookahead bias
---
## Concept
1. **Trend Bias (H1):** Supertrend on H1 with body-break confirmation—long setups only when bias is long, short setups only when bias is short.
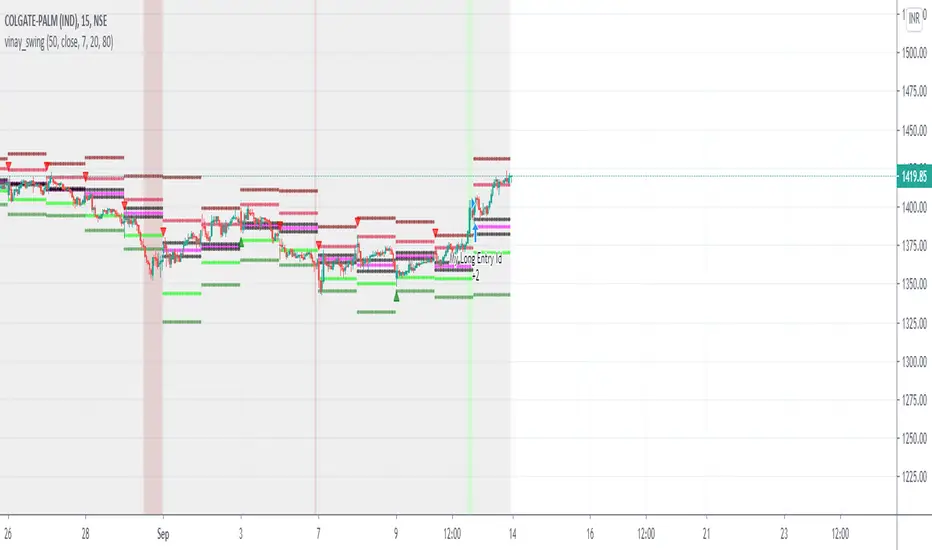
2. **POI Level:** Fractal highs (short bias) or fractal lows (long bias) define the key levels to watch.
3. **Sweep:** Price breaks the POI level (wick) but reverses back.
4. **Entry:** "Attempted Candle"—the candle that prints the new extreme and confirms reversal (either directly bullish/bearish or via a trigger break).
5. **TP (FractalTP):** Take-profit at the **next fractal**—long targets the nearest fractal high above entry, short targets the nearest fractal low below entry.
---
## Components
### Trend Bias (Supertrend H1)
- Supertrend on H1 with adjustable Factor and ATR Length.
- **Body-break:** Direction change only when the candle body breaks the Supertrend line (not just the wick).
### POI (Point of Interest)
- **MTF Fractals ** – CC BY-NC-SA 4.0
- Long bias: Fractal low as POI (lowest fractal low in lookback).
- Short bias: Fractal high as POI (highest fractal high in lookback).
- Fractal size: 3, 5, 7, or 9 bars.
- Optional: Higher timeframe for fractals (MTF).
### Sweep Detection
- **Long:** Price makes a new low below the POI level.
- **Short:** Price makes a new high above the POI level.
- While sweep is active, the extreme low/high is tracked.
### Entry Logic (Two Paths)
**1. Attempted Candle (direct)** – Sweep + failure on the same candle:
- **Long:** `low < poiLevel` (sweep), `close > open` (bullish), `low < low ` (new low).
- **Short:** `high > poiLevel` (sweep), `close < open` (bearish), `high > high ` (new high).
- SL: Low/High of this attempted candle. Entry: Close.
**2. Trigger + Break** – Candle prints the extreme but has the wrong color → wait for break:
- **Long:** Trigger candle = bearish, prints low. Trigger level = its high. Entry when a bullish candle closes above the trigger level.
- **Short:** Trigger candle = bullish, prints high. Trigger level = its low. Entry when a bearish candle closes below the trigger level.
- SL: Option A = Low/High of the break candle. Option B = Low/High of the trigger candle.
### Williams %R Filter (Optional)
- **Long:** Trade only if Williams %R (0–100) reached at least 80 (overbought) within the last X bars.
- **Short:** Trade only if Williams %R (0–100) reached at most 20 (oversold) within the last X bars.
- Default lookback: 20 bars. Default length: 14.
- When disabled, the filter is not applied.
---
## Exits – TP Mode: Fixed CRV vs Next Fractal
### TP Mode (Default: Next Fractal)
| Mode | Description |
|------|-------------|
| **Fixed CRV** | TP = Entry ± (Risk × Min R:R), same as base Reverse Pulse. |
| **Next Fractal** | TP at the next fractal level above (long) or below (short) entry. |
### Next Fractal Logic
- **Long:** TP = smallest fractal high **above** entry (nearest resistance).
- **Short:** TP = largest fractal low **below** entry (nearest support).
- **Fallback:** If no valid fractal exists, or the fractal is closer than "Min R:R (Fallback)", the CRV-based TP is used instead.
### SL
- Stop-Loss based on entry logic (Low/High of the relevant candle).
---
## Risk Management
- **Position sizing:** `qty = RiskAmount / (SL distance × USD per point)`.
- **XAUUSD:** USD per point = 1 (1 USD P&L per 1 USD price move per oz).
- **Daily stop:** After N stop-loss losses (default: 3), no further trades until session reset (09:00).
- **Max Qty:** Upper limit for position size (e.g. 500 oz for Gold).
---
## Session & Time
- **DST-safe:** Timestamps use IANA timezone (e.g. `Europe/Berlin`).
- **Default:** 09:00–17:00 Europe/Berlin. Timezone selectable via dropdown.
- **Session OFF:** Debug option to disable session filter (24/7 testing).
---
## Settings Overview
| Group | Parameter | Default |
|-------|-----------|---------|
| Session | Start/End Hour, Min, Timezone | 09:00–17:00, Europe/Berlin |
| Supertrend | Factor, ATR Length | 3.0, 10 |
| Fractals | Bars in Fractal, Timeframe | 5, Chart TF |
| Entry | Trigger-Break SL (A/B) | A |
| Filter Williams %R | Use Filter, Lookback, Length | Off, 20, 14 |
| Filter Williams %R | Min for Long, Max for Short | 80, 20 |
| Risk | Risk %, USD per Point, Max Qty | 1%, 1, 500 |
| Risk | **TP Mode** | **Next Fractal** |
| Risk | Min R:R (TP), Fractal TP: Min R:R (Fallback) | 2, 1 |
| Risk | Max SL per Day | 3 |
| Alerts | Alert Output, Telegram / PineConnector options | Off |
| Debug | Show Debug, Level Lines, Legend | true, true, true |
---
## Alerts – Telegram or PineConnector
### Alert Output
- **Off:** No alerts.
- **Telegram:** Webhook/Telegram, copier-friendly format.
- **PineConnector:** Format for PineConnector EA (MT4/MT5).
### Telegram / Webhook
- **Alert prefix:** First line (e.g. "Reverse Pulse").
- **Telegram Channel ID:** For webhook routing (e.g. `-1001234567890`).
- **Format:** `SYMBOL Buy/Sell now SL: X.XX TP: X.XX` – copier compatible.
### PineConnector
- **License ID:** Your PineConnector license (13–14 digits).
- **Volume Parameter:** `vol_lots` (strategy qty), `vol_pct_bal_loss` (% balance), `vol_dollar` ($ risk).
- **Symbol Override:** Broker symbol (e.g. GOLD instead of XAUUSD), empty = chart symbol.
- **Format:** `LicenseID,buy,Symbol,vol_lots=0.15,sl_price=2650.50,tp_price=2660.75`
---
## Recommended Instruments
- **XAUUSD** (Gold)
- **EURUSD**
- Other liquid forex and metal pairs with suitable tick size
---
## Technical Notes
- **process_orders_on_close:** Orders are executed at bar close.
- **pyramiding:** 0 (no pyramiding).
- **Float comparison:** `approxEq()` with `syminfo.mintick` for stable behavior.
---
## License Notice
- Fractals: MTF Fractals – CC BY-NC-SA 4.0
creativecommons.org
---
## Disclaimer
This system is for educational and research purposes only. There is no guarantee of profits. Trading involves substantial risk. Only trade with capital you can afford to lose.
Pine Script® Strategie