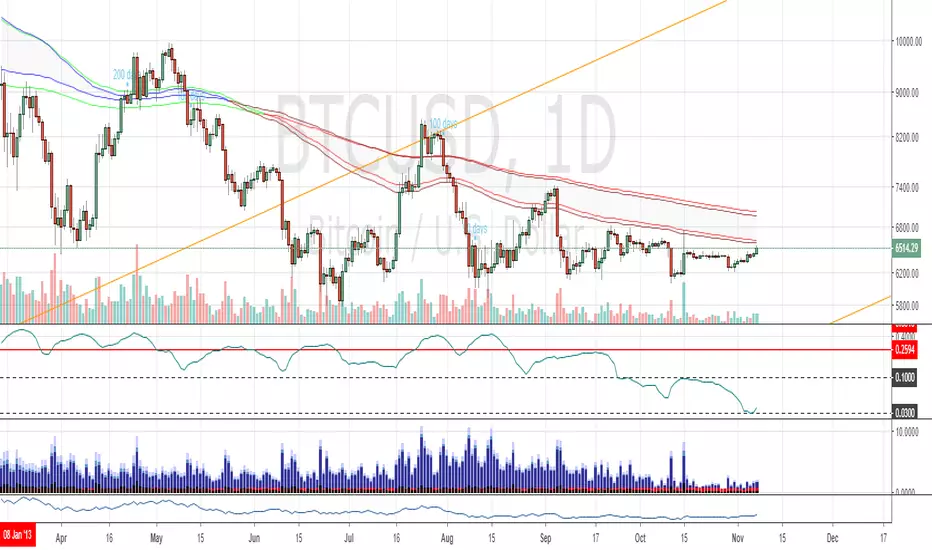
200/100 vs 190/80 EMA [jarederaj]Track the 200/100 EMA cross Vs the 180/90 EMA cross. Also, see the dates when these periods start on the chart. Pine Script® Indikatorvon jarederaj20
EMA 8, 13, 21, 55, 100, 200 EMAEMA 8, 13, 21, 55, 100, 200 EMAPine Script® Indikatorvon settlingcrabAktualisiert 49
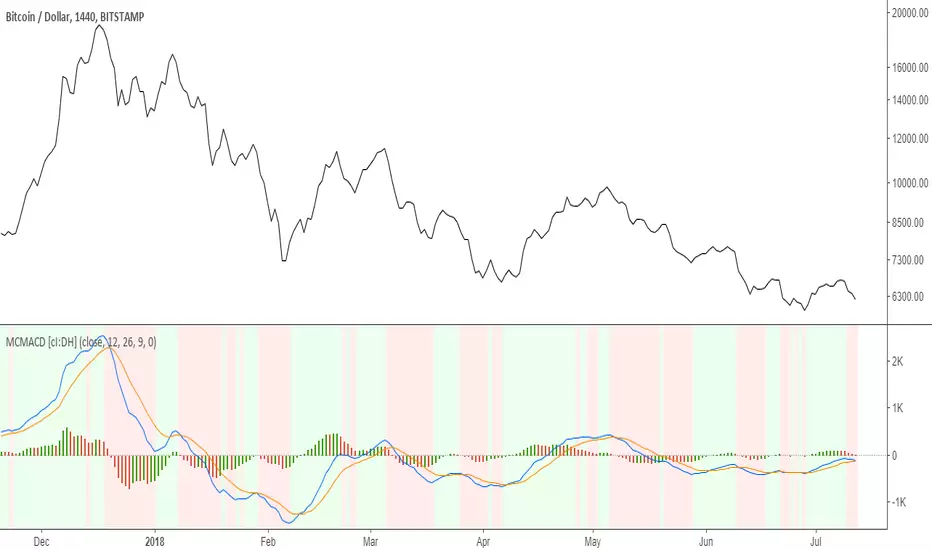
Multi color MACD with Triple EMA smoothing [cI:DH]At default settings, this indicator is identical to the built-in MACD. Features: - multi-color histogram - background color change when MACD tops or bottoms - additional smoothing using Triple EMA Recommended settings: - Triple EMA length 10 seem to be a good trade-off between smoothness and responsiveness Pine Script® Indikatorvon cI8DH55171
Colored EMAThis is a modified version of the exponential moving average indicator to change color based on trend (red/bearish if price has closed below EMA, green/bullish if price has closed above EMA).Pine Script® Indikatorvon ZenAndTheArtOfTradingAktualisiert 66 1.6 K
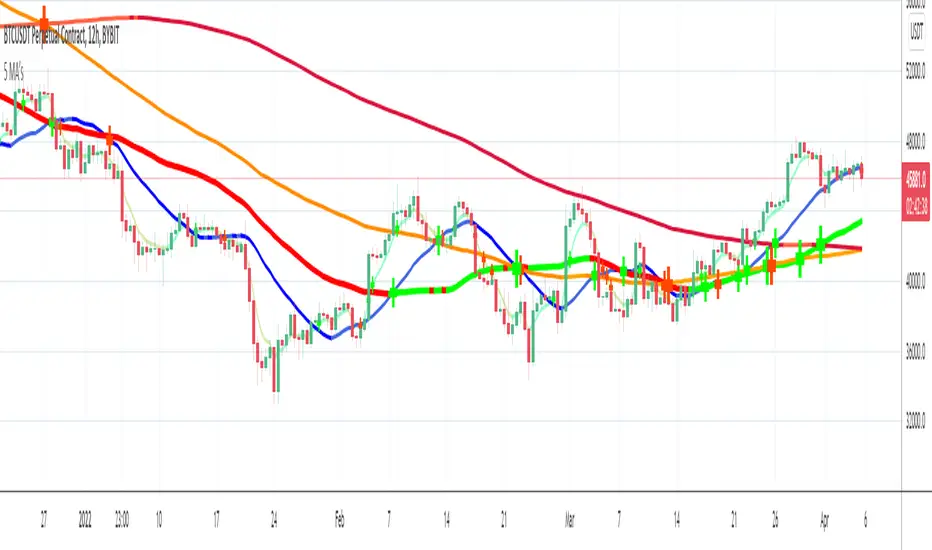
5 in 1 Colored SMA or EMAThis indicator displays 5 EMA’s or SMA’s that change color with the trend without needing to use up 5 charting indicators individually.Pine Script® Indikatorvon Lij_MCAktualisiert 66341
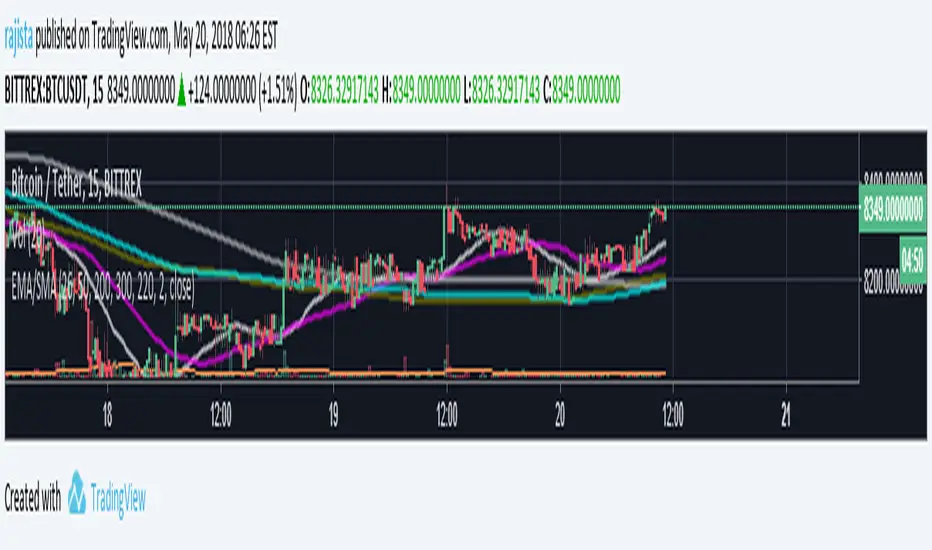
5 EMA/SMA with 8digit precision & line widthThis is a comno of 5 different EMA & SMA combined into one indicator with 8 digit precision specially designed to analyse altcoin values in satoshis . From the setting panel you can change the values of the SMA's , EMA's , choose the line width that you want and from the style tab under settings panel you can change the colors of that you want and then save your chart layout, so that you dont need to change the colors again and again. Pine Script® Indikatorvon rajistaAktualisiert 93
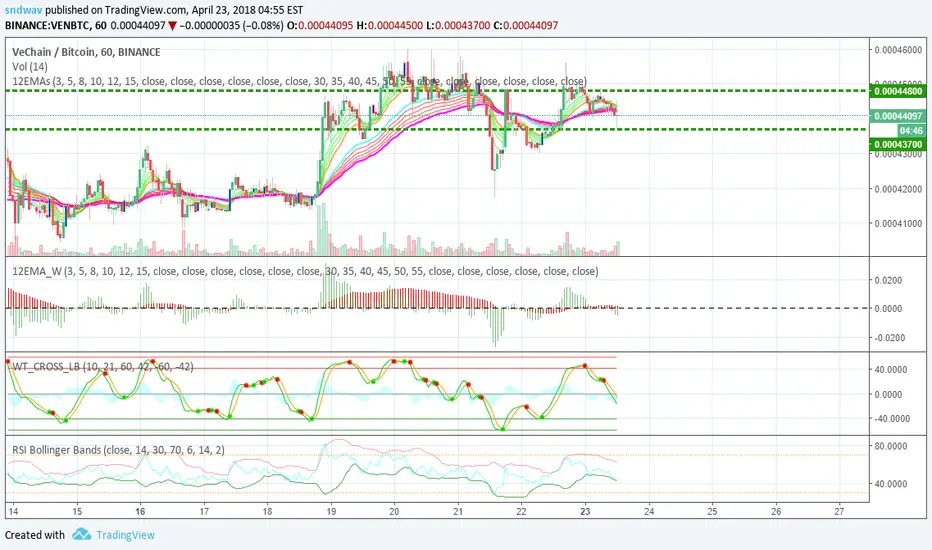
Frosted 12 EMA WIDTHThis is a complementary indicator for the 12 EMAs indicator () This width indicator shows the fanning width of each fan (shorter MAs and longer MAs). To make things easier to see: You can turn off one of the histograms to view just one of the widths (and add a 2nd instance of this indicator, turning off the other width).Pine Script® Indikatorvon sndwavAktualisiert 33
K3 3x EMAsSimple really. 3x EMAs that you can edit, turn on and off etc. Designed for efficiency/to save space. Even if you don't use 3 EMAs, it's better to have it and not need it, than to need it and not have it! Enjoy.Pine Script® Indikatorvon UnknownUnicorn122057116
Six EMA SMA by CrypticMarwariChoose between EMA or SMA and 6 different periods! Pine Script® Indikatorvon crypticmarwariAktualisiert 1164
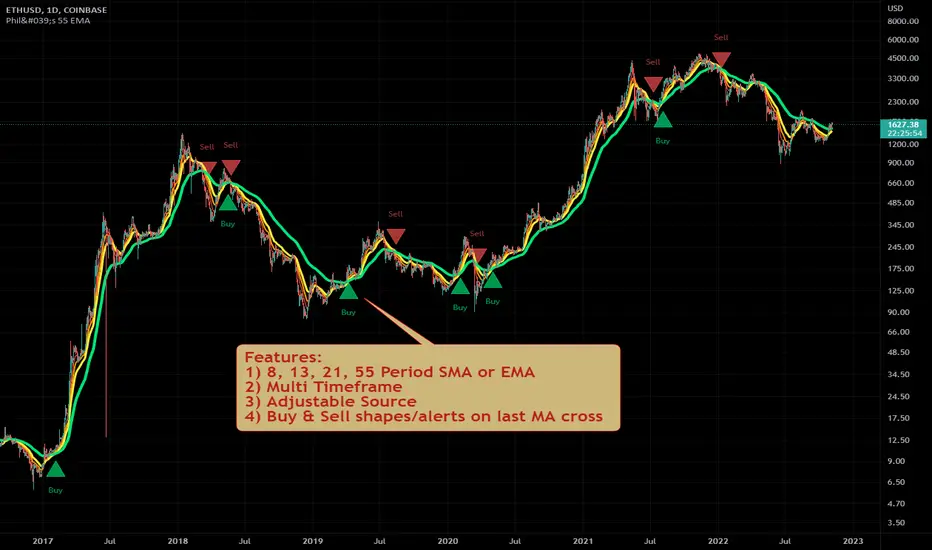
Philakone 55 EMA Swing Trading StrategyThis strategy was inspired by Philkone Crypto's "Lesson 12: Let's Learn Advanced 55 EMA Strategy" video. steemit.com Supports Buy and Sell Condition alerts and displays arrows on the chart.Pine Script® Indikatorvon prosum_solutionsAktualisiert 1313 4 K
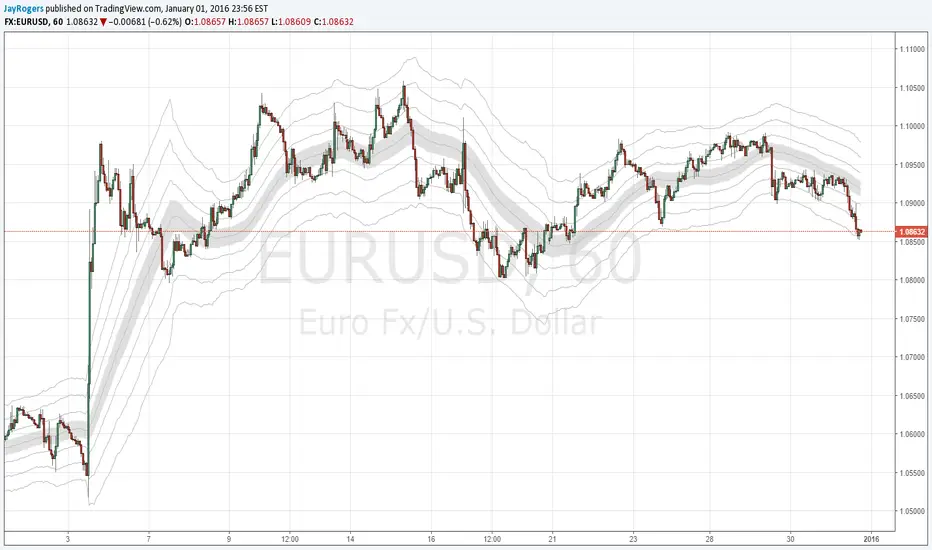
High-Low Difference Channels - SMA/EMAI wrote this up as a potential replacement for my BB based strategies, and so far it's looking pretty nice. Description / Usage: Adjust length and multiplier much the same way you would expect with Bollinger Bands. Multiplier of 1 gives you a base channel consisting of one high, and one low sourced SMA (or EMA) The outer channels are increments of the base channels width, away from the median hl2 sourced SMA (..or EMA) Pine Script® Indikatorvon JayRogersAktualisiert 55645
TonyUX EMA Scalper - Buy / SellThis is a simple scalping strategy that works for all time frames... I have only tested it on FOREX It works by checking if the price is currently in an uptrend and if it crosses the 20 EMA. If it crosses the 20 EMA and its in and uptrend it will post a BUY SIGNAL. If it crosses the 20 EMA and its in and down it will post a SELL SIGNAL. The red line is the highest close of the previous 8 bars --- This is resistance The green line is the lowest close of the previous 8 bars -- This is support Pine Script® Indikatorvon tux107107 18.9 K
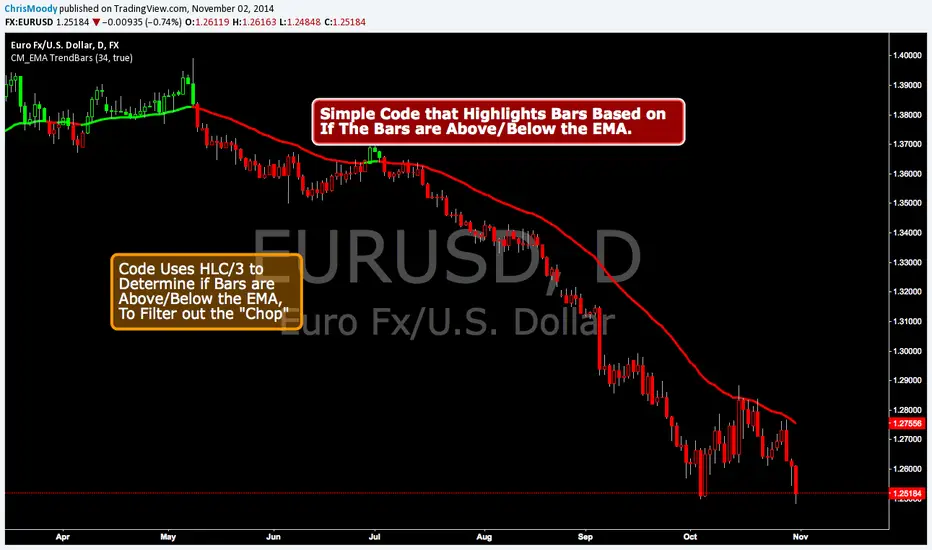
CM EMA Trend BarsThis Code Simply Changes the Bar Colors based on if the Bar is Above or Below the EMA. Inputs via the Inputs Tab: Ability to change the EMA Period. Ability to Turn On/Off the EMA Plotted on the Screen ***Note - I used the HLC/3 To determine if the bar/candle is above or below the EMA. This Filters out the Chop and gets rid of many of the False Breaks above or below the EMA.Pine Script® Indikatorvon ChrisMoody123123 11.8 K
Super EMA Quartet (20/50/100/200)A combination of the 20-period, 50-period, 100-period, and 200-period EMAs. Select any or all of the EMAs for more convenient technical analysis. Pine Script® Indikatorvon taihan1
Super EMA Trio (20 50 200)Triple EMA 20/50/200. This is self-explanatory. TradingView wants me to add more text to this because it thinks people can't figure out how to use this script. I don't know why. It seems pretty dumb of them to require more text for nothing.Pine Script® Indikatorvon taihan6
EMA 8 Break & Retest ScalperEMA 8 Break & Retest, Candle Close und Wick BUY / SELL Signale Scalping EMA 8 Break & Retest, Candle Close and Wick BUY / SELL Signals Scalping Pine Script® Indikatorvon trezzaj223
scalping EMA retracementThis script uses vwap and ema to detect pullback when the stock is chaep Pine Script® Indikatorvon EloniThe11
EMA SmoothEMA crossing over the smoothing of the ema using sma Pine Script® Strategievon coreymason19
EMA Fractal Bias"EMA Fractal Bias" overlays on TradingView charts to detect directional bias for scalping on futures like NQ/ES. It computes three smoothed EMAs (fast 3/2, mid 9/3, slow 20/5, configurable) for stacking checks (bullish: fast > mid > slow; bearish: reverse). Williams Fractals (period 2 default) identify potential breaks: close above up-fractal high for long, below down-fractal low for short. Bias logic: Tracks last up/down fractal. On break, if stacked aligns, sets bias (long/short) and resets broken fractal. If no stack, sets pending flag and neutral bias; confirms on later bars if stack turns true. Shading teal for long, purple for short, orange for neutral, with intra-bar previews. Debug toggle adds event labels and status on last bar. Non-repainting, evaluates on close. Pine Script® Indikatorvon ChannelFisher12
EMA 9, 20, 30, 200 (Buy Trend Filter Only)EMA 9, 20, 30, 200 (Buy Trend Filter Only) simple ema crossing analysis Pine Script® Indikatorvon mdcwai20
Guac's MAs, BBs, and ADX (SMA/EMA/BB + ADX/DI + Daily ATR)As someone who browses through numerous TradingView scripts, I find many ideas/functions that I find useful. However, sometimes I find certain features that I don't find useful or that could be added to make something more useful. Because of this I designed this script to collectively encompass functionality of the items/indicators I find useful when looking at an index/equity chart. This script was desgined/inspired to keep the chart clean while providing signal context for trend, volatility, price action, and regime conditions. Summary of what this script does: Plots a compact, customizable set of SMAs + EMAs for structure and trend layering. Adds Bollinger Bands with expansion/contraction coloring to visualize volatility state. Optionally overlays ADX/DI regime context, including: • an ADX-based “regime fill” (temperature-style colors) on the BB fill • optional DI+ / DI- cross markers for directional shift awareness • expanded ADX regime labels (Dead Chop → Very Strong/Extended) • optional “ADX momentum” (smoothed ADX slope) in the status label to show regime acceleration/decay Provides a small corner “Regime Status Label” that summarizes ADX regime (with numeric ADX) when enabled. Optionally appends Daily ATR (value + momentum) to the same label for range/volatility context that is consistent across intraday timeframes. I always find it frustrating when I am testing or playing with someones indicator and they don't have tooltips implemented so that I can understand the purpose of their parameters and the inputs. I have specifically tried to implement tooltip info bubbles next to every parameter input to give a short explanation of the parameter and it's purposePine Script® Indikatorvon ExtraGuacAMAktualisiert 29
Mag 7 EMA Trend MonitorDashboard Layout: 1. Symbol Column: The Mag 7 tickers. 2. Trend Column: Visual Bull/Bear status. 3. Strength Column: Percentage distance from the mean (EMA 21). 4. Aggregate Row: Summary of market breadth and average sector pull/push. How to Interpret the Trend Strength: • Positive %: The stock is trading above its 21 EMA. A very high number (e.g., $+15\%$) might suggest the stock is "overbought" or overextended. • Negative %: The stock is trading below its 21 EMA. A very low number (e.g., $-10\%$) might suggest it is "oversold." • Avg Strength: This gives you a bird's-eye view of the sector. If the aggregate is "5 Up / 2 Down" but the Avg Strength is only $+0.5\%$, the trend is weak and might be exhausting. "Pro-tips" for tool: • Multi-Timeframe Correlation: Try setting the Dashboard Timeframe to "D" (Daily) while trading on a "5m" or "15m" chart. This allows you to see if your intraday trade is aligned with the "Big Money" trend of the week. • The 4/7 Rule: Watch for that Aggregate row to hit 4 out of 7. In the Mag 7, since these stocks carry so much weight in the SPY and QQQ, a shift to a majority (4+) often precedes a move in the overall market indices. Pine Script® Indikatorvon j2m2t236
Daily EMA 9,21,50 with BandsCreated by Samsolid Daily EMAs on the chart 9/21/50 Bands on the 9/21Pine Script® Indikatorvon SamBadawiAktualisiert 5