EVS BTC V1Overview
The "EVS BTC V1" is a momentum-based trading strategy designed for Bitcoin (BTC) or similar volatile assets on TradingView. It combines Exponential Moving Averages (EMAs) for trend direction, volume confirmation to filter for strong moves, and an optional Relative Strength Index (RSI) filter to avoid overextended entries. The strategy uses a trailing stop for exits to lock in profits dynamically. It's set up for backtesting with an initial capital of $10,000, risking 10% of equity per trade, and accounting for 0.1% commissions.This is a crossover strategy: it goes long on bullish EMA crossovers with high volume (and RSI not overbought) and short on bearish crossunders (with high volume and RSI not oversold). It's overlayed on the main price chart for easy visualization.Key Parameters (User-Adjustable)Fast EMA Period: 9 (default) – Shorter-term trend line.
Slow EMA Period: 21 (default) – Longer-term trend line.
Volume Multiplier: 1.5 (default) – Requires volume to be 1.5x the 20-period average for signal validation.
Use RSI Filter?: Enabled (default) – Optional toggle to apply RSI conditions.
RSI Period: 14 (default), with overbought threshold at 70 and oversold at 30.
Trailing Stop Profit: 50 points (default) – Activates trailing once this profit level is hit.
Trailing Stop Offset: 20 points (default) – Distance from the high/low to trail the stop-loss.
Indicators UsedEMAs: 9-period (fast, blue line) and 21-period (slow, red line) on close prices.
Volume Filter: Compares current volume to a 20-period SMA; signals only trigger if volume exceeds the average by the multiplier (highlighted in yellow bars).
RSI: 14-period on close; plotted in purple on a sub-panel if enabled, with dashed horizontal lines at 70 (overbought) and 30 (oversold).
Entry RulesEntries are triggered only when all conditions align on a bar close:Direction
Conditions
Long (Buy)
- Fast EMA crosses over Slow EMA (bullish trend shift).
- Volume is "high" (> 1.5x 20-period avg).
- RSI < 70 (not overbought; skipped if filter disabled).
Short (Sell)
- Fast EMA crosses under Slow EMA (bearish trend shift).
- Volume is "high" (> 1.5x 20-period avg).
- RSI > 30 (not oversold; skipped if filter disabled).
On entry: Places a market order using 10% of current equity.
Alerts: Fires a one-time alert per bar (e.g., "Long Signal: EMA Crossover + High Volume!").
Exit RulesNo fixed take-profit or stop-loss on entry.
Uses a trailing stop for both long and short positions:Trails the stop-loss 20 points below the highest high (for longs) or 20 points above the lowest low (for shorts), but only activates after 50 points of unrealized profit.
This allows winners to run while protecting gains dynamically.
Positions close automatically on opposite signals or trailing stop hits (no pyramiding; only one position per direction at a time).
VisualizationMain Chart: Blue fast EMA and red slow EMA lines. Green background tint on long signals, red on short signals.
Volume Sub-Panel: Gray columns for normal volume, yellow for high-volume bars; zero line for reference.
RSI Sub-Panel (if enabled): Purple RSI line with overbought/oversold dashed lines.
Strengths and ConsiderationsStrengths: Simple, trend-following with volume to avoid weak signals; RSI adds mean-reversion protection; trailing stops suit trending markets like BTC.
Risks: Whipsaws in sideways markets (EMA crossovers can false-signal); volume filter may miss low-volume breakouts; trailing parameters (50/20 points) assume a specific price scale (e.g., BTC/USD in dollars—adjust for other pairs).
Best For: Higher timeframes (e.g., 1H or 4H) on volatile crypto pairs. Backtest on historical data to tune parameters.
In den Scripts nach "ema" suchen

Rasta Long/Short — StrategyThe Rasta Long/Short Strategy is a visual and educational framework designed to help traders study momentum shifts that appear when a fast EMA interacts with a slower smoothed baseline.
It is not a signal service. Instead, it is a research tool that helps you observe transitions, structure, and behavior across different market conditions and smoothing contexts.
The script plots:
A primary EMA line (fast reaction wave).
A Smoothed line (your chosen smoothing method).
Color-coded fog regions showing directional bias.
Optional DNA rung connections between the two lines for structural comparison.
Together, these allow a deeper study of how momentum pushes, volatility compression, expansions, and drift emerge around fast/slow EMA interactions.
✦ Core Idea
The Rasta Long/Short mechanism studies how price behaves when the fast EMA crosses above or below a smoothed anchor.
Rather than predicting price, it reveals where transitions occur across different structures, timeframes, and smoothing techniques.
The Long/Short logic simply highlights flips in directional structure.
It is not intended for real-time signals or automated execution; it is intended for understanding market movement.
✦ Smoothing Types (Explained)
The strategy allows experimenting with several smoothing families to observe how they transform the fast EMA:
SMA (Simple Moving Average)
Averaged, slower response. Good for stability comparisons.
EMA (Exponential)
Faster reaction, more responsive, smoother behavior during momentum.
RMA (Wilder’s)
Used in RSI calculations; steady, well-balanced response.
WMA (Weighted)
More weight to recent bars; bridges SMA and EMA dynamics.
None
Raw EMA vs EMA interaction with no secondary smoothing.
Each smoothing type provides unique structural information and can lead to different interpretations.
✦ Modes of Study
Designed for multi-timeframe research:
1H / 4H — Momentum flow mapping and structural identification.
Daily / Weekly — Higher-timeframe rotations, macro structure transitions.
1–15m — Microstructure studies, noise vs trend emergence.
Use the built-in Strategy Tester to explore entry/exit context, but treat results as research, not predictive performance.
✦ Components (Visual Study Tools)
EMA Line (Fast)
Primary reactive wave. Shows fast directional shifts.
Smoothed Line (Slow)
Trend baseline / reference structure.
Fog Region
Highlights fast-vs-smoothed directional alignment.
DNA Rungs (Optional)
Structural “bridges” showing the exact relationship between waves on each bar.
Useful for studying separation, compression, and expansions.
✦ Educational Insights
This strategy helps illuminate:
How fast and slow EMAs interact dynamically.
How structure changes precede trend emergence.
Where volatility compresses before expansion.
How noise, drift, and clean reversals differ.
How different smoothers alter the interpretation of the same price data.
The goal is clarity — not prediction.
✦ How to Use
Apply to any timeframe or instrument.
Enable or disable fog depending on preferred visibility.
Use DNA rungs for close structural comparison.
Observe long/short flips as educational reference points — not signals.
Study transitions visually, then backtest using the Strategy Tester for pattern research.
✦ Disclaimer
This script is provided for educational and research purposes only.
It does not provide trading signals, financial advice, or recommendations.
Past behavior does not indicate future performance.
Always practice risk-aware study and consult qualified financial professionals when needed.
✦ Author
Michael Culpepper (mikeyc747)
Creator of the Rasta framework and related market structure studies.

AutoTrader v3.0[by Irum]1. 스크립트 목적 / 정의
1-1. 한글 설명
이 스크립트의 목적
15분봉 BTC/USDT 같은 레버리지/선물 환경에서,
“EMA 재돌파 + BB 스퀴즈 국면”에서만 진입하고,
상위 추세(레짐 필터) + ATR 기반 리스크/수량 + ATR 트레일링 + 부분청산을 한 번에 관리하는 “올인원 자동 전략”입니다.
핵심 특징:
진입 로직
EMA(기본 9) 를 기준으로
종가가 EMA를 위로 돌파(골든크로스) & BB 폭이 좁을 때 → Long 진입 후보
종가가 EMA를 아래로 돌파(데드크로스) & BB 폭이 좁을 때 → Short 진입 후보
이걸 “Re-break + Squeeze” 구조로 설계해서,
변동성이 줄었다가 방향이 다시 나오려는 시점만 노립니다.
레짐 필터(Regime Filter)
상위 타임프레임(기본 1시간봉 HTF EMA 200)의 기울기와
ATR 빠른 선/느린 선으로
상승 추세 + 변동성 살아있는 구간만 Long 허용
하락 추세 + 변동성 살아있는 구간만 Short 허용
즉, 역추세 매매를 최대한 차단하고, 추세 방향만 따라갑니다.
Pivot 기반 손절 + ATR 리스크 기반 수량(ATR Sizing v2.1)
최근 swing low/high(피벗) 또는 일정 구간 fallback low/high를 기준으로 기술적 손절선을 잡고,
그 손절까지의 거리를 이용해,
“한 번의 손절 시 계좌의 riskPct%만 잃도록” 수량을 자동 계산합니다.
ATR 스파이크(갑작스러운 변동성 폭발) 구간은 진입 자체를 피하려고 합니다.
R-multiple 기반 TP + 부분 청산 + ATR Ladder 트레일링
진입 시점의 위험(R = Entry - SL) 을 기준으로
R 배수 기준 부분청산(예: 1R에서 50% 청산)
R 배수 기준 최종 TP(예: 2R)
포지션이 잘 가면 ATR 기반 트레일링 스탑(ATR Ladder) 을 적용해서,
이익 구간에서 손절선을 점점 끌어올려 BE(본전 이상) → 수익 보호 모드로 전환합니다.
세션 필터 / 뉴욕 뉴스피크 회피용 세션 회피
사용자가 정한 세션 안에서만 매매하거나,
특정 뉴스 타임(예: CPI, FOMC 근처 시간대)을 회피하도록 시간대를 차단할 수 있습니다.
1-2. English Description
Purpose
This strategy is an all-in-one auto-trading system designed mainly for leveraged/futures markets (e.g., BTC/USDT 15m) that:
Enters only on EMA re-break + Bollinger Band squeeze
Uses higher timeframe regime filter for trend direction
Sizes positions with ATR-based risk (v2.1)
Manages exits with R-multiple partial TP + final TP + ATR ladder trailing stop
Key points:
Entry Logic
Uses a fast EMA (default 9).
When price crosses above EMA and BB width is below threshold (squeeze) → Long signal.
When price crosses below EMA and BB width is below threshold → Short signal.
So it focuses on volatility contraction → re-expansion setups.
Regime Filter
Uses HTF EMA (default 200 EMA on 60m) slope + fast vs slow ATR:
Only allow long trades in uptrend + active volatility
Only allow short trades in downtrend + active volatility
This is to avoid counter-trend trading and align with macro trend.
Pivot-based SL + ATR Sizing v2.1
Sets SL using recent pivot highs/lows with a minimum buffer.
Computes risk per unit and chooses quantity so that riskPct % of equity is lost at SL.
Filters out trades during ATR spikes (abnormally large volatility).
R-multiple TP + Partial + ATR Ladder Trailing
Uses the initial risk (R) to:
Take partial profit at partialRR R (e.g., 1R at 50% size).
Set final TP at finalRR R or a fixed % TP.
Uses ATR ladder trailing to progressively tighten stops as price moves in favor.
Session / News Avoidance
Optionally trade only inside a custom session,
Or avoid specific time windows (e.g., high-impact news).

多指标量化交易DIY- The indicator includes a very large menu of leading tools, each with its own logic to determine uptrend or downtrend impulses. Highlights include:
- Range Filter: Uses a dynamic centerline and bands computed via conditional EMA/SMA and range sizing to define directional movement. It can operate in a default mode or an alternative “DW” mode.
- Rational Quadratic Kernel (RQK): Applies a kernel smoothing model (Nadaraya Watson) to detect uptrends and downtrends with a focus on noise reduction.
- Supertrend, Half Trend, SSL Channel: Classic trend-following tools that derive direction from ATR-based bands or moving average channels.
- Ichimoku Cloud and SuperIchi: Multi-component systems validating trend via cloud position, conversion/base line relationships, projected cloud, and lagging span.
- TSI (True Strength Index), DPO (Detrended Price Oscillator), AO (Awesome Oscillator), MACD, STC (Schaff Trend Cycle), QQE Mod: Momentum and cycle tools that parse direction from crossovers, zero-line behavior, and momentum shifts.
- Donchian Trend Ribbon, Chandelier Exit: Trend and exit tools that can validate breakouts or sustained trend strength.
- ADX/DMI: Measures trend strength and directional movement via +DI/-DI relationships and minimum ADX thresholds.
- RSI and Stochastic: Use crossovers, level exits, or threshold filters to gate entries based on overbought/oversold dynamics or relative strength trends.
- Vortex, Chaikin Money Flow, VWAP, Bull Bear Power, ROC, Wolfpack Id, Hull Suite: A diverse set of directional, momentum, and volume-based indicators to suit different markets and styles.
- Trendline Breakout and Range Detector: Price-behavior filters that confirm signals during breakouts or within defined ranges.
Confirmation Filters
- Each filter is optional. When enabled, it must validate the leading condition for a signal to pass. Examples:
- EMA Filter: Requires price to be above a specified EMA for longs and below for shorts, filtering signals that contradict broader trend or baseline levels.
- 2 EMA Cross and 3 EMA Cross: Enforce moving average cross conditions (fast above slow for long, the reverse for short) or a three-line stacking logic for more stringent trend alignment.
- RQK, Supertrend, Half Trend, Donchian, QQE, Hull, MACD (crossover vs. zero-line), AO (zero line or AC momentum variants), SSL: Each adds its characteristic validation pattern.
- RSI family (MA cross, exits OB/OS zones, threshold levels) plus RSI MA direction and RSI/RSI MA limits: Multiple ways to constrain signals via relative strength behavior and trajectories.
- Choppiness Index and Damiani Volatility: Prevent entries during ranging conditions or insufficient volatility; choppiness thresholds and volatility states gate the trade.
- VWAP, Volume modes (above MA, simple up/down, delta), Chaikin Money Flow: Volume and flow conditions that ensure signals happen in supportive liquidity or accumulation/distribution contexts.
- ADX/DMI thresholds: Demand a minimum trend strength and directional DI alignment to reduce whipsaw trades.
- Trendline Breakout and Range Detector: Confirm that the price is breaking structure or remains within active range consistent with the leading setup.
- By combining several filters you can create strict, conservative entries or looser setups depending on your goals.
Range Filter Engine
- A core building block, the Range Filter uses conditional EMA and SMA functions to compute adaptive bands around a dynamic centerline. It supports two types:
- Type 1: The centerline updates when price exceeds the band thresholds; bands define acceptable drift ranges.
- Type 2: Uses quantized steps (via floor operations) relative to the previous centerline to handle larger moves in discrete increments.
- The engine offers smoothing for range values using a secondary EMA and can switch between raw and averaged outputs. Its hi/lo bands and centerline compose a corridor that defines directional movement and potential breakout confirmation.
Signal Construction
- The script computes:
- leadinglongcond and leadingshortcond : The primary directional signals from the chosen leading indicator.
- longCond and shortCond : Final signals formed by combining the leading conditions with all enabled confirmations. Each confirmation contributes a boolean gate. If a filter is disabled, it contributes a neutral pass-through, keeping the logic intact without enforcing that condition.
- Expiry Logic: The code counts consecutive bars where the leading condition remains true. If confirmations do not line up within the user-defined “Signal Expiry Candle Count,” the setup is abandoned and the signal does not trigger.
- Alternation: An optional state ensures that long and short signals alternate. This can reduce repeated entries in the same direction without a clear reset.
- Finally, longCondition and shortCondition represent the actionable signals after expiry and alternation logic. These drive the label plotting and alert conditions.
Visualization
- Buy and Sell Labels: When longCondition or shortCondition confirm, the script plots annotated labels directly on the chart, making entries easy to see at a glance. The labels use color coding and clear text tags (“long” vs. “short”).
- Dashboard: A table summarizes the status of the leading indicator and all confirmations. Each row shows the indicator label and whether it passed (✔️) or failed (❌) on the current bar. This intensely practical UI helps you diagnose why a signal did or did not trigger, empowering faster strategy iteration and parameter tuning.
- Failed Confirmation Markers: If a setup expires (count exceeds the limit) and confirmations failed to align, the script can mark the chart with a small label and provide a tooltip listing which confirmations did not pass. It’s a helpful audit trail to understand missed trades or prevent “chasing” invalid signals.
- Data Window Values: The script outputs signal states to the data window, which can be useful for debugging or building composite conditions in multi-indicator templates.
Inputs and Parameters
- You control the indicator from a comprehensive input panel:
- Setup: Signal expiry count, whether to enforce alternating signals, and whether to display labels and the dashboard (including position and size).
- Leading Indicator: Choose the primary signal generator from the large list.
- Per-Filter Toggles: For each confirmation, a respect... toggle enables or disables it. Many include sub-options (like MACD type, Stochastic mode, RSI mode, ADX variants, thresholds for choppiness/volatility, etc.) to fine-tune behavior.
- Range Filter Settings: Choose type and behavior; select default vs. DW mode and smoothing. The underlying functions adjust band sizes using ATR, average change, standard deviation, or user-defined scales.
- Because everything is customizable, you can adapt the indicator to different assets, volatility regimes, and timeframes.
Alerts and Automation
- The script defines alert conditions tied to longCondition and shortCondition . You can set these alerts in your chart to trigger notifications or webhook calls for automated execution in external bots. The alert text is simple, and you can configure your own message template when creating alerts in the chart, including JSON payloads for algorithmic integration.
Typical Workflow
- Select a Leading Indicator aligned with your style. For trend following, Supertrend or SSL may be appropriate; for momentum, MACD or TSI; for range/trend-change detection, Range Filter, RQK, or Donchian.
- Add a few key Confirmation Filters that complement the leading signal. For example:
- Pair Supertrend with EMA Filter and RSI MA Direction to ensure trend alignment and positive momentum.
- Combine MACD Crossover with ADX/DMI and Volume Above MA to avoid signals in low-trend or low-liquidity conditions.
- Use RQK with Choppiness Index and Damiani Volatility to only act when the market is trending and volatile enough.
- Set a sensible Signal Expiry Candle Count. Shorter expiry keeps entries timely and reduces lag; longer expiry captures setups that mature slowly.
- Observe the Dashboard during live markets to see which filters pass or fail, then iterate. Tighten or loosen thresholds and filter combinations as needed.
- For automation, turn on alerts for the final conditions and use webhook payloads to notify your trading robot.
Strengths and Practical Notes
- Flexibility: The indicator is a toolkit rather than a single rigid model. It lets you test different combinations rapidly and visualize outcomes immediately.
- Clarity: Labels, dashboard, and failed-confirmation markers make it easy to audit behavior and refine settings without digging into code.
- Robustness: The expiry and alternation options add discipline, avoiding the temptation to enter late or repeatedly in one direction without a reset.
- Modular Design: The logical gates (“respect…”) make the behavior transparent: if a filter is on, it must pass; if it’s off, the signal ignores it. This keeps reasoning clean.
- Avoiding Overfitting: Because you can stack many filters, it’s tempting to over-constrain signals. Start simple (one leading indicator and one or two confirmations). Add complexity only if it demonstrably improves your edge across varied market regimes.
Limitations and Recommendations
- No single configuration is universally optimal. Markets change; tune filters for the instrument and timeframe you trade and revisit settings periodically.
- Trend filters can underperform in choppy markets; likewise, momentum filters can false-trigger in quiet periods. Consider using Choppiness Index or Damiani to gate signals by regime.
- Use expiry wisely. Too short may miss good setups that need a few bars to confirm; too long may cause late entries. Balance responsiveness and accuracy.
- Always consider risk management externally (position sizing, stops, profit targets). The indicator focuses on signal quality; combining it with robust trade management methods will improve results.
Example Configurations
- Trend-Following Setup:
- Leading: Supertrend uptrend for longs and downtrend for shorts.
- Confirmations: EMA Filter (price above 200 EMA for long, below for short), ADX/DMI (trend strength above threshold with +DI/-DI alignment), Volume Above MA.
- Expiry: 3–4 bars to keep entries timely.
- Result: Strong bias toward sustained moves while avoiding weak trends and thin liquidity.
- Mean-Reversion to Momentum Crossover:
- Leading: RSI exits from OB/OS zones (e.g., RSI leaves oversold for long and leaves overbought for short).
- Confirmations: 2 EMA Cross (fast crossing slow in the same direction), MACD zero-line behavior for added momentum validation.
- Expiry: 2–3 bars for responsive re-entry.
- Result: Captures momentum transitions after short-term extremes, with extra confirmation to reduce head-fakes.
- Range Breakout Focus:
- Leading: Range Filter Type 2 or Donchian Trend Ribbon to detect breakouts.
- Confirmations: Damiani Volatility (avoid low-volatility false breaks), Choppiness Index (prefer trend-ready states), ROC positive/negative threshold.
- Expiry: 1–3 bars to act on breakout windows.
- Result: Better alignment to breakout dynamics, gating trades by volatility and regime.
Conclusion
- This indicator is a comprehensive, configurable framework that merges a chosen leading signal with an array of corroborating filters, disciplined expiry handling, and intuitive visualization. It’s designed to help you build high-quality entry signals tailored to your approach, whether that’s trend-following, breakout trading, momentum capturing, or a hybrid. By surfacing pass/fail states in a dashboard and allowing alert-based automation, it bridges the gap between discretionary analysis and systematic execution. With sensible parameter tuning and thoughtful filter selection, it can serve as a robust backbone for signal generation across diverse instruments and timeframes.

Mikey’s Strategy (AutoEMA+)
⚙️ Core Idea:
A long-only EMA crossover strategy that automatically selects the optimal EMA length (5–25) based on historical performance using a custom scoring system.
🎯 Entry Conditions:
Price crosses above the selected EMA.
(Optional) Price is above HTF EMA200 (higher timeframe trend).
(Optional) ADX is above a minimum threshold.
(Optional) Volume is above average × multiplier.
A cooldown period has passed since the last exit.
❌ Exit Condition:
Price closes fully below the EMA (current candle: high, low, and close all below),
and the previous candle was above or touched the EMA.
🧠 Auto EMA Selection Logic:
Scans EMAs in the range (e.g., 8–21) every N bars.
Scores each EMA based on:
Time price spent above the EMA
Respect for EMA (touches)
Trend consistency
Distance from EMA (when above)
Picks the EMA with the highest valid score, and updates only if it’s significantly better.
🛡️ Risk Management:
No pyramiding (1 position max).
Cooldown period after exit.
No hard stop loss or take profit.
📊 Visuals & Alerts:
Plots the selected EMA and optional HTF EMA200.
Entry markers and info label on the chart.
Alerts for valid entries and filtered signals.

Candlestick Pattern Strategy with Smart Stop-Loss Management🔹 Strategy Overview
This strategy combines candlestick patterns with trend filtering and EMA channel confirmation to identify high-probability trading opportunities. It features a smart stop-loss management system that moves to breakeven once the trade reaches a predefined profit threshold.
📊 Key Features
✅ Multiple Candlestick Patterns – Detects classic reversal patterns like:
Hammer & Hanging Man
Bullish & Bearish Engulfing
Piercing Line & Dark Cloud Cover
Morning & Evening Star
Doji Star (Neutral Signal)
✅ Trend & EMA Channel Filters
Trend EMA (100-period) – Ensures trades align with the broader trend.
EMA Channel (50-period ± % range) – Filters trades within a defined volatility range.
✅ Flexible Trade Management
Fixed Target Points – Take profit at a predefined distance.
Trailing Stop to Cost – Moves stop-loss to breakeven after reaching a specified profit threshold.
✅ Customizable Trade Direction
Long Only / Short Only / Both – Adapt to bullish, bearish, or neutral markets.
✅ Time-Based Execution
Intraday Mode – Trades only within specified session hours.
Positional Mode – Holds trades beyond the session.
⚙️ Input Parameters
Trend Filter – Enable/disable trend alignment with EMA.
EMA Channel Filter – Adjust channel width for volatility control.
Candlestick Patterns – Toggle individual patterns on/off.
Target Points & Trail Trigger – Customize profit-taking and SL management.
Trade Type – Switch between intraday and positional trading.
📈 Entry Conditions
Long Entry:
Bullish candlestick pattern (Hammer, Bullish Engulfing, Piercing Line, Morning Star).
Price above Trend EMA (if enabled).
RSI < 30 (oversold confirmation).
Within EMA Channel (if enabled).
Short Entry:
Bearish candlestick pattern (Hanging Man, Bearish Engulfing, Dark Cloud Cover, Evening Star).
Price below Trend EMA (if enabled).
RSI > 70 (overbought confirmation).
Within EMA Channel (if enabled).
📉 Exit Conditions
Take Profit (TP): Fixed target based on points.
Stop-Loss (SL): Moves to breakeven after hitting the trail trigger.
📊 Visual Indicators
Trend EMA (Orange Line) – Main trend direction.
EMA Channel (Blue Lines) – Volatility range.
Buy/Sell Labels – Entry signals below/above bars.
Doji Star (Gray Cross) – Neutral signal.
🎯 Best Suited For
Swing Traders (Positional Mode)
Intraday Traders (Scalping with tight stops)
Price Action Enthusiasts (Candlestick-based entries)
🔗 Try it out and customize it to fit your trading style! 🚀

GStrategy 1000Pepe 15mTrend Following Candlestick Strategy with EMA Filter and Exit Delay
Strategy Concept
This strategy combines candlestick patterns with EMA trend filtering to identify high-probability trade entries, featuring:
Entry Signals: Hammer and Engulfing patterns confirmed by EMA trend
Trend Filter: Fast EMA (20) vs Slow EMA (50) crossover system
Risk Management: 5% stop-loss + 1% trailing stop
Smart Exit: 2-bar delay after exit signals to avoid whipsaws
Key Components
Trend Identification:
Uptrend: Fast EMA > Slow EMA AND rising
Downtrend: Fast EMA < Slow EMA AND falling
Entry Conditions:
pinescript
// Bullish Entry (Long)
longCondition = (Hammer OR Bullish Engulfing)
AND Uptrend
AND no existing position
// Bearish Entry (Short)
shortCondition = Bearish Engulfing
AND Downtrend
AND no existing position
Exit Mechanics:
Primary Exit: EMA crossover (Fast crosses Slow)
Delayed Execution: Waits 2 full candles after signal
Emergency Exits:
5% fixed stop-loss
1% trailing stop
Visual Dashboard:
Colored EMA lines (Blue=Fast, Red=Slow)
Annotated candlestick patterns
Background highlighting for signals
Distinct markers for entries/exits
Unique Features
Pattern Recognition:
Enhanced Hammer detection (strict body/wick ratios)
Multi-candle engulfing confirmation
Trend-Confirmation:
Requires price and EMA alignment
Filters counter-trend patterns
Exit Optimization:
pinescript
// Delay implementation
if exit_signal_triggered
counter := 2 // Start countdown
else if counter > 0
counter -= 1 // Decrement each bar
exit_trade = (counter == 1) // Execute on final bar
Risk Parameters
Parameter Value Description
Stop Loss 5% Fixed risk per trade
Trailing Stop 1% Locks in profits
Exit Delay 2 bars Reduces false exits
Position Size 100% No pyramiding
Visualization Examples
🟢 Green Triangle: Bullish entry
🔴 Red Triangle: Bearish entry
⬇️ Blue X: Long exit (after delay)
⬆️ Green X: Short exit (after delay)
🎯 Pattern Labels: Identifies hammer/engulfing
Recommended Use
Timeframes: 1H-4H (reduces noise)
Markets: Trend-prone assets (FX, indices)
Best Conditions: Strong trending markets
Avoid: Choppy/Ranging markets

Bober XM v2.0# ₿ober XM v2.0 Trading Bot Documentation
**Developer's Note**: While our previous Bot 1.3.1 was removed due to guideline violations, this setback only fueled our determination to create something even better. Rising from this challenge, Bober XM 2.0 emerges not just as an update, but as a complete reimagining with multi-timeframe analysis, enhanced filters, and superior adaptability. This adversity pushed us to innovate further and deliver a strategy that's smarter, more agile, and more powerful than ever before. Challenges create opportunity - welcome to Cryptobeat's finest work yet.
## !!!!You need to tune it for your own pair and timeframe and retune it periodicaly!!!!!
## Overview
The ₿ober XM v2.0 is an advanced dual-channel trading bot with multi-timeframe analysis capabilities. It integrates multiple technical indicators, customizable risk management, and advanced order execution via webhook for automated trading. The bot's distinctive feature is its separate channel systems for long and short positions, allowing for asymmetric trade strategies that adapt to different market conditions across multiple timeframes.
### Key Features
- **Multi-Timeframe Analysis**: Analyze price data across multiple timeframes simultaneously
- **Dual Channel System**: Separate parameter sets for long and short positions
- **Advanced Entry Filters**: RSI, Volatility, Volume, Bollinger Bands, and KEMAD filters
- **Machine Learning Moving Average**: Adaptive prediction-based channels
- **Multiple Entry Strategies**: Breakout, Pullback, and Mean Reversion modes
- **Risk Management**: Customizable stop-loss, take-profit, and trailing stop settings
- **Webhook Integration**: Compatible with external trading bots and platforms
### Strategy Components
| Component | Description |
|---------|-------------|
| **Dual Channel Trading** | Uses either Keltner Channels or Machine Learning Moving Average (MLMA) with separate settings for long and short positions |
| **MLMA Implementation** | Machine learning algorithm that predicts future price movements and creates adaptive bands |
| **Pivot Point SuperTrend** | Trend identification and confirmation system based on pivot points |
| **Three Entry Strategies** | Choose between Breakout, Pullback, or Mean Reversion approaches |
| **Advanced Filter System** | Multiple customizable filters with multi-timeframe support to avoid false signals |
| **Custom Exit Logic** | Exits based on OBV crossover of its moving average combined with pivot trend changes |
### Note for Novice Users
This is a fully featured real trading bot and can be tweaked for any ticker — SOL is just an example. It follows this structure:
1. **Indicator** – gives the initial signal
2. **Entry strategy** – decides when to open a trade
3. **Exit strategy** – defines when to close it
4. **Trend confirmation** – ensures the trade follows the market direction
5. **Filters** – cuts out noise and avoids weak setups
6. **Risk management** – controls losses and protects your capital
To tune it for a different pair, you'll need to start from scratch:
1. Select the timeframe (candle size)
2. Turn off all filters and trend entry/exit confirmations
3. Choose a channel type, channel source and entry strategy
4. Adjust risk parameters
5. Tune long and short settings for the channel
6. Fine-tune the Pivot Point Supertrend and Main Exit condition OBV
This will generate a lot of signals and activity on the chart. Your next task is to find the right combination of filters and settings to reduce noise and tune it for profitability.
### Default Strategy values
Default values are tuned for: Symbol BITGET:SOLUSDT.P 5min candle
Filters are off by default: Try to play with it to understand how it works
## Configuration Guide
### General Settings
| Setting | Description | Default Value |
|---------|-------------|---------------|
| **Long Positions** | Enable or disable long trades | Enabled |
| **Short Positions** | Enable or disable short trades | Enabled |
| **Risk/Reward Area** | Visual display of stop-loss and take-profit zones | Enabled |
| **Long Entry Source** | Price data used for long entry signals | hl2 (High+Low/2) |
| **Short Entry Source** | Price data used for short entry signals | hl2 (High+Low/2) |
The bot allows you to trade long positions, short positions, or both simultaneously. Each direction has its own set of parameters, allowing for fine-tuned strategies that recognize the asymmetric nature of market movements.
### Multi-Timeframe Settings
1. **Enable Multi-Timeframe Analysis**: Toggle 'Enable Multi-Timeframe Analysis' in the Multi-Timeframe Settings section
2. **Configure Timeframes**: Set appropriate higher timeframes based on your trading style:
- Timeframe 1: Default is now 15 minutes (intraday confirmation)
- Timeframe 2: Default is 4 hours (trend direction)
3. **Select Sources per Indicator**: For each indicator (RSI, KEMAD, Volume, etc.), choose:
- The desired timeframe (current, mtf1, or mtf2)
- The appropriate price type (open, high, low, close, hl2, hlc3, ohlc4)
### Entry Strategies
- **Breakout**: Enter when price breaks above/below the channel
- **Pullback**: Enter when price pulls back to the channel
- **Mean Reversion**: Enter when price is extended from the channel
You can enable different strategies for long and short positions.
### Core Components
### Risk Management
- **Position Size**: Control risk with percentage-based position sizing
- **Stop Loss Options**:
- Fixed: Set a specific price or percentage from entry
- ATR-based: Dynamic stop-loss based on market volatility
- Swing: Uses recent swing high/low points
- **Take Profit**: Multiple targets with percentage allocation
- **Trailing Stop**: Dynamic stop that follows price movement
## Advanced Usage Strategies
### Moving Average Type Selection Guide
- **SMA**: More stable in choppy markets, good for higher timeframes
- **EMA/WMA**: More responsive to recent price changes, better for entry signals
- **VWMA**: Adds volume weighting for stronger trends, use with Volume filter
- **HMA**: Balance between responsiveness and noise reduction, good for volatile markets
### Multi-Timeframe Strategy Approaches
- **Trend Confirmation**: Use higher timeframe RSI (mtf2) for overall trend, current timeframe for entries
- **Entry Precision**: Use KEMAD on current timeframe with volume filter on mtf1
- **False Signal Reduction**: Apply RSI filter on mtf1 with strict KEMAD settings
### Market Condition Optimization
| Market Condition | Recommended Settings |
|------------------|----------------------|
| **Trending** | Use Breakout strategy with KEMAD filter on higher timeframe |
| **Ranging** | Use Mean Reversion with strict RSI filter (mtf1) |
| **Volatile** | Increase ATR multipliers, use HMA for moving averages |
| **Low Volatility** | Decrease noise parameters, use pullback strategy |
## Webhook Integration
The strategy features a professional webhook system that allows direct connectivity to your exchange or trading platform of choice through third-party services like 3commas, Alertatron, or Autoview.
The webhook payload includes all necessary parameters for automated execution:
- Entry price and direction
- Stop loss and take profit levels
- Position size
- Custom identifier for webhook routing
## Performance Optimization Tips
1. **Start with Defaults**: Begin with the default settings for your timeframe before customizing
2. **Adjust One Component at a Time**: Make incremental changes and test the impact
3. **Match MA Types to Market Conditions**: Use appropriate moving average types based on the Market Condition Optimization table
4. **Timeframe Synergy**: Create logical relationships between timeframes (e.g., 5min chart with 15min and 4h higher timeframes)
5. **Periodic Retuning**: Markets evolve - regularly review and adjust parameters
## Common Setups
### Crypto Trend-Following
- MLMA with EMA or HMA
- Higher RSI thresholds (75/25)
- KEMAD filter on mtf1
- Breakout entry strategy
### Stock Swing Trading
- MLMA with SMA for stability
- Volume filter with higher threshold
- KEMAD with increased filter order
- Pullback entry strategy
### Forex Scalping
- MLMA with WMA and lower noise parameter
- RSI filter on current timeframe
- Use highest timeframe for trend direction only
- Mean Reversion strategy
## Webhook Configuration
- **Benefits**:
- Automated trade execution without manual intervention
- Immediate response to market conditions
- Consistent execution of your strategy
- **Implementation Notes**:
- Requires proper webhook configuration on your exchange or platform
- Test thoroughly with small position sizes before full deployment
- Consider latency between signal generation and execution
### Backtesting Period
Define a specific historical period to evaluate the bot's performance:
| Setting | Description | Default Value |
|---------|-------------|---------------|
| **Start Date** | Beginning of backtest period | January 1, 2025 |
| **End Date** | End of backtest period | December 31, 2026 |
- **Best Practice**: Test across different market conditions (bull markets, bear markets, sideways markets)
- **Limitation**: Past performance doesn't guarantee future results
## Entry and Exit Strategies
### Dual-Channel System
A key innovation of the Bober XM is its dual-channel approach:
- **Independent Parameters**: Each trade direction has its own channel settings
- **Asymmetric Trading**: Recognizes that markets often behave differently in uptrends versus downtrends
- **Optimized Performance**: Fine-tune settings for both bullish and bearish conditions
This approach allows the bot to adapt to the natural asymmetry of markets, where uptrends often develop gradually while downtrends can be sharp and sudden.
### Channel Types
#### 1. Keltner Channels
Traditional volatility-based channels using EMA and ATR:
| Setting | Long Default | Short Default |
|---------|--------------|---------------|
| **EMA Length** | 37 | 20 |
| **ATR Length** | 13 | 17 |
| **Multiplier** | 1.4 | 1.9 |
| **Source** | low | high |
- **Strengths**:
- Reliable in trending markets
- Less prone to whipsaws than Bollinger Bands
- Clear visual representation of volatility
- **Weaknesses**:
- Can lag during rapid market changes
- Less effective in choppy, non-trending markets
#### 2. Machine Learning Moving Average (MLMA)
Advanced predictive model using kernel regression (RBF kernel):
| Setting | Description | Options |
|---------|-------------|--------|
| **Source MA** | Price data used for MA calculations | Any price source (low/high/close/etc.) |
| **Moving Average Type** | Type of MA algorithm for calculations | SMA, EMA, WMA, VWMA, RMA, HMA |
| **Trend Source** | Price data used for trend determination | Any price source (close default) |
| **Window Size** | Historical window for MLMA calculations | 5+ (default: 16) |
| **Forecast Length** | Number of bars to forecast ahead | 1+ (default: 3) |
| **Noise Parameter** | Controls smoothness of prediction | 0.01+ (default: ~0.43) |
| **Band Multiplier** | Multiplier for channel width | 0.1+ (default: 0.5-0.6) |
- **Strengths**:
- Predictive rather than reactive
- Adapts quickly to changing market conditions
- Better at identifying trend reversals early
- **Weaknesses**:
- More computationally intensive
- Requires careful parameter tuning
- Can be sensitive to input data quality
### Entry Strategies
| Strategy | Description | Ideal Market Conditions |
|----------|-------------|-------------------------|
| **Breakout** | Enters when price breaks through channel bands, indicating strong momentum | High volatility, emerging trends |
| **Pullback** | Enters when price retraces to the middle band after testing extremes | Established trends with regular pullbacks |
| **Mean Reversion** | Enters at channel extremes, betting on a return to the mean | Range-bound or oscillating markets |
#### Breakout Strategy (Default)
- **Implementation**: Enters long when price crosses above the upper band, short when price crosses below the lower band
- **Strengths**: Captures strong momentum moves, performs well in trending markets
- **Weaknesses**: Can lead to late entries, higher risk of false breakouts
- **Optimization Tips**:
- Increase channel multiplier for fewer but more reliable signals
- Combine with volume confirmation for better accuracy
#### Pullback Strategy
- **Implementation**: Enters long when price pulls back to middle band during uptrend, short during downtrend pullbacks
- **Strengths**: Better entry prices, lower risk, higher probability setups
- **Weaknesses**: Misses some strong moves, requires clear trend identification
- **Optimization Tips**:
- Use with trend filters to confirm overall direction
- Adjust middle band calculation for market volatility
#### Mean Reversion Strategy
- **Implementation**: Enters long at lower band, short at upper band, expecting price to revert to the mean
- **Strengths**: Excellent entry prices, works well in ranging markets
- **Weaknesses**: Dangerous in strong trends, can lead to fighting the trend
- **Optimization Tips**:
- Implement strong trend filters to avoid counter-trend trades
- Use smaller position sizes due to higher risk nature
### Confirmation Indicators
#### Pivot Point SuperTrend
Combines pivot points with ATR-based SuperTrend for trend confirmation:
| Setting | Default Value |
|---------|---------------|
| **Pivot Period** | 25 |
| **ATR Factor** | 2.2 |
| **ATR Period** | 41 |
- **Function**: Identifies significant market turning points and confirms trend direction
- **Implementation**: Requires price to respect the SuperTrend line for trade confirmation
#### Weighted Moving Average (WMA)
Provides additional confirmation layer for entries:
| Setting | Default Value |
|---------|---------------|
| **Period** | 15 |
| **Source** | ohlc4 (average of Open, High, Low, Close) |
- **Function**: Confirms trend direction and filters out low-quality signals
- **Implementation**: Price must be above WMA for longs, below for shorts
### Exit Strategies
#### On-Balance Volume (OBV) Based Exits
Uses volume flow to identify potential reversals:
| Setting | Default Value |
|---------|---------------|
| **Source** | ohlc4 |
| **MA Type** | HMA (Options: SMA, EMA, WMA, RMA, VWMA, HMA) |
| **Period** | 22 |
- **Function**: Identifies divergences between price and volume to exit before reversals
- **Implementation**: Exits when OBV crosses its moving average in the opposite direction
- **Customizable MA Type**: Different MA types provide varying sensitivity to OBV changes:
- **SMA**: Traditional simple average, equal weight to all periods
- **EMA**: More weight to recent data, responds faster to price changes
- **WMA**: Weighted by recency, smoother than EMA
- **RMA**: Similar to EMA but smoother, reduces noise
- **VWMA**: Factors in volume, helpful for OBV confirmation
- **HMA**: Reduces lag while maintaining smoothness (default)
#### ADX Exit Confirmation
Uses Average Directional Index to confirm trend exhaustion:
| Setting | Default Value |
|---------|---------------|
| **ADX Threshold** | 35 |
| **ADX Smoothing** | 60 |
| **DI Length** | 60 |
- **Function**: Confirms trend weakness before exiting positions
- **Implementation**: Requires ADX to drop below threshold or DI lines to cross
## Filter System
### RSI Filter
- **Function**: Controls entries based on momentum conditions
- **Parameters**:
- Period: 15 (default)
- Overbought level: 71
- Oversold level: 23
- Multi-timeframe support: Current, MTF1 (15min), or MTF2 (4h)
- Customizable price source (open, high, low, close, hl2, hlc3, ohlc4)
- **Implementation**: Blocks long entries when RSI > overbought, short entries when RSI < oversold
### Volatility Filter
- **Function**: Prevents trading during excessive market volatility
- **Parameters**:
- Measure: ATR (Average True Range)
- Period: Customizable (default varies by timeframe)
- Threshold: Adjustable multiplier
- Multi-timeframe support
- Customizable price source
- **Implementation**: Blocks trades when current volatility exceeds threshold × average volatility
### Volume Filter
- **Function**: Ensures adequate market liquidity for trades
- **Parameters**:
- Threshold: 0.4× average (default)
- Measurement period: 5 (default)
- Moving average type: Customizable (HMA default)
- Multi-timeframe support
- Customizable price source
- **Implementation**: Requires current volume to exceed threshold × average volume
### Bollinger Bands Filter
- **Function**: Controls entries based on price relative to statistical boundaries
- **Parameters**:
- Period: Customizable
- Standard deviation multiplier: Adjustable
- Moving average type: Customizable
- Multi-timeframe support
- Customizable price source
- **Implementation**: Can require price to be within bands or breaking out of bands depending on strategy
### KEMAD Filter (Kalman EMA Distance)
- **Function**: Advanced trend confirmation using Kalman filter algorithm
- **Parameters**:
- Process Noise: 0.35 (controls smoothness)
- Measurement Noise: 24 (controls reactivity)
- Filter Order: 6 (higher = more smoothing)
- ATR Length: 8 (for bandwidth calculation)
- Upper Multiplier: 2.0 (for long signals)
- Lower Multiplier: 2.7 (for short signals)
- Multi-timeframe support
- Customizable visual indicators
- **Implementation**: Generates signals based on price position relative to Kalman-filtered EMA bands
## Risk Management System
### Position Sizing
Automatically calculates position size based on account equity and risk parameters:
| Setting | Default Value |
|---------|---------------|
| **Risk % of Equity** | 50% |
- **Implementation**:
- Position size = (Account equity × Risk %) ÷ (Entry price × Stop loss distance)
- Adjusts automatically based on volatility and stop placement
- **Best Practices**:
- Start with lower risk percentages (1-2%) until strategy is proven
- Consider reducing risk during high volatility periods
### Stop-Loss Methods
Multiple stop-loss calculation methods with separate configurations for long and short positions:
| Method | Description | Configuration |
|--------|-------------|---------------|
| **ATR-Based** | Dynamic stops based on volatility | ATR Period: 14, Multiplier: 2.0 |
| **Percentage** | Fixed percentage from entry | Long: 1.5%, Short: 1.5% |
| **PIP-Based** | Fixed currency unit distance | 10.0 pips |
- **Implementation Notes**:
- ATR-based stops adapt to changing market volatility
- Percentage stops maintain consistent risk exposure
- PIP-based stops provide precise control in stable markets
### Trailing Stops
Locks in profits by adjusting stop-loss levels as price moves favorably:
| Setting | Default Value |
|---------|---------------|
| **Stop-Loss %** | 1.5% |
| **Activation Threshold** | 2.1% |
| **Trailing Distance** | 1.4% |
- **Implementation**:
- Initial stop remains fixed until profit reaches activation threshold
- Once activated, stop follows price at specified distance
- Locks in profit while allowing room for normal price fluctuations
### Risk-Reward Parameters
Defines the relationship between risk and potential reward:
| Setting | Default Value |
|---------|---------------|
| **Risk-Reward Ratio** | 1.4 |
| **Take Profit %** | 2.4% |
| **Stop-Loss %** | 1.5% |
- **Implementation**:
- Take profit distance = Stop loss distance × Risk-reward ratio
- Higher ratios require fewer winning trades for profitability
- Lower ratios increase win rate but reduce average profit
### Filter Combinations
The strategy allows for simultaneous application of multiple filters:
- **Recommended Combinations**:
- Trending markets: RSI + KEMAD filters
- Ranging markets: Bollinger Bands + Volatility filters
- All markets: Volume filter as minimum requirement
- **Performance Impact**:
- Each additional filter reduces the number of trades
- Quality of remaining trades typically improves
- Optimal combination depends on market conditions and timeframe
### Multi-Timeframe Filter Applications
| Filter Type | Current Timeframe | MTF1 (15min) | MTF2 (4h) |
|-------------|-------------------|-------------|------------|
| RSI | Quick entries/exits | Intraday trend | Overall trend |
| Volume | Immediate liquidity | Sustained support | Market participation |
| Volatility | Entry timing | Short-term risk | Regime changes |
| KEMAD | Precise signals | Trend confirmation | Major reversals |
## Visual Indicators and Chart Analysis
The bot provides comprehensive visual feedback on the chart:
- **Channel Bands**: Keltner or MLMA bands showing potential support/resistance
- **Pivot SuperTrend**: Colored line showing trend direction and potential reversal points
- **Entry/Exit Markers**: Annotations showing actual trade entries and exits
- **Risk/Reward Zones**: Visual representation of stop-loss and take-profit levels
These visual elements allow for:
- Real-time strategy assessment
- Post-trade analysis and optimization
- Educational understanding of the strategy logic
## Implementation Guide
### TradingView Setup
1. Load the script in TradingView Pine Editor
2. Apply to your preferred chart and timeframe
3. Adjust parameters based on your trading preferences
4. Enable alerts for webhook integration
### Webhook Integration
1. Configure webhook URL in TradingView alerts
2. Set up receiving endpoint on your trading platform
3. Define message format matching the bot's output
4. Test with small position sizes before full deployment
### Optimization Process
1. Backtest across different market conditions
2. Identify parameter sensitivity through multiple tests
3. Focus on risk management parameters first
4. Fine-tune entry/exit conditions based on performance metrics
5. Validate with out-of-sample testing
## Performance Considerations
### Strengths
- Adaptability to different market conditions through dual channels
- Multiple layers of confirmation reducing false signals
- Comprehensive risk management protecting capital
- Machine learning integration for predictive edge
### Limitations
- Complex parameter set requiring careful optimization
- Potential over-optimization risk with so many variables
- Computational intensity of MLMA calculations
- Dependency on proper webhook configuration for execution
### Best Practices
- Start with conservative risk settings (1-2% of equity)
- Test thoroughly in demo environment before live trading
- Monitor performance regularly and adjust parameters
- Consider market regime changes when evaluating results
## Conclusion
The ₿ober XM v2.0 represents a significant evolution in trading strategy design, combining traditional technical analysis with machine learning elements and multi-timeframe analysis. The core strength of this system lies in its adaptability and recognition of market asymmetry.
### Market Asymmetry and Adaptive Approach
The strategy acknowledges a fundamental truth about markets: bullish and bearish phases behave differently and should be treated as distinct environments. The dual-channel system with separate parameters for long and short positions directly addresses this asymmetry, allowing for optimized performance regardless of market direction.
### Targeted Backtesting Philosophy
It's counterproductive to run backtests over excessively long periods. Markets evolve continuously, and strategies that worked in previous market regimes may be ineffective in current conditions. Instead:
- Test specific market phases separately (bull markets, bear markets, range-bound periods)
- Regularly re-optimize parameters as market conditions change
- Focus on recent performance with higher weight than historical results
- Test across multiple timeframes to ensure robustness
### Multi-Timeframe Analysis as a Game-Changer
The integration of multi-timeframe analysis fundamentally transforms the strategy's effectiveness:
- **Increased Safety**: Higher timeframe confirmations reduce false signals and improve trade quality
- **Context Awareness**: Decisions made with awareness of larger trends reduce adverse entries
- **Adaptable Precision**: Apply strict filters on lower timeframes while maintaining awareness of broader conditions
- **Reduced Noise**: Higher timeframe data naturally filters market noise that can trigger poor entries
The ₿ober XM v2.0 provides traders with a framework that acknowledges market complexity while offering practical tools to navigate it. With proper setup, realistic expectations, and attention to changing market conditions, it delivers a sophisticated approach to systematic trading that can be continuously refined and optimized.

Kitti-Playbook HHV LLV Simulation R0 Feb 4 2022
Objective : Visualization the result of price movement cross Higher High - Lower Low to generate Long Short Signal
Study The change of Equity curve when Changes
1) Look back for Higher High - Lower Low
2) Number of Position size
3) Type of Suorce
4) Effected when use EMA 12-26 filter
5) Effected form equity adjustment
6) Effected form margin adjustment
Conditions :
Long Conditions
If EMA 12-26 filter off
1)Source cross over Higher High value of price look back ' x ' bars
2) Addition 1 position when Source cross over Higher High value of price look back ' x ' bars again
3) Maximum Number of Long position not more than set up from input
If EMA 12-26 filter on
1)Source cross over Higher High value of price look back ' x ' bars and EMA 12 > EMA26
2) Addition 1 position when Source cross over Higher High value of price look back ' x ' bars again and EMA 12 > EMA 26
3) Maximum Number of Long position not more than set up from input
Exit long Condition
Exit all positions when Source cross under Lower Low value of price look back ' x ' bars
Short Conditions
If EMA 12-26 filter off
1)Source cross under Lower Low value of price look back ' x ' bars
2) Addition 1 position when Source cross under Lower Lower value of price look back ' x ' bars again
3) Maximum Number of Long position not more than set up from input
If EMA 12-26 filter on
1)Source cross under Lower Lower value of price look back ' x ' bars and EMA 12 < EMA26
2) Addition 1 position when Source cross under lower Low value of price look back ' x ' bars again and EMA 12 < EMA 26
3) Maximum Number of Short position not more than set up from input
Exit Short Condition
Exit all positions when Source cross Over Higher High value of price look back ' x ' bars
Program flow :
1) Initial Strategy Setting
2) Initial Input Setting
3) Data Processing
4) STRATEGY Entry And Exit
5) Information of System selection
6) Dashboard for result

XPloRR MA-Buy ATR-Trailing-Stop Long Term Strategy Beating B&HXPloRR MA-Buy ATR-MA-Trailing-Stop Strategy
Long term MA Trailing Stop strategy to beat Buy&Hold strategy
None of the strategies that I tested can beat the long term Buy&Hold strategy. That's the reason why I wrote this strategy.
Purpose: beat Buy&Hold strategy with around 10 trades. 100% capitalize sold trade into new trade.
My buy strategy is triggered by the EMA(blue) crossing over the SMA curve(orange).
My sell strategy is triggered by another EMA(lime) of the close value crossing the trailing stop(green) value.
The trailing stop value(green) is set to a multiple of the ATR(15) value.
ATR(15) is the SMA(15) value of the difference between high and low values.
Every stock has it's own "DNA", so first thing to do is find the right parameters to get the best strategy values voor EMA, SMA and Trailing Stop.
Then keep using these parameter for future buy/sell signals only for that particular stock.
Do the same for other stocks.
Here are the parameters:
Exponential MA: buy trigger when crossing over the SMA value (use values between 11-50)
Simple MA: buy trigger when EMA crosses over the SMA value (use values between 20 and 200)
Stop EMA: sell trigger when Stop EMA of close value crosses under the trailing stop value (use values between 8 and 16)
Trailing Stop #ATR: defines the trailing stop value as a multiple of the ATR(15) value
Example parameters for different stocks (Start capital: 1000, Order=100% of equity, Period 1/1/2005 to now):
BAR(Barco): EMA=11, SMA=82, StopEMA=12, Stop#ATR=9
Buy&HoldProfit: 45.82%, NetProfit: 294.7%, #Trades:8, %Profit:62.5%, ProfitFactor: 12.539
AAPL(Apple): EMA=12, SMA=45, StopEMA=12, Stop#ATR=6
Buy&HoldProfit: 2925.86%, NetProfit: 4035.92%, #Trades:10, %Profit:60%, ProfitFactor: 6.36
BEKB(Bekaert): EMA=12, SMA=42, StopEMA=12, Stop#ATR=7
Buy&HoldProfit: 81.11%, NetProfit: 521.37%, #Trades:10, %Profit:60%, ProfitFactor: 2.617
SOLB(Solvay): EMA=12, SMA=63, StopEMA=11, Stop#ATR=8
Buy&HoldProfit: 43.61%, NetProfit: 151.4%, #Trades:8, %Profit:75%, ProfitFactor: 3.794
PHIA(Philips): EMA=11, SMA=80, StopEMA=8, Stop#ATR=10
Buy&HoldProfit: 56.79%, NetProfit: 198.46%, #Trades:6, %Profit:83.33%, ProfitFactor: 23.07
I am very curious to see the parameters for your stocks and please make suggestions to improve this strategy.

NEXT GEN INSPIRED BY OLIVER VELEZDYOR NFA
1. Initial Setup & Application
Load the Strategy to your desired chart (e.g., EURUSD M5, as suggested by the script's backtest).
Overlay: Ensure the script is set to overlay=true (which it is) so the signals and Moving Averages plot directly on the price chart.
Equity Management: Review the initial strategy settings for capital and position sizing:
Initial Capital: Defaults to 10,000.
Default Qty Type: Set to strategy.percent_of_equity (22%), meaning 22% of your available equity is used per trade. Adjust this percentage based on your personal risk tolerance.
2. Reviewing Key Indicator Inputs
The script uses default values that are optimized, but you can adjust them in the settings panel:
Fast EMA: Defaults to 9 (e.g., a 9-period Exponential Moving Average).
Slow EMA: Defaults to 21 (e.g., a 21-period Exponential Moving Average). These EMAs define the short-term trend.
ATR: Defaults to 14 (Average True Range). Used to dynamically calculate volatility for SL/TP distances.
Final R:R: Defaults to 4.5 (minimum R:R required for a signal). This is the core of the strategy's high reward goal.
3. Interpreting Entry Signals
A trade signal is generated only when all conditions—EMA trend, "Elephant Logic" momentum, and non-ranging market—are met.
Long Signal: Appears as a green triangle (▲) below the bar, labeled "COMBO".
Short Signal: Appears as a red triangle (▼) above the bar, labeled "COMBO".
Live Plan: Upon signal, a detailed label is immediately plotted on the chart showing the FULL BATTLE PLAN:
SL: Calculated Stop Loss price.
TP: Calculated Take Profit price (based on the Final R:R).
Risk/Reward Pips: The calculated pips for the trade's risk and reward.
R:R = 1:4.5: The exact Risk-to-Reward ratio.
4. Understanding Market Conditions & Visuals
The script provides visuals to help you understand the current market state:
Trend EMAs: The 9 EMA (green) and 21 EMA (purple/magenta) are plotted to show the underlying trend.
Long trades only fire when Price > 9 EMA > 21 EMA.
Short trades only fire when Price < 9 EMA < 21 EMA.
Ranging Market (Rejection): Bars turn a light gray/silver when the proprietary "Reject Ranging" logic is active, indicating a low-volatility period. No new trades will be taken during these bars.
Momentum Bar: Bars turn a gold/yellow color when the "Elephant Logic" (high-momentum, large-body candles over 2-3 periods) is detected, highlighting powerful price movement.
5. Execution and Exit Logic
The strategy handles entry, scaling, and exit automatically:
Entry: A market order is placed (strategy.entry) immediately upon the bar where the longSetup or shortSetup condition is met.
Scaling Out (+1R): If the trade moves favorably by an amount equal to the initial risk (1R), the script closes a portion of the position (strategy.close with comment "+1R"). This partial exit locks in profit equivalent to the initial risk.
Re-entry (Pyramiding): After the +1R exit, the strategy attempts a re-entry (LONG RE/SHORT RE diamond plot) if the price meets certain criteria near the 9 EMA, trying to capitalize on further trend continuation.
Final Exits:
Take Profit: A limit order is set at the calculated TP level (stopDist * minRR).
Stop Loss: A stop order is set at the calculated SL level (stopDist * 1.3), slightly wider than the initial SL distance, likely to account for spread/slippage, ensuring the maximum loss is defined.
Trailing Stop: A trailing stop is applied to the re-entry positions (LONG RE/SHORT RE) to protect profits as the market moves further in the direction of the trade.

U.T.M.S v2🇷🇺 ОПИСАНИЕ (РУССКИЙ)
U.T.M.S v2 — Чистый EMA-кроссовер с фильтрами
Стратегия для 15м (в первую очередь) и 1ч таймфреймов.
Генерирует сигналы при пересечении EMA(8) и EMA(19) только при подтверждении тренда, объёма, волатильности и времени суток.
Каждая сделка закрывается по фиксированному Take Profit и Stop Loss.
✅ Минимум ложных входов
✅ Работает только в ликвидные часы
✅ Полная фильтрация шума и флэта
🔧 Настройки:
Fast EMA / Slow EMA — периоды скользящих (по умолчанию 8 / 19)
Take Profit % — уровень фиксации прибыли (рек. 2.5%)
Stop Loss % — уровень стоп-лосса (рек. 2.0%)
Фильтры (все включены по умолчанию):
Use 1H Trend Filter — вход разрешён только по направлению тренда на 1H (EMA50 > EMA200 для лонга)
Use Volume Filter — объём должен быть ≥ 1.5× среднего за 20 баров
Min Volume Multiplier — нижний порог объёма (рек. 1.5)
Max Volume Multiplier — верхний порог (рек. 3.0–4.0), отсекает аномальные пампы
Use ATR Volatility Filter — минимальная волатильность (рек. 0.3%)
Use Time Filter (UTC) — торговля только в часы высокой ликвидности: 12:00–18:00 и 20:00–02:00 UTC
💡 Идеальна для ручной торговли или подключения сигнальных ботов.
🇬🇧 DESCRIPTION (ENGLISH)
U.T.M.S v2 — Clean EMA Crossover with Filters
Strategy for 15m (primarily) and 1h timeframes.
Generates signals when the EMA(8) and EMA(19) cross, only if trend, volume, volatility, and time of day are confirmed.
Each trade is closed with a fixed Take Profit and Stop Loss.
✅ Low noise, high-quality signals
✅ Active only during high-liquidity hours
✅ Fully protected against flat and fakeouts
🔧 Inputs:
Fast EMA / Slow EMA — moving average periods (default: 8 / 19)
Take Profit % — profit target (suggested: 2.5%)
Stop Loss % — stop loss level (suggested: 2.0%)
Filters (all enabled by default):
Use 1H Trend Filter — trades only in 1H trend direction (EMA50 > EMA200 for long)
Use Volume Filter — volume must be ≥ 1.5× 20-bar average
Min Volume Multiplier — minimum volume threshold (suggested: 1.5)
Max Volume Multiplier — maximum volume cap (suggested: 3.0–4.0), filters out pumps/dumps
Use ATR Volatility Filter — minimum volatility (suggested: 0.3%)
Use Time Filter (UTC) — active only during high-liquidity sessions: 12:00–18:00 & 20:00–02:00 UTC
💡 Perfect for manual trading or webhook-based signal bots.

Ultimate Scalping Strategy v2Strategy Overview
This is a versatile scalping strategy designed primarily for low timeframes (like 1-min, 3-min, or 5-min charts). Its core logic is based on a classic EMA (Exponential Moving Average) crossover system, which is then filtered by the VWAP (Volume-Weighted Average Price) to confirm the trade's direction in alignment with the market's current intraday sentiment.
The strategy is highly customizable, allowing traders to add layers of confirmation, control trade direction, and manage exits with precision.
Core Strategy Logic
The strategy's entry signals are generated when two primary conditions are met simultaneously:
Momentum Shift (EMA Crossover): It looks for a crossover between a fast EMA (default length 9) and a slow EMA (default length 21).
Buy Signal: The fast EMA crosses above the slow EMA, indicating a potential shift to bullish momentum.
Sell Signal: The fast EMA crosses below the slow EMA, indicating a potential shift to bearish momentum.
Trend/Sentiment Filter (VWAP): The crossover signal is only considered valid if the price is on the "correct" side of the VWAP.
For a Buy Signal: The price must be trading above the VWAP. This confirms that, on average, buyers are in control for the day.
For a Sell Signal: The price must be trading below the VWAP. This confirms that sellers are generally in control.
Confirmation Filters (Optional)
To increase the reliability of the signals and reduce false entries, the strategy includes two optional confirmation filters:
Price Action Filter (Engulfing Candle): If enabled (Use Price Action), the entry signal is only valid if the crossover candle is also an "engulfing" candle.
A Bullish Engulfing candle is a large green candle that completely "engulfs" the body of the previous smaller red candle, signaling strong buying pressure.
A Bearish Engulfing candle is a large red candle that engulfs the previous smaller green candle, signaling strong selling pressure.
Volume Filter (Volume Spike): If enabled (Use Volume Confirmation), the entry signal must be accompanied by a surge in volume. This is confirmed if the volume of the entry candle is greater than its recent moving average (default 20 periods). This ensures the move has strong participation behind it.
Exit Strategy
A position can be closed in one of three ways, creating a comprehensive exit plan:
Stop Loss (SL): A fixed stop loss is set at a level determined by a multiple of the Average True Range (ATR). For example, a 1.5 multiplier places the stop 1.5 times the current ATR value away from the entry price. This makes the stop dynamic, adapting to market volatility.
Take Profit (TP): A fixed take profit is also set using an ATR multiplier. By setting the TP multiplier higher than the SL multiplier (e.g., 2.0 for TP vs. 1.5 for SL), the strategy aims for a positive risk-to-reward ratio on each trade.
Exit on Opposite Signal (Reversal): If enabled, an open position will be closed automatically if a valid entry signal in the opposite direction appears. For example, if you are in a long trade and a valid short signal occurs, the strategy will exit the long position immediately. This feature turns the strategy into more of a reversal system.
Key Features & Customization
Trade Direction Control: You can enable or disable long and short trades independently using the Allow Longs and Allow Shorts toggles. This is useful for trading in harmony with a higher-timeframe trend (e.g., only allowing longs in a bull market).
Visual Plots: The strategy plots the Fast EMA, Slow EMA, and VWAP on the chart for easy visualization of the setup. It also plots up/down arrows to mark where valid buy and sell signals occurred.
Dynamic SL/TP Line Plotting: A standout feature is that the strategy automatically draws the exact Stop Loss and Take Profit price lines on the chart for every active trade. These lines appear when a trade is entered and disappear as soon as it is closed, providing a clear visual of your risk and reward targets.
Alerts: The script includes built-in alertcondition calls. This allows you to create alerts in TradingView that can notify you on your phone or execute trades automatically via a webhook when a long or short signal is generated.

Enhanced Ichimoku Cloud Strategy V1 [Quant Trading]Overview
This strategy combines the powerful Ichimoku Kinko Hyo system with a 171-period Exponential Moving Average (EMA) filter to create a robust trend-following approach. The strategy is designed for traders seeking to capitalize on strong momentum moves while using the Ichimoku cloud structure to identify optimal entry and exit points.
This is a patient, low-frequency trading system that prioritizes quality over quantity. In backtesting on Solana, the strategy achieved impressive results with approximately 3600% profit over just 29 trades, demonstrating its effectiveness at capturing major trend movements rather than attempting to profit from every market fluctuation. The extended parameters and strict entry criteria are specifically optimized for Solana's price action characteristics, making it well-suited for traders who prefer fewer, higher-conviction positions over high-frequency trading approaches.
What Makes This Strategy Original
This implementation enhances the traditional Ichimoku system by:
Custom Ichimoku Parameters: Uses non-standard periods (Conversion: 7, Base: 211, Lagging Span 2: 120, Displacement: 41) optimized for different market conditions
EMA Confirmation Filter: Incorporates a 171-period EMA as an additional trend confirmation layer
State Memory System: Implements a sophisticated memory system to track buy/sell states and prevent false signals
Dual Trade Modes: Offers both traditional Ichimoku signals ("Ichi") and cloud-based signals ("Cloud")
Breakout Confirmation: Requires price to break above the 25-period high for long entries
How It Works
Core Components
Ichimoku Elements:
-Conversion Line (Tenkan-sen): 7-period Donchian midpoint
-Base Line (Kijun-sen): 211-period Donchian midpoint
-Span A (Senkou Span A): Average of Conversion and Base lines, plotted 41 periods ahead
-Span B (Senkou Span B): 120-period Donchian midpoint, plotted 41 periods ahead
-Lagging Span (Chikou Span): Current close plotted 41 periods back
EMA Filter: 171-period EMA acts as a long-term trend filter
Entry Logic (Ichi Mode - Default)
A long position is triggered when ALL conditions are met:
Cloud Bullish: Span A > Span B (41 periods ago)
Breakout Confirmation: Current close > 25-period high
Ichimoku Bullish: Conversion Line > Base Line
Trend Alignment: Current close > 171-period EMA
State Memory: No previous buy signal is still active
Exit Logic
Positions are closed when:
Ichimoku Bearish: Conversion Line < Base Line
Alternative Cloud Mode
When "Cloud" mode is selected, the strategy uses:
Entry: Span A crosses above Span B with additional cloud and EMA confirmations
Exit: Span A crosses below Span B with cloud and EMA confirmations
Default Settings Explained
Strategy Properties
Initial Capital: $1,000 (realistic for average traders)
Position Size: 100% of equity (appropriate for backtesting single-asset strategies)
Commission: 0.1% (realistic for most brokers)
Slippage: 3 ticks (accounts for realistic execution costs)
Date Range: January 1, 2018 to December 31, 2069
Key Parameters
Conversion Periods: 7 (faster than traditional 9, more responsive to price changes)
Base Periods: 211 (much longer than traditional 26, provides stronger trend confirmation)
Lagging Span 2 Periods: 120 (custom period for stronger support/resistance levels)
Displacement: 41 (projects cloud further into future than standard 26)
EMA Period: 171 (long-term trend filter, approximately 8.5 months of daily data)
How to Use This Strategy
Best Market Conditions
Trending Markets: Works best in clearly trending markets where the cloud provides strong directional bias
Medium to Long-term Timeframes: Optimized for daily charts and higher timeframes
Volatile Assets: The breakout confirmation helps filter out weak signals in choppy markets
Risk Management
The strategy uses 100% equity allocation, suitable for backtesting single strategies
Consider reducing position size when implementing with real capital
Monitor the 25-period high breakout requirement as it may delay entries in fast-moving markets
Visual Elements
Green/Red Cloud: Shows bullish/bearish cloud conditions
Yellow Line: Conversion Line (Tenkan-sen)
Blue Line: Base Line (Kijun-sen)
Orange Line: 171-period EMA trend filter
Gray Line: Lagging Span (Chikou Span)
Important Considerations
Limitations
Lagging Nature: Like all Ichimoku strategies, signals may lag significant price moves
Whipsaw Risk: Extended periods of consolidation may generate false signals
Parameter Sensitivity: Custom parameters may not work equally well across all market conditions
Backtesting Notes
Results are based on historical data and past performance does not guarantee future results
The strategy includes realistic slippage and commission costs
Default settings are optimized for backtesting and may need adjustment for live trading
Risk Disclaimer
This strategy is for educational purposes only and should not be considered financial advice. Always conduct your own analysis and risk management before implementing any trading strategy. The unique parameter combinations used may not be suitable for all market conditions or trading styles.
Customization Options
Trade Mode: Switch between "Ichi" and "Cloud" signal generation
Short Trading: Option to enable short positions (disabled by default)
Date Range: Customize backtesting period
All Ichimoku Parameters: Fully customizable for different market conditions
This enhanced Ichimoku implementation provides a structured approach to trend following while maintaining the flexibility to adapt to different trading styles and market conditions.

Bollinger Band Breakout With Volatility StoplossDetailed Explanation of the Bollinger Band Breakout With Volatility Stoploss System
Introduction
The "Bollinger Band Breakout With Volatility Stoploss" system is a trading strategy designed to exploit price volatility in financial markets using the Bollinger Bands indicator, a widely recognized tool developed by John Bollinger. This system adapts the traditional Bollinger Bands framework into a Volatility Breakout strategy, focusing on capturing significant price movements by leveraging customized parameters and precise trading rules. The system operates exclusively on long positions, employs a daily timeframe, and incorporates dynamic risk management techniques to optimize trade outcomes while preserving capital.
System Parameters
The system modifies the standard Bollinger Bands configuration to suit its breakout methodology:
Standard Deviation (SD): Set to 1x, determining the width of the bands relative to the central moving average. This tighter setting enhances sensitivity to price movements, making the system responsive to smaller volatility shifts compared to the conventional 2x SD.
Period: A 30-day (1-month) lookback period is used to calculate the bands, providing a balance between capturing medium-term price trends and avoiding excessive noise from shorter timeframes.
Moving Average Type: The system uses an Exponential Moving Average (EMA) instead of the Simple Moving Average (SMA). The EMA places greater weight on recent price data, making it more responsive to current market conditions and better suited for detecting breakout opportunities in dynamic markets.
Core Concept
The Bollinger Band Breakout system is built on the principle of Volatility Breakout, which seeks to capitalize on significant price movements when the price breaks out of a defined volatility range. The Bollinger Bands, consisting of an EMA as the central line and two bands (Upper and Lower) calculated as the EMA plus or minus 1x SD, define this range. The system operates on a Daily Chart (D) timeframe, making it suitable for traders who prefer analyzing and executing trades based on daily price action. By focusing solely on Long Positions (buying low and selling high), the system avoids short-selling, aligning with strategies that capitalize on upward price momentum.
The core idea is to use the 1x SD multiplier over a 30-day period to establish a dynamic price range that reflects recent market volatility. Breakouts above the Upper Band signal potential buying opportunities, while penetrations below the Lower Band indicate exits, ensuring trades are aligned with significant price movements.
Trading Signals
The system generates clear entry and exit signals based on price interactions with the Bollinger Bands:
Buy Signal: A buy signal is triggered when the closing price of a daily candle exceeds the Upper Bollinger Band (EMA + 1x SD over 30 days). The trade is entered at the opening price of the subsequent candle, ensuring the breakout is confirmed by the close of the prior day. This approach minimizes false signals by waiting for a definitive breach of the volatility threshold.
Sell Signal: A sell signal occurs when the closing price falls below the Lower Bollinger Band (EMA - 1x SD over 30 days). The position is exited at the opening price of the next candle, allowing the trader to lock in profits or limit losses when the price reverses or loses momentum.
Risk Management
Risk management is a cornerstone of the system, ensuring capital preservation and disciplined trade execution:
Initial Stoploss: The stoploss is set at the Lower Bollinger Band of the candle that triggered the buy signal. This level acts as a volatility-based threshold, below which the trade is deemed invalid, prompting an immediate exit to protect capital. Traders have two options for implementing the stoploss:
Pending Stoploss: A predefined stoploss order placed at the Lower Band level.
Conditional Exit: Using the sell signal condition (price closing below the Lower Band) as the exit trigger, effectively aligning the stoploss with the system’s exit rules.
Position Sizing: The system employs Fixed Fractional Position Sizing with a risk per trade capped at 3% of the account balance. The position size is calculated based on the distance between the entry price and the Initial Stoploss, incorporating Volatility Position Sizing. This method adjusts the trade size according to the market’s volatility, ensuring that risk remains consistent across varying market conditions. Two options are available for managing capital:
Gear Up Option: Profits from previous trades are reinvested into the account’s capital, increasing the base for calculating the next position size. This compounding approach can amplify returns but also increases risk exposure.
Fixed Equity Option: Profits from previous trades are withdrawn, and only the remaining capital is used for calculating the next position size. This conservative approach prioritizes capital preservation by not compounding gains.
Trailing Stop: The system uses the Lower Bollinger Band as a dynamic trailing stop, which adjusts with price movements and volatility. This ensures that profits are protected during favorable trends while allowing the trade to remain open as long as the price stays above the Lower Band. The trailing stop aligns with the sell signal condition, maintaining consistency in the system’s exit strategy.
Supporting Indicators
The system incorporates two additional indicators to enhance market analysis and decision-making:
Bollinger Band Width (BBW): BBW measures the distance between the Upper and Lower Bollinger Bands relative to the EMA, serving as a proxy for market volatility.
A high BBW indicates significant price volatility, often associated with strong trends or large price movements, which may confirm the strength of a breakout.
A low BBW suggests low volatility, potentially signaling a period of consolidation or "squeeze" that could precede a breakout. This can help traders anticipate potential trade setups.
The BBW calculation uses the EMA to maintain consistency with the system’s core parameters.
Bollinger Band Ratio (BBR) or %B: BBR measures the price’s position relative to the Bollinger Bands, providing insight into market conditions.
BBR > 1: The price is above the Upper Band, indicating potential overbought conditions or strong upward momentum, which aligns with the system’s buy signal.
BBR < 0: The price is below the Lower Band, suggesting oversold conditions or downward momentum, corresponding to the sell signal or stoploss trigger.
BBR between 0 and 1: The price is within the bands, indicating a neutral state where no immediate action is required.
Like BBW, BBR is calculated using the EMA for consistency.
Backtesting and Implementation
To evaluate the system’s performance, traders can utilize the Backtest Parameter function, which allows for testing the strategy across user-defined time periods. This feature enables traders to assess the system’s effectiveness under various market conditions, optimize parameters, and refine their approach based on historical data.
Conclusion
The Bollinger Band Breakout With Volatility Stoploss system is a robust, volatility-driven trading strategy that combines the predictive power of Bollinger Bands with disciplined risk management. By focusing on long positions, using a 1x SD multiplier, and incorporating EMA-based calculations, the system is designed to capture significant price breakouts while minimizing risk through dynamic stoplosses and volatility-adjusted position sizing. The inclusion of BBW and BBR indicators provides additional context for assessing market conditions, enhancing the trader’s ability to make informed decisions. With its structured approach and backtesting capabilities, this system is well-suited for traders seeking a systematic, data-driven method to trade in volatile markets.

Intraday Trading Hit and Run# Strategy Overview
This is a short-term trading system designed for quick entries/exits (intraday). It uses multiple technical indicators to identify momentum trades in the direction of the trend, with built-in risk management through trailing stops.
# Main Components
1. Trend Filter
Uses two EMAs (10-period "fast" blue line and 100-period "slow" red line)
Only trades when:
Long: Price AND fast EMA are above slow EMA
Short: Price AND fast EMA are below slow EMA
2. Main Signal
////Stochastic Oscillator (14-period):
Buy when %K line crosses above %D line
Sell when %K crosses below %D
////Trend Strength Check
Smoothed ADX indicator (5-period EMA of ADX):
Requires ADX value ≥ 25 to confirm strong trend
3. Confirmation using Volume Filter (Optional)
Checks if current volume is 1.5× greater than 20-period average volume
# Entry Rules
A trade is only taken when:
All 3 indicators agree (EMA trend, Stochastic momentum, ADX strength)
Volume filter is satisfied (if enabled)
# Exit Rules
1. Emergency Exit:
Close long if price drops below fast EMA
Close short if price rises above fast EMA
2. Trailing Stop:
Actively protects profits by moving stop-loss:
Maintains 0.1% distance from highest price (longs) or lowest price (shorts)
# Risk Management
Only use 10% of account per trade
Includes 0.04% commission cost in calculations
All trades monitored with trailing stops
# How It Operates
The strategy looks for strong, high-volume momentum moves in the direction of the established trend (as determined by EMAs). It jumps in quickly ("hit") when conditions align, then protects gains with an automatic trailing stop ("run"). Designed for fast markets where trends develop rapidly.
You can use it on 15m, 1h or 4h

FlexATRFlexATR: A Dynamic Multi-Timeframe Trading Strategy
Overview: FlexATR is a versatile trading strategy that dynamically adapts its key parameters based on the timeframe being used. It combines technical signals from exponential moving averages (EMAs) and the Relative Strength Index (RSI) with volatility-based risk management via the Average True Range (ATR). This approach helps filter out false signals while adjusting to varying market conditions — whether you’re trading on a daily chart, intraday charts (30m, 60m, or 5m), or even on higher timeframes like the 4-hour or weekly charts.
How It Works:
Multi-Timeframe Parameter Adaptation: FlexATR is designed to automatically adjust its indicator settings depending on the timeframe:
Daily and Weekly: On higher timeframes, the strategy uses longer periods for the fast and slow EMAs and standard periods for RSI and ATR to capture more meaningful trend confirmations while minimizing noise.
Intraday (e.g., 30m, 60m, 5m, 4h): The parameters are converted from “days” into the corresponding number of bars. For instance, on a 30-minute chart, a “day” might equal 48 bars. The preset values for a 30-minute chart have been slightly reduced (e.g., a fast EMA is set at 0.35 days instead of 0.4) to improve reactivity while maintaining robust filtering.
Signal Generation:
Entry Signals: The strategy enters long positions when the fast EMA crosses above the slow EMA and the RSI is above 50, and it enters short positions when the fast EMA crosses below the slow EMA with the RSI below 50. This dual confirmation helps ensure that signals are reliable.
Risk Management: The ATR is used to compute dynamic levels for stop loss and profit target:
Stop Loss: For a long position, the stop loss is placed at Price - (ATR × Stop Loss Multiplier). For a short position, it is at Price + (ATR × Stop Loss Multiplier).
Profit Target: The profit target is similarly set using the ATR multiplied by a designated profit multiplier.
Dynamic Trailing Stop: FlexATR further incorporates a dynamic trailing stop (if enabled) that adjusts according to the ATR. This trailing stop follows favorable price movements at a distance defined by a multiplier, locking in gains as the trend develops. The use of a trailing stop helps protect profits without requiring a fixed exit point.
Capital Allocation: Each trade is sized at 10% of the total equity. This percentage-based position sizing allows the strategy to scale with your account size. While the current setup assumes no leverage (a 1:1 exposure), the inherent design of the strategy means you can adjust the leverage externally if desired, with risk metrics scaling accordingly.
Visual Representation: For clarity and accessibility (especially for those with color vision deficiencies), FlexATR employs a color-blind friendly palette (the Okabe-Ito palette):
EMA Fast: Displayed in blue.
EMA Slow: Displayed in orange.
Stop Loss Levels: Rendered in vermilion.
Profit Target Levels: Shown in a distinct azzurro (light blue).
Benefits and Considerations:
Reliability: By requiring both EMA crossovers and an RSI confirmation, FlexATR filters out a significant amount of market noise, which reduces false signals at the expense of some delayed entries.
Adaptability: The automatic conversion of “day-based” parameters into bar counts for intraday charts means the strategy remains consistent across different timeframes.
Risk Management: Using the ATR for both fixed and trailing stops allows the strategy to adapt to changing market volatility, helping to protect your capital.
Flexibility: The strategy’s inputs are customizable via the input panel, allowing traders to fine-tune the parameters for different assets or market conditions.
Conclusion: FlexATR is designed as a balanced, adaptive strategy that emphasizes reliability and robust risk management across a variety of timeframes. While it may sometimes enter trades slightly later due to its filtering mechanism, its focus on confirming trends helps reduce the likelihood of false signals. This makes it particularly attractive for traders who prioritize a disciplined, multi-timeframe approach to capturing market trends.
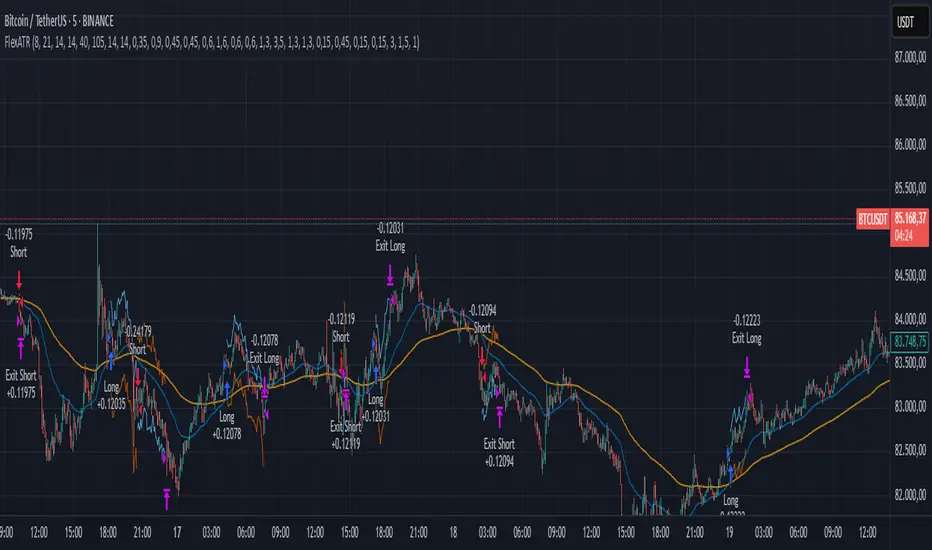
IronBot v4IronBot v4 – Trading Strategy Overview
1. Quick Context
IronBot v4 is a trading strategy designed for users who want a simple yet effective approach to reading the markets. It uses a combination of Fibonacci retracement levels, custom logic triggers, and innovative modules (EMA validation, Iron Impulse Shield and Iron Auto Volume Detector) to identify potential entry and exit points, strengthening the strategy’s detection of sudden market volatility or shifts in trading volume.
2. Theoretical Details
Fibonacci Analysis
The script identifies recent market highs and lows, then calculates key Fibonacci levels (high- and low-based). These levels can help confirm potential reversals or trends.
EMA Option
When enabled, the exponential moving average (EMA) offers additional validation for trade entries. If the current price remains above a certain EMA threshold, long positions may be favored; conversely, if it stays below the EMA, short positions may be initiated.
IIS (Iron Impulse Shield)
IIS helps to filter out risky trades by measuring recent price shocks or surges. If an extreme movement is detected, the strategy may temporarily disable longs or shorts to avoid false signals.
IAVD (Iron Auto Volume Detector)
This functionality automatically detects the average market volume over a defined period (regardless of the market, since it relies on real data). When entering a position, it ensures that overall volume is high enough to confirm a genuinely active, robust market. By providing an additional filter, it can strengthen the decision-making process whenever the market’s participation level is in question.
Panel
IronBot v4 displays a real-time backtest panel that summarizes the selected configuration (including the current pair, analysis window, enabled filters), as well as showing net profit, applicable exchange fees, country taxes, and the final net balance. This gives traders an immediate overview of strategy performance and risk metrics.
What Pinescript Adds Visually
The script plots:
Fibonacci levels (highlighting potential reversal zones)
Trend lines indicating bullish (green) or bearish (red) lean
Optional EMA line
Optional Fibonacci forecast lines for anticipating future moves
Automatic labeling of entry, take-profit, and stop-loss levels, indicating the profit percentage of each trade.
3. Explanation of Inputs
The strategy exposes multiple inputs that can be toggled or configured by the user:
Analysis Window : Dictates how many bars to consider for high/low calculations and the fib retracement thresholds.
TRADES
Display TP/SL: For displaying Take profits and Stop loss.
Display Forecast: When enabled, this feature calculates and projects possible future Fibonacci retracements using historical data, helping traders anticipate potential upcoming trade setups.
Leverage: Only used for the Panel and not for trades. Lets you amplify your position size; higher leverage increases potential gains but also heightens risk. TradingView strategy is using properties for doing this.
Exchange Maker Fees & Exchange Taker Fees: Only used for the Panel and not for trades. Define the percentage cost applied by your exchange for maker and taker trades, respectively. These fees are accounted for in final profit calculations of the Panel.
Country Tax: Only used for the Panel and not for trades. Specifies a tax percentage to be deducted from net profits.
STOP LOSS and TAKE PROFITS
Stop-Loss & Take-Profit Parameters: Controls the percentage distances at which the strategy will exit positions. Additionally, you can configure up to four distinct take-profit levels (TP1 through TP4). Each level should be higher target than the previous one, and you can assign a specific percentage of the total position to close at each TP, ensuring the sum equals 100%. A break-even feature is also available when multiple TPs are used.
EMA
EMA (Exponential Moving Average) Option: When enabled, the strategy opens long trades only if the current price is above the specified EMA length, and opens short trades only if it is below that threshold.
PANELS
Show Panel: For displaying the backtest integrated panel.
IRON IMPULSE SHIELD (IIS)
IIS (Iron Impulse Shield) Option: When enabled, IIS continuously monitors recent price volatility depending on the analysis window set. If the market experiences an extreme surge or drop beyond a specified threshold, IIS temporarily blocks new long or short positions.
IRON AUTO VOLUME DETECTOR (IAVD)
IAVD (Iron Auto Volume Detector) Option: When enabled, it continuously measures the average market volume over a special period, irrespective of the specific trading pair. This ensures that IronBot v4 focuses on markets with robust participation, reducing the likelihood of entering trades during low-liquidity conditions.
By changing these values, IronBot v4 reacts differently to market structure and risk management requirements. Stop-loss and take-profit levels will adjust accordingly, while advanced filters (like EMA or IIS) influence when trades can open.
4. TradingView Strategy Properties
IronBot v4 uses the built-in TradingView “strategy” functionality. In particular:
Order Placement: The code calls strategy.entry() and strategy.close() for direct orders, ensuring signals are sent immediately (no limit orders are used). This helps connect with exchange signal bots for automated execution.
Initial Capital: The code uses initial capital defined in properties for calculating Net balance in the integrated panel.
On bar close: This strategy fill orders on bar close.
Pyramiding: This strategy can take only 1 successive trade in the same direction
Be careful to configure your leverage input depending on your strategy properties.
5. Visualization
5. Purpose & Disclaimer
This script is for educational purposes only and does not constitute financial advice. Past performance does not guarantee future results. Always confirm your own risk tolerance and consult a financial professional before placing live trades. Trading leveraged products can involve substantial risk of loss.

Trend-based Price Action StrategyThis is a strategy script that combines trend-based price action analysis with the Relative Strength Index (RSI) and Exponential Moving Averages (EMA) as trend filters. Here's a summary of the key components and logic:
Price Action Candlestick Patterns:
Bullish patterns: Engulfing candle and Morning Star.
Bearish patterns: Engulfing candle and Evening Star.
RSI Integration:
RSI is used to identify overbought and oversold conditions.
EMA Trend Filter:
Three EMAs with different periods: Fast , Medium and Slow.
Long trend condition occur when the fast EMA is above the medium and the medium is above the slow EMA.
Short trend condition occur when the slow EMA is above the medium and the medium is above the fast EMA.
Long entry conditions: RSI is oversold, RSI is decreasing, bullish candlestick pattern, and EMA trend filter conditions are met.
Short entry conditions: RSI is overbought, RSI is decreasing, bearish candlestick pattern, and EMA trend filter conditions are met.
Exit conditions:
Take profit or stop loss is reached.
Plotting:
Signals are plotted on the chart when entry conditions are met.
EMAs are plotted when the EMA trend filter is enabled.
This script aims to capture potential trend reversal points based on a combination of candlestick patterns, RSI, and EMA trend analysis.
Traders can use this script as a starting point for further customization or as a reference for developing their own trading strategies. It's important to note that past performance is not indicative of future results, and thorough testing and validation are recommended before deploying any trading strategy.

Macketings 1min ScalpingThis is a hyper-reactive scalping strategy designed for the 1-minute chart. It utilizes a strict four-EMA hierarchy (80/90/340/500) to ensure trades are only taken in the strongest aligned market trend. The strategy is built to be extremely tight on risk and focuses on capturing the immediate, high-momentum swing that follows a confirmed EMA retest or breakout.
Key Mechanics (How it Works):
Strict Trend Alignment: Entry is only permitted when the faster EMA band (80/90) and the price action are correctly aligned with the slow trend (340/500).
Long: EMA 80/90 must be above EMA 340/500, AND EMA 340 must be above EMA 500. (And vice-versa for Short.)
Expanded Retest Entry: The strategy waits for the price to retest or briefly enter the 80/90 band, then immediately enters upon the confirmed momentum breakout from that band.
Dynamic Risk Management (Tight Ride): The strategy is engineered to ride the wave aggressively while protecting capital immediately:
Extremely Tight Initial Stop Loss (0.2% default): Limits initial risk instantly.
Break-Even Security: Once profit hits 0.3%, the Stop Loss is automatically trailed to secure 0.2% profit (a risk-free trade).
Aggressive Exit Logic: Positions are closed not only upon hitting the Take Profit target (2.5%) but also immediately if the 80/90 EMA band crosses the 340 EMA, signaling a critical loss of momentum.
Disclaimer:
This strategy requires high-liquidity instruments and is best used on low timeframes (1-minute) due to its dependency on fast momentum shifts and tight stops. Backtesting and forward testing are crucial before deployment.

BB SPY Mean Reversion Investment StrategySummary
Mean reversion first, continuation second. This strategy targets equities and ETFs on daily timeframes. It waits for price to revert from a Bollinger location with candle and EMA agreement, then manages risk with ATR based exits. Uniqueness comes from two elements working together. One, an adaptive band multiplier driven by volatility of volatility that expands or contracts the envelope as conditions change. Two, a bias memory that re arms the same direction after any stop, target, or time exit until a true opposite signal appears. Add it to a clean chart, use the markers and levels, and select on bar close for conservative alerts. Shapes can move while the bar is open and settle on close.
Scope and intent
• Markets. Currently adapted for SPY, needs to be optimized for other assets
• Timeframes. Daily primary. Other frames are possible but not the default
• Default demo. SPY on daily
• Purpose. Trade mean reversion entries that can chain into a longer swing by splitting holds into ATR or time segments
Originality and usefulness
• Novelty. Adaptive band width from volatility of volatility plus a persistent bias array that keeps the original direction alive across sequential entries until an opposite setup is confirmed
• Failure modes mitigated. False starts in chop are reduced by candle color and EMA location. Missed continuation after a take profit or stop is addressed by the re arm engine. Oversized envelopes during quiet regimes are avoided by the adaptive multiplier
• Testability. Every module has Inputs and visible levels so users can see why a suggestion appears
• Portable yardstick. All risk and targets are expressed in ATR units
Method overview in plain language
The engine measures where price sits relative to Bollinger bands, confirms with candle color and EMA location, requires ADX for shorts(in our case long close since we use it currently as long only), and optionally requires a trend or mean reversion regime using band width percent rank and basis slope. Risk uses ATR for stop, target, and optional breakeven. A small array stores the last confirmed direction. While flat, the engine keeps a pending order in that direction. The array flips only when a true opposite setup appears.
Base measures
• Range basis. True Range smoothed over a user defined ATR Length
• Return basis. Not required
Components
• Bollinger envelope. SMA length and standard deviation multiplier. Entry is based on cross of close through the band with location bias
• Candle and EMA filter. Close relative to open and close relative to EMA align direction
• ADX gate for shorts. Requires minimum trend strength for short trades
• Adaptive multiplier. Band width scales using volatility of volatility so envelopes breathe with conditions
• Regime gate optional. Band width percent rank and basis slope identify trend or mean reversion regimes
• Risk manager. ATR stop, ATR target, optional breakeven, optional time exit
• Bias memory. Array stores last confirmed direction and re arms entries while flat
Fusion rule
Minimum satisfied gates count style. All required gates must be true. Optional gates are controlled in Inputs. Bias memory never overrides an opposite confirmed setup.
Signal rule
• Long setup when close crosses up through the lower band, the bar closes green, and close is above the long EMA
• Short setup when close crosses down through the upper band, the bar closes red, close is below the short EMA, and ADX is above the minimum
• While flat the model keeps a pending order in the stored direction until a true opposite setup appears
• IN LONG or IN SHORT describes states between entry and exit
What you will see on the chart
• Markers for Long and Short setups
• Exit markers from ATR or time rules
• Reference levels for entry, stop, and target
• Bollinger bands and optional adaptive bands
Inputs with guidance
Setup
• Signal timeframe. Uses the chart timeframe
• Invert direction optional. Flips long and short
Logic
• BB Length. Typical 10 to 50. Higher smooths more
• BB Mult. Typical 1.0 to 2.5. Higher widens entries
• EMA Length long. Typical 10 to 50
• EMA Length short. Typical 5 to 30
• ADX Minimum for short. Typical 15 to 35
Filters
• Regime Type. none or trend or mean reversion
• Rank Lookback. Typical 100 to 300
• Basis Slope Length and Threshold. Larger values reduce false trends
Risk
• ATR Length. Typical 10 to 21
• ATR Stop Mult. Typical 1.0 to 3.0
• ATR Take Profit Mult. Typical 2.0 to 5.0
• Breakeven Trigger R. Move stop to entry after the chosen multiple
• Time Exit. Minimum bars and extension when profit exceeds a fraction of ATR
Bias and rearm
• Bias flips kept. Array depth
• Keep rearm when flat. Maintain a pending order while flat
UI
• Show markers and levels. Clean defaults
Usage recipes
Alerts update in real time and can change while the bar forms. Select on bar close for conservative workflows.
Properties visible in this publication
• Initial capital 25000
• Base currency USD
• If any higher timeframe calls are enabled, request.security uses lookahead off
• Commission 0.03 percent
• Slippage 3 ticks
• Default order size method Percent of equity with value 5
• Pyramiding 0
• Process orders on close On
• Bar magnifier Off
• Recalculate after order is filled Off
• Calc on every tick Off
Realism and responsible publication
No performance claims. Costs and fills vary by venue. Shapes can move intrabar and settle on close. Strategies use standard candles only.
Honest limitations and failure modes
High impact releases and thin liquidity can break assumptions. Gap heavy symbols may require larger ATR. Very quiet regimes can reduce contrast in the mean reversion signal. If stop and target can both be touched inside one bar, outcome follows the TradingView order model for that bar path.
Regimes with extreme one sided trend and very low volatility can reduce mean reversion edges. Results vary by symbol and venue. Past results never guarantee future outcomes.
Open source reuse and credits
None.
Backtest realism
Costs are realistic for liquid equities. Sizing does not exceed five percent per trade by default. Any departure should be justified by the user.
If you got any questions please le me know

MoneyPlant-Auto Support Resistance V2.0
🧭 Overview
MoneyPlant – Auto Support Resistance is a professional-grade indicator designed to automatically detect dynamic Support and Resistance levels using real-time market structure.
It combines trend confirmation, structure analysis, and momentum logic to identify high-probability trading zones in all market conditions.
⚙️ Core Concept
This indicator uses a unique combination of classic and proprietary logic to filter only the most relevant S/R levels:
• Dynamic Support/Resistance Mapping: Detects strong reaction levels based on price structure, candle rejection points, and breakout validation.
• EMA & WMA Trend Filter: Uses a triple-moving-average model (default EMA 18, EMA 25, and WMA 7) to confirm current market bias.
• MACD Momentum Filter: Confirms trend strength and helps avoid false breakouts.
• Smart Alignment Logic: Generates signals only when structure, trend, and momentum all align in the same direction.
🧠 How It Works
1. Buy Setup:
When price breaks above a resistance level with bullish EMA/WMA alignment and positive MACD momentum → Buy Signal triggers.
2. Sell Setup:
When price breaks below a support level with bearish EMA/WMA alignment and negative MACD momentum → Sell Signal triggers.
3. Auto-Refreshing Zones:
Support and Resistance zones update dynamically as market structure evolves.
🎯 Best Use Cases
• Works effectively on Stocks, Indices, Forex, and Commodities (e.g., XAUUSD, NIFTY, BANKNIFTY ).
• Ideal for Intraday & Swing Trading (15 min – 1 hour timeframes).
• Fully compatible with TradingView alerts and automation tools.
💡 Key Features
✅ Automatic Support/Resistance detection
✅ Adaptive EMA + WMA + MACD trend logic
✅ Real-time Buy/Sell alerts
✅ Multi-timeframe compatibility
✅ Optimized for clean chart visuals
⚖️ Recommended Settings
• EMA Fast: 18
• EMA Slow: 25
• WMA Filter: 7
• MACD: Default parameters
(Users may adjust EMA/WMA settings according to their own trading style.)
🔒 How to Get Access
To get access to this invite-only script, please send me a private message on TradingView or use the link in my profile.
Once your username is added via Manage Access, you’ll be able to use the indicator.
🧾 Notes for Traders
This tool does not repaint, and it’s meant for educational and analytical purposes only.
Each license is valid for one TradingView username — no resale or redistribution is permitted.
Developed by MoneyPlant
Smart Automation for Professional Traders

ProbRSI Adaptive SPY and QQQ Swing One Hour Strategy Summary in one paragraph
A probabilistic RSI engine for large cap ETFs and index names on intraday and swing timeframes. It converts ATR scaled returns into a 0 to 100 probability line, adapts its smoothing from path efficiency, and gates flips with simple percent levels. It is original because it fuses three pieces that traders rarely combine in one signal line: ATR normalized return probability, curvature compression, and per bar adaptive EMA. Add it to a clean chart, keep the default one hour signal on QQQ, and read the entry and exit markers generated by the strategy. For conservative alerts select on bar close.
Scope and intent
• Markets. Major ETFs and large cap equities. Index futures. Liquid crypto. Major FX pairs
• Timeframes. One minute to daily. Defaults to one hour for swing pace
• Default demo used in this publication. SPY/QQQ on one hour
• Purpose. Reduce false flips by adapting to path efficiency and by gating long and short separately
• Limits. This is a strategy. Orders are simulated on standard candles only
Originality and usefulness
• Unique fusion. Logistic probability of ATR scaled returns with arcsine pre transform, optional curvature compression, and per bar adaptive EMA steered by an efficiency ratio
• Failure mode addressed. Fast whips in congestion and late entries after spikes
• Testability. Each component has a named input and can be tuned directly. Entry names Long and Short are visible in the list of trades
• Portable yardstick. ATR scaled return is a common unit across symbols and venues
• Protected rationale. The code stays protected to preserve implementation details of the adaptive engine and curvature assist while the method and usage are fully explained here for community review
Method overview in plain language
You convert raw returns into a probability scale, adapt the smoothing to the straightness of the path, and only allow flips when a simple gate is satisfied. The probability line crosses its own EMA to generate signals. When the cross happens below a short gate or above a long gate, the flip is allowed. Otherwise it is ignored.
Base measures
• Return basis. Close minus prior close normalized by ATR, then arcsine to damp large steps. ATR window is set by ATR length. Sensitivity is adjusted by an ATR scale input
• Probability map. A logistic function maps the normalized return to 0 to 1 which becomes 0 to 100 after scaling
Components
• Probability core. Logistic probability of ATR scaled returns. Higher values imply upside pressure. Smoothed by an adaptive EMA
• Curvature assist optional. A curvature proxy compresses extreme spikes toward neutral. Useful after news bars. Weight controls strength
• Efficiency ratio. A path efficiency score from 0 to 1 extends the smoothing length during noisy paths and shortens it during directional paths
• Signal line. An EMA of the probability line creates the reference for cross up and cross down
• Gates. Two simple percent levels define when long and short flips are allowed
Fusion rule
• The adaptive EMA length is computed as a linear map between a minimum and a maximum bound based on one minus efficiency
• If curvature assist is enabled the probability is adjusted by a small counter spike term
• Final probability is compared to its EMA
Signal rule
• Long. A long entry is suggested when probability crosses above the signal line and the current probability is above the Long gate level
• Short. A short entry is suggested when probability crosses below the signal line and the current probability is below the Short gate level
• Exit and flip. When an opposite entry condition appears the current position is closed and a new position opens in the opposite direction
What you will see on the chart
• Strategy markers on suggestion bars. Orders named Long and Short
• Exit marker when the opposite signal closes the open side
• No table by design. All tuning lives in Inputs for a clean chart
Inputs with guidance
Market TF
• Symbol. Series used for oscillator computation. Use the instrument you trade or a close proxy
• Signal timeframe. Timeframe where the oscillator is evaluated. Leave blank to follow the chart
Core
• Price source. Series used for returns. Typical choice close
• Base length. Fallback EMA length used when adaptation is off. Typical range 20 to 200. Larger smooths more
• ATR length. Window for ATR that scales returns. Typical range 10 to 30. Larger normalizes more and lowers sensitivity
• Logit sharpness. Steepness of the logistic link. Typical range 1 to 8. Raising it reacts more to the same input
• ATR scale. Extra divisor on ATR. Typical range 0.5 to 2. Smaller is more sensitive
• Signal length. EMA of the probability line. Typical range 5 to 20. Larger gives fewer flips
• Long gate. Allow long flips only above this level. Typical range 20 to 40
• Short gate. Allow short flips only below this level. Typical range 20 to 40
Adaptive
• Adaptive smoothing. If on, the efficiency ratio controls the per bar EMA length
• Min effective length. Lower bound of adaptive EMA. Typical range 5 to 50
• Max effective length. Upper bound of adaptive EMA. Typical range 50 to 300
• Efficiency window. Window for efficiency ratio. Typical range 30 to 100
Shape Assist
• Curvature influence. If on, extreme spikes are nudged toward neutral
• Curvature weight. Strength of compression. Typical range 0.1 to 0.3
Properties visible in this publication
• Initial capital. 25000
• Base currency. USD
• request.security lookahead off everywhere
• Commission. 0.03 percent
• Slippage. 5 ticks
• Default order size method percent of equity with value 3 for realistic testing
• Pyramiding 0
• Process orders on close ON
• Bar magnifier OFF
• Recalculate after order is filled OFF
• Calc on every tick OFF
Realism and responsible publication
• No performance claims. Past results never guarantee future outcomes
• Shapes can move while a bar forms and settle on close
• Strategies use standard candles for signals and orders only
Honest limitations and failure modes
• Economic releases and thin liquidity can break assumptions behind the curvature assist
• Gap heavy symbols may prefer a longer ATR window
• Very quiet regimes can reduce signal contrast. Consider higher gates or longer signal length
• Session time follows the exchange of the chart and can change symbol to symbol
• Symbol sensitivity is expected. Use the gates and length inputs to find stable settings
• Past results never guarantee future outcomes
Open source reuse and credits
• None
Mode
Public protected. Source is hidden while access is free. Implementation detail remains private. Method and use are fully disclosed here
Legal
Education and research only. Not investment advice. You are responsible for your decisions. Test on historical data and in simulation before any live use. Use realistic costs.
