GM 2 EMA Cross + BBScript for seeing the below EMAs 3 5 13 50 100 This also plots a red cross when -ve crossover of 3 by 5 EMA & green cross when +ve crossover of 3 by 5 EMA Bollinger Bands 2 3Pine Script® Indikatorvon farokh_dubashAktualisiert 42
Trend Follow with 8/34 EMA and Stoch RSI for 1 Hour SPX The script determines and plots entry points for 1 hour S&P index using 8/34 emas and stochastic RSI. When 8 ema above/below 34 ema up/down crosses of stochastic RSI are considered as long/short entries. Entry prices should be above/below high/low of the signal bars accordingly. Ichimoku cloud can be used as extra filtering.Pine Script® Indikatorvon GurselKona66305
EMAs CloudEmas clouds is based on exponential moving averages 25 , 50, 100, 200 Ema 25/50 when crossed give you entry to the trend based on dipacmend forward ema 25/50 for 25 candles and ema 100/200 I add it also momentum based on close of the price moved back 25 candles. Pine Script® Indikatorvon pawtar_Aktualisiert 2248
DW-RSI EMA with EMA of RSIThis is an RSI Oscillator with an EMA of the RSI for a signal line. The RSI line is Green when above the signal line and Red when below the signal line. This does not use the traditional 30% / 70% over sold / over bought analysis. Therefore the levels are not shown. The analysis is this: When the RSI is above the signal line then price has a bullish bias. When the RSI is below the signal line then price has a bearish bias. I wrote use this for Forex Spot Currencies where I feel overbought and oversold may be less valid than it may be in other markets such as stocks. As with all indicators, do not use as your sole reason to enter the market, but use with other indicators or price action signals to get a confluence of signals to confirm your entry. I use it with an 8, 21 and 50 EMA to confirm entry and exit. I give it more weight for exits than I do for entries.Pine Script® Indikatorvon MrPresident33230
Multiple lines EMA/SMA [AKUBI] Ver.2 - 5本の指数平滑・移動平均線単純移動平均線と指数平滑移動平均線(SMA/EMA)を最大5本引けるインジケーターです。 これまでのものとの違いは ・線の太さ ・名前の変更←これ重要 です。いままでのものをそのまま使用いただいても、問題はありません。 通常、トレーディングビューでは、 移動平均線を5本同時に表示させるには「5つのインジケーターを必要とします」。 しかし、 このインジケーターは1つ使えば最大5本まで同時に表示させることができます 。 また、余計なオプションは一切ありませんので、 どなたにでも、すぐにご使用いただけます 。 1)まず、この画面の右下にある「お気に入りに追加」をクリックしてください。 そうすると、インジケーターの「お気に入り」からいつでも呼び出せます。 もしくはインジケーターの検索欄から「AKUBI」と検索しても見つけられます。 使い方は簡単。 2)EMA(指数平滑移動平均線)か SMA(単純移動平均線)のいずれかを選択。 3)その後、お好きな期間を入力してください。 単純移動平均線(SMA)というのは、「5」と入力すれば、5本分のローソク足の終値の平均が表示され、それを結んだ線です。 指数平滑移動平均線(EMA)というのは、少し計算を複雑にして、より素早い動作を実現したものです。 デフォルトでは期間として(7,28,84,100,500)の5種類があらかじめ入力されています。 このまま使っても問題ありませんが、ネットで「移動平均線 設定」と検索すれば、いろいろな設定が紹介されていますので、参考にしてみてください。 不要な線があれば、チェックを外すだけです。 とっても簡単、便利です。 It is all in one. You can use 5 moving average lines with this one indicator only. It is so easy. Just add this indicator. Next step, please add your favorite periods. If you think this is an unnecessary line, you just remove in the check box. Thank you!Pine Script® Indikatorvon UnknownUnicorn2602426319
Fibonacci Moving Average (EMA/SMA) Bundle //@v1.2 Fibonacci Moving Average (EMA/SMA) Bundle //By Tantamount //Save your TV indicator use counts by using the Fibonacci SMA/EMA all in one indicator! Toggle between Exponetial or Simple moving averages functionality, using Fibonacci the sequence. //Fib moving averages are very good at locating support and resistance zones on multiple time frames. //Customize and or input your very own moving average nomenclature by simply changing the input options from default: SMA (21, 55, 89, 144, 233) or EMA (21, 55, 89, 144, 233) Example: (8,13,21,55,89) Support and Resistance Lines Pine Script® Indikatorvon tantamountAktualisiert 11138
The Three EMA'sThe script is three EMA's that are fit into one indicator. Can be well used in EMA trading system for short and long term. Pine Script® Indikatorvon mockingbird1220
Moving Average Shaded Fill Area Crossover EMA Color - EditableMoving Average Shaded Fill Area Crossover EMA Color with option to change EMA valuePine Script® Indikatorvon aballard111111 4.8 K
Multi SMA EMA WMA HMA BB (5+5 MAs + Bollinger Bands) by RRB Multi SMA EMA WMA HMA BB (5+5 Moving Averages of Any Type with Bollinger Bands) by RagingRocketBull 2018 Version 1.0 This indicator shows multiple MAs of any type (SMA EMA WMA HMA etc) with BB on a chart at the same time with/without MTF support depending on the version. There are several versions (published later): Simple, MTF, Pro MTF and Ultimate MTF. This is the Simple version. The Differences are listed below. All versions have BB - Simple: you have 2 groups of MAs that can be assigned any type (5+5) - MTF: +assign 1 custom Timeframe to any group combo (5+5 Custom TF) - Pro MTF: +multiple Timeframes for multiple MA groups (4*3 MTF), horizontal levels and show max bars back options - Ultimate MTF: +individual settings for each MA, multiple Timeframes You can use different types of MAs as dynamic S/R levels to trade of off and MA crosses as signals for possible trend change (golden/death bull/bear crosses). Most common MA types are: SMA, EMA, WMA, HMA. Most common MA lengths are: 12, 20, 26, 30, 50, 100, 200, 400 etc. Features: - 2 groups of custom 5+5 MAs of any type including Hull Moving Average (HMA) - BB 1. based on 3EmaBB, uses plot, fill, stdev and custom hma functions 2. swma has a fixed length = 4, alma and linreg have additional offset and smoothing params Feel free to use. Good Luck!Pine Script® Indikatorvon RagingRocketBullAktualisiert 1212 1.4 K
Moe's Multi EMA'sOriginal Code By Ahoudori Values by Moe. Yet another Multi EMA indicator. I edited Ahoudori's Multi EMA indicator to this one so I could toggle between these values, and other values in another Multi EMA indicator without having to re-enter the values into a single indicator each time. The default values are 14, 21, 55, and 100. These are based on the Fibonacci sequence. 14 is chosen over 13 as it provides less "noise".Pine Script® Indikatorvon cptcoolAktualisiert 32
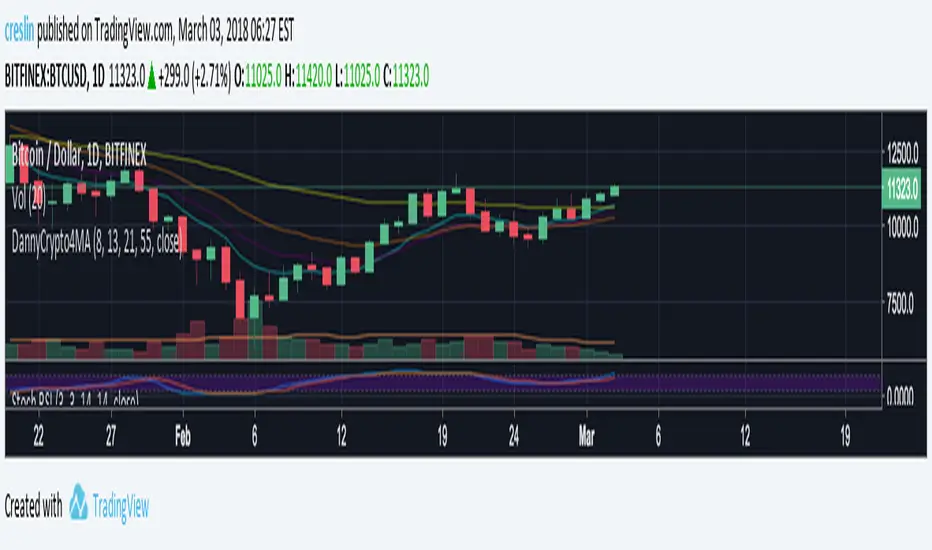
Crypto Quad EMA 8,13,21,55Displays 8,13,21,55 EMAs on a single indicator. Useful for Crypto trading and reduced the number of indicators needed to view multiple EMAs When shorter EMAs cross over the longer its a good sign of Bullish/Bearish reversal. This sentiment is more true at longer timeframes, such as daily candles, as the trend has more momentum. Pine Script® Indikatorvon creslin11271
Heiken Ashi zero lag EMA v1.1 by JustUncleLI originally wrote this script earlier this year for my own use. This released version is an updated version of my original idea based on more recent script ideas. As always with my Alert scripts please do not trade the CALL/PUT indicators blindly, always analyse each position carefully. Always test indicator in DEMO mode first to see if it profitable for your trading style. DESCRIPTION: This Alert indicator utilizes the Heiken Ashi with non lag EMA was a scalping and intraday trading system that has been adapted also for trading with binary options high/low. There is also included filtering on MACD direction and trend direction as indicated by two MA: smoothed MA(11) and EMA(89). The the Heiken Ashi candles are great as price action trending indicator, they shows smooth strong and clear price fluctuations. Financial Markets: any. Optimsed settings for 1 min, 5 min and 15 min Time Frame; Expiry time for Binary options High/Low 3-6 candles. Indicators used in calculations: - Exponential moving average, period 89 - Smoothed moving average, period 11 - Non lag EMA, period 20 - MACD 2 colour (13,26,9) Generate Alerts use the following Trading Rules Heiken Ashi with non lag dot Trade only in direction of the trend. UP trend moving average 11 period is above Exponential moving average 89 period, Doun trend moving average 11 period is below Exponential moving average 89 period, CALL Arrow appears when: Trend UP SMA11>EMA89 (optionally disabled), Non lag MA blue dot and blue background. Heike ashi green color. MACD 2 Colour histogram green bars (optional disabled). PUT Arrow appears when: Trend UP SMA11Pine Script® Indikatorvon JustUncleLAktualisiert 3232 4.6 K
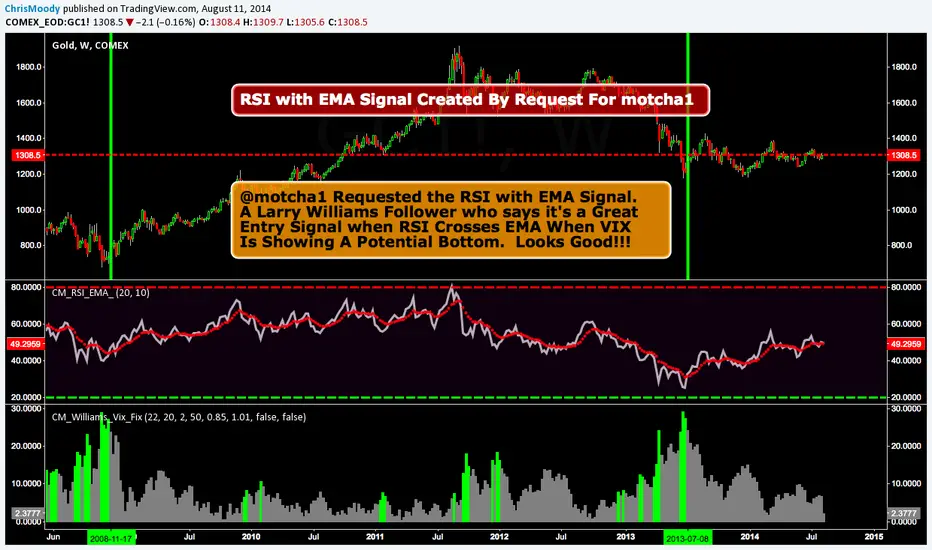
CM_RSI Plus EMARSI with EMA Signal Created By Request For @motcha1 @motcha1 Requested the RSI with EMA Signal. A Larry Williams Follower who says it's a Great Entry Signal when RSI Crosses EMA When VIX Is Showing A Potential Bottom. Looks Good!!! Link to Lower Indicator CM_Williams_Vix_Fix Pine Script® Indikatorvon ChrisMoody1515 15.5 K
EMA Envelope and deviationEMA Envelope with Deviation is a trend-following indicator that plots an Exponential Moving Average (EMA) with dynamic upper and lower bands based on a user-defined deviation. The bands can be calculated either as a fixed percentage distance from the EMA or using statistical standard deviation, allowing traders to visualize volatility and potential overbought or oversold zones. It is commonly used to identify breakout strength, pullback entries, and mean-reversion opportunities. The indicator is fully customizable, supports different price sources, and can optionally display crossover signals when price interacts with the envelope boundaries.Pine Script® Indikatorvon danavillanueva3
EMA BBEMA BB – Putting Them Together Usually, instead of using SMA as the middle band for Bollinger Bands, some traders use EMA. So EMA BB = Bollinger Bands with EMA as the middle line. This makes the bands more responsive to recent price changes compared to SMA Bollinger Bands.Pine Script® Indikatorvon DavidNguyen39645
EMA BBEMA BB is a chart overlay indicator that combines EMA 9, EMA 20, SMA 50, SMA 200, and VWAP with Bollinger Bands to visualize trend direction and volatility. It highlights volatility squeeze zones by comparing Bollinger Bands with ATR, helping traders spot consolidation phases that often precede strong price moves. Designed for quick trend confirmation, support/resistance awareness, and breakout setups.Pine Script® Indikatorvon ricktn1
Extreme Reversion Flag - EMA Spread + ATR Threshold (15s)Short Description Visual indicator that flags extreme EMA divergence on the 15s chart. It plots the EMA20 − EMA4 spread, overlays a multiplied ATR threshold, and highlights bars where 20 > 9 > 4 (bear extreme) or 4 > 9 > 20 (bull extreme) and the spread ≥ mult × ATR. Features - Pane plot of the EMA20−EMA4 spread and the ATR‑based threshold. - Histogram showing spread/ATR ratio for numeric tuning. - Visual fill between spread and threshold when the extreme condition is met. - Top/bottom markers for exact bars that meet the rule. - Alert conditions for bull and bear extremes. - User inputs for EMA lengths, ATR length, and multiplier for sensitivity. Pine Script® Indikatorvon ChannelFisher23
Tabla de EMA's y TimeframesGraphic and permanent representation of the trend of an action/CFD/stock/crypto, directly related to the technical analysis of its EMA's.Pine Script® Indikatorvon masug4Aktualisiert 19
EMA & Stochastic SignalsEma 200 and ema 500 + stochastic crossover. Buys when price is above emas and sells when price is below emas.Pine Script® Indikatorvon pfeidemineAktualisiert 3
Price Action - EMA ClusterAligned with Al Brooks' multi-timeframe analysis in his series, this plots three EMA20 lines on 5m charts: current (line), 15m (stepline), and 60m (stepline). Visible only on 5m timeframe for clarity. EMAs act as dynamic trend channels—price above signals bull bias, below bear. Test extremes: Pullbacks to EMA often offer second-leg entries in trends. Customize colors for better visualization of always-in direction.Pine Script® Indikatorvon Syck06
300/200 EMA Spread HeatmapHighlights the difference between 300 and 200 EMA to indicated potential over extensions in breakout structures. Pine Script® Indikatorvon josephgregory8976Aktualisiert 2216
EMA 50/100/200 Trend BandsEMA Trend Bands is a clean and powerful trend-structure tool built around the classic 50/100/200 EMA stack. It provides an intuitive, color-coded view of market conditions by identifying when the trend is bullish, bearish, or neutral based on EMA alignment. This indicator is designed for traders who want a simple, objective trend filter without the clutter of extra signals or repainting logic.Pine Script® Indikatorvon crypto_zil29
SA_EMA Combo + UT BotEMA Combo + UT Bot is an indicator designed to make it easier to track trend direction and momentum reversals on the same chart. The indicator combines multiple EMA lines (50/100/150/200) with a short- and medium-term EMA cloud. This cloud visually shows whether the market is in a bullish or bearish trend through color changes. In addition, it uses the UT Bot algorithm to generate buy and sell signals adapted to market volatility. These signals are triggered when the price crosses the ATR-based trailing stop level. Users can choose to use Heikin Ashi candles and adjust signal sensitivity via the Key Value parameter. This allows traders to follow overall trends and potential reversal zones using a single tool. Disclaimer: This indicator is for technical analysis purposes only and should not be considered financial advice. Developed for Future Alpha Club.Pine Script® Indikatorvon Selcukaktas0622710