[naoligo] Pivot Points (Daily)Suporte/Resistência do Pivot diário para gráficos intraday
Marcação do S/R tradicional e S/R Fibonacci
Daily Pivot Point Support/Resistances on intraday charts
Both Traditional and Fibonacci methods plotted
In den Scripts nach "daily" suchen


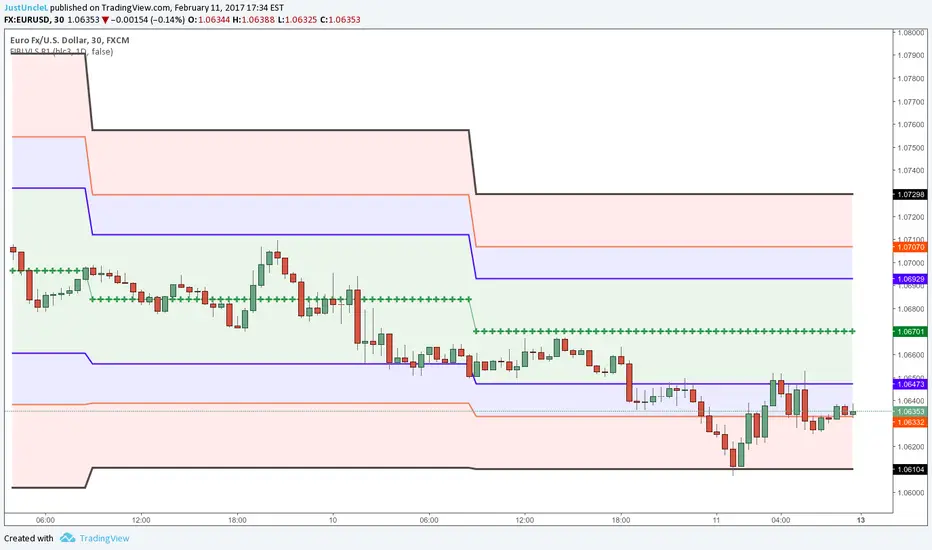
Auto Daily Fib Levels R2 by JustUncleLThis study is a variation of my "Automatic Daily Fibonnacci" indicator. This variation automatically draw Fibonacci Pivot levels (or optionally Classic Pivots) based on the previous day's highest and lowest points. The HLC3 is used as the default Daily Pivot level.
Unlike the "Automatic Daily Fibonnacci", this indicator does not redraw/update levels on current day even if the price goes past the R3/S3 levels.
Timeframe: is just a text string and is not checked, so needs to be a valid resolution eg: 60, 120, 240, 360, 480, 720, 1D, 1W, 1M, 2D, 2W, 3M
Pivot LEVELS:
Green = Pivot and Pivot Zone
Blue = R1,S1 Levels and Zone
Red = R2,S2 Levels and Zone
Black = R3,S3 Levels

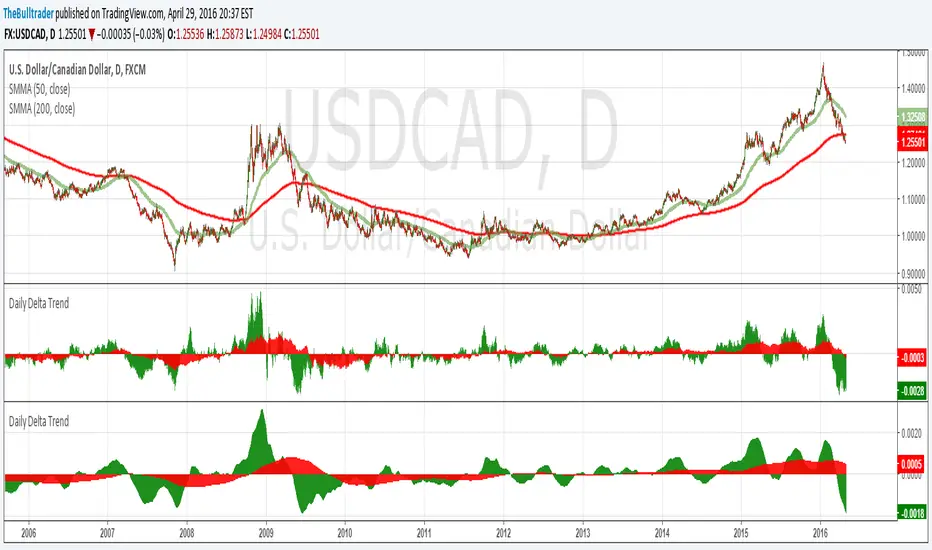
Daily Delta TrendDaily Delta Trend is a useful exponential moving average of the 50 day and 200 day simple moving average. In the first Daily Delta Trend I realized that the simple moving averages were pretty choppy as they were buy then sell over short period of times. So I thought taking an average of another average would smooth my results and give it buy and sell signals more clearly. In chart 1, you can see that it is choppy, and in chart 2 is much smoother.
The way I've been interpreting the chart is to trade it only when the 50-day average (GREEN) Trades with 200-day average (RED). For example, when red and green are both >0 = Buy and both <0 = Sell.
Just from a little of pretesting, I was able to find solid trades from multiple pairs.
DISCLAIMER, I have not actually traded this indicator as I just wrote it for the past few hours, But I thought it was interesting and maybe I might trade it. Feel free to play with it and comment back :P
CD_Average Daily Range Zones- highs and lows of the dayUses daily average ranges of 5 and 10 (most used) as buy (support) and highs (resistance) areas - half ranges used in calculations for a more accurate "forecast" of the H and L . Uses open but not close, so it does not repaint - experimental

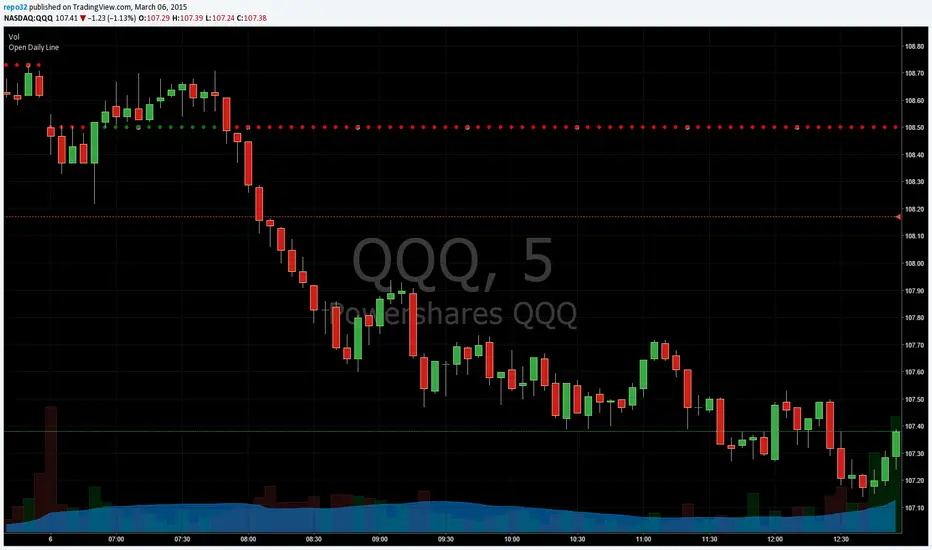
Open Close Daily LineThis will place circles on your chart for the opening daily price. If price is above, the circles are green. If price is below, the circles are red. I wanted to be able to see the opening price a bit easier while in smaller time frames.
I decided to add the previous daily closing line to the original script. Basically looking for good support / resistance

Open Daily LineThis will place circles on your chart for the opening daily price. If price is above, the circles are green. If price is below, the circles are red. I wanted to be able to see the opening price a bit easier while in smaller time frames.
Consecutive Candle CountAdaptation of www.fxcmapps.com from FXCM's Marketscope
Coded by David Rodriguez, Quantitative Strategist for DailyFX.com


Daily/Weekly EMAs on Lower TimeframesThis indicator allows traders to view Daily and Weekly EMAs (Exponential Moving Averages) directly on lower timeframes such as 1m, 5m, 15m, or 1h charts — providing a higher timeframe perspective without switching charts.
The script includes individual checkboxes for each EMA length — 5, 8, 9, 21, 50, and 200 — organized into two clear sections:
🟢 Daily EMAs
🔵 Weekly EMAs
You can selectively enable or disable any EMA to match your trading style and reduce chart clutter.
Each EMA is color-coded for clarity and consistency:
5 EMA: Green
8 EMA: Blue
9 EMA: Blue
21 EMA: Orange
50 EMA: Purple
200 EMA: Red
Weekly EMAs appear slightly transparent to distinguish them from daily ones.
This makes it easy to visualize higher timeframe trend direction, confluence zones, and dynamic support/resistance levels while trading intraday.
💡 Key Features
View Daily and Weekly EMAs on smaller timeframes.
Individual checkbox toggles for all 6 EMA lengths.
Separate sections for Daily and Weekly EMAs.
Color-coded lines for easy visual recognition.
Works seamlessly on any symbol or timeframe below Daily.

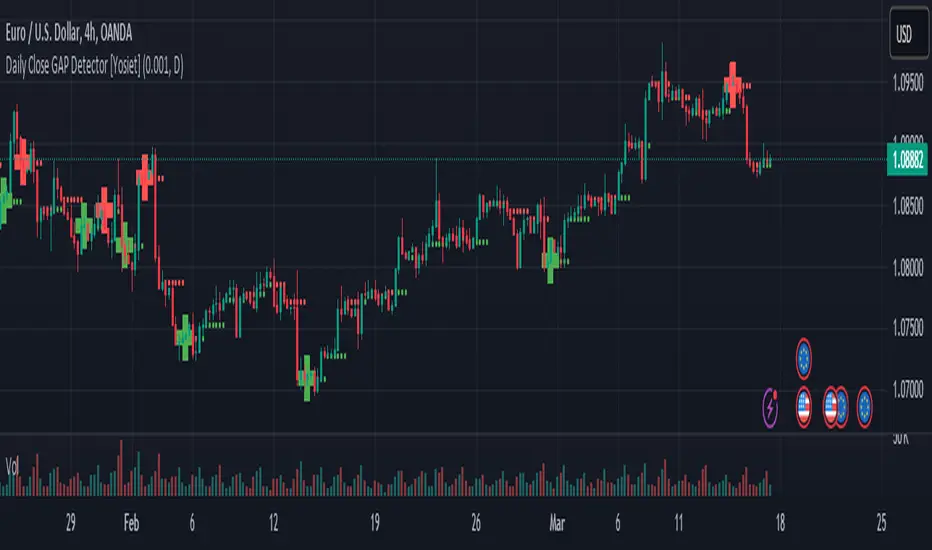
Daily Close GAP Detector [Yosiet]User Manual for "Daily Close GAP Detector "
Overview
This script is designed to help traders identify and react to significant gaps in daily market prices. It plots daily open and close prices and highlights significant gaps with a cross. The script is particularly useful for identifying potential breakouts or reversals based on these gaps.
Configuration
GAP Close Threshold: This input allows you to set a threshold for the gap size that you consider significant. The default value is 0.001.
Timeframe Seeker: This input lets you choose the timeframe for the gap detection. The default is 'D' for daily.
Features
Daily Open and Close Lines: The script plots daily open and close prices. If the close price is lower than the open price, the line is colored red; otherwise, it's green.
Gap Detection: It calculates the difference between the current day's close and the previous day's close, both adjusted for the selected timeframe. If this difference exceeds the threshold, it's considered a significant gap.
Significant Gap Indicator: A cross is plotted on the chart to indicate significant gaps. The color of the cross indicates whether the gap is a short or long gap: red for short gaps and green for long gaps.
Alert Conditions: The script sets up alert conditions for short and long gap breakouts. You can customize the alert messages to include details like the ticker symbol, interval, price, and exchange.
How to Use
Add the Script to Your Chart: Copy the script into the Pine Script editor on TradingView and add it to your chart.
Configure Inputs: Adjust the "GAP Close Threshold" and "Timeframe Seeker" inputs as needed.
Review the Chart: The script will overlay daily open and close prices on your chart, along with crosses indicating significant gaps.
Set Alerts: Use the script's alert conditions to set up alerts for short and long gap breakouts. You can customize the alert messages to suit your trading strategy.
Extending the Code
To extend this script, you can modify the gap detection logic, add more indicators, or integrate it with other scripts for a more comprehensive trading strategy. Remember to test any changes thoroughly before using them in live trading.
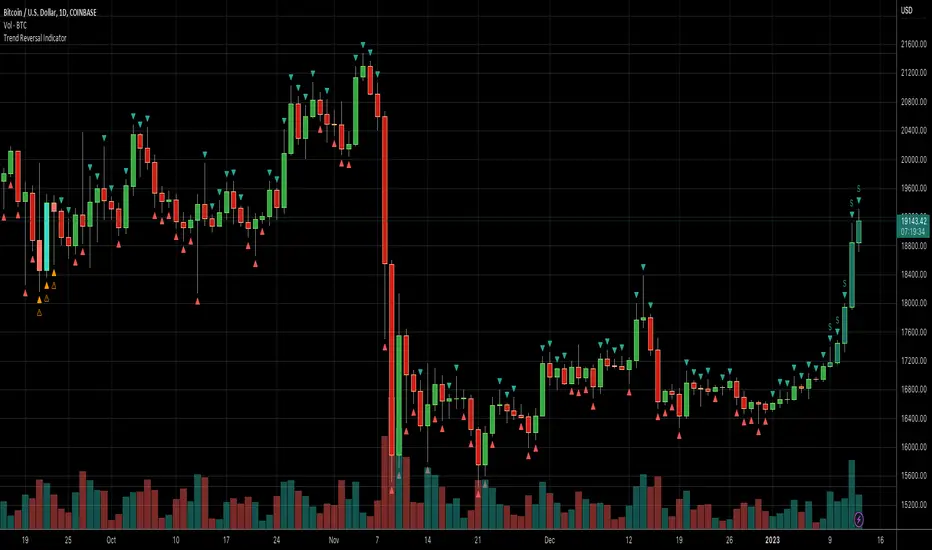
Daily Number/Trend Reversal IndicatorIndicator identifies potential price trend exhaustion.
Compares this period against the 4th prior period for the condition.
9 periods (or more) with the same condition is an indicator that the trend is ending soon.
Daily Session Windows background highlight indicatorIn intraday studies of stock indexes and Forex I have this weird habit of highlighting premarket, core session, lunch break and extended session with different backgrounds. If done by hand, this is tedious work that has to be repeated daily.
I think this feature should be built-in in TradingView. But it isn't.
For a few months now, I have been using this tiny indicator that does precisely that job. It saved me literally hours of focus time and mistakes. I have decided to revamp it and release it. I'm sure it can be useful to others.
Features:
Background color highlighting for premarket , core session , lunch hour and extended session of the trading day.
Session timing preset to match US session, but can be customized.
Can be enabled or disabled on a day of the week basis, including week-end.
Timezone is selectable, matches the chart's instrument but can be set independently to track a different timezone.
Not affected by the timezone you decided to assign to the chat's time scale.
Ready for stock indexes, but can be used to highlight Forex sessions too.

Daily Levels Suite + Market BreadthThere are many levels suites out there but many of them use the line series and/or label series to create multiple levels. Pine v5 provides the capability to use line arrays and labels so I wanted to create some code that is extensible to add additional lines/levels and labels to an array of lines with very little effort.
There is also some Market Breadth info that can be shown in the corners of the chart to allow a user to understand how the broader markets are moving compared to the security they are charting.
Current Levels provided are as follows:
Today's Open
Previous Days Close
Previous Days High/Low
Previous Days 50%
T+2 High/Low
All levels and the market breadth table is configurable to be hidden or shown based upon the user's desire.


Daily & Intraday Trend Alignment Strategy (KOSPI)This strategy is designed for the KOSPI market, focusing on the synergy between daily price action and intraday momentum. It is specifically backtested on KODEX 200 Leverage (122630) with a realistic capital of 10,000,000 KRW.
Key Logic:
Trend Alignment: The script identifies the daily trend by comparing the current price with the previous day's close.
Execution: It enters a position only when the intraday candle (15M or 60M) aligns with the daily trend.
LONG: Daily Bullish + Intraday Bullish Close.
SHORT: Daily Bearish + Intraday Bearish Close.
Risk Management: - Follows TradingView House Rules by limiting risk to 10% of equity per trade.
Includes realistic 0.04% commission and 2-tick slippage.
Features built-in Stop Loss and Take Profit levels.
Intraday Focus: Automatically closes all positions at 14:50 KST to avoid overnight market gaps.

Daily Relative Strength (Daily Update)📊 Daily Relative Strength Rank Table (Crypto / Multi-Asset)
This indicator provides a daily relative strength ranking of multiple assets using normalized percentage returns (Z-Scores). It is designed to help traders quickly identify which tokens are outperforming or underperforming the group, both today (live) and yesterday (finalized).
🔍 How It Works
Each asset’s daily percentage return is calculated from the daily close.
Returns are then normalized (Z-score) across the selected group, showing how far each asset deviates from the group average.
Assets are ranked from strongest to weakest based on today’s normalized score.
📈 Table Columns
Rank – Relative position vs other assets (higher = stronger)
Token – Asset symbol
Today Z – Live, intraday relative strength (updates in real time)
Yday Z – Frozen relative strength from the previous daily close
The Yesterday score does not repaint and remains constant throughout the day, allowing for clear comparison between today’s performance and the prior session.
🎯 Why Use This Indicator?
Quickly spot leaders and laggards
Compare assets on a percent-based, normalized scale
Avoid price bias (low-price and high-price assets are treated equally)
Ideal for rotation strategies, momentum trading, and market strength analysis
⚙️ Customization
All symbols can be changed directly in the indicator settings
Works on any timeframe (daily logic is handled internally)
Designed for crypto, but works with stocks, forex, or indices
🧠 Best Use Cases
Identifying top outperformers
Confirming trend continuation
Comparing sector or basket strength
Improving timing and capital allocation decisions

Daily/Weekly FVG by KrisThis indicator is a Multi-Timeframe (MTF) tool designed to automatically identify and project Fair Value Gaps (Imbalances) from Daily and Weekly timeframes onto your current chart. It helps traders locate higher-timeframe Areas of Interest (POI) and liquidity voids without manually switching charts.
How it works:
The script utilizes `request.security` to fetch High and Low data from Daily and Weekly timeframes. It identifies a Fair Value Gap (FVG) based on the 3-candle formation logic where price moves inefficiently, leaving a gap between the wicks.
- Bullish FVG: Identified when the current Daily/Weekly Low is greater than the High of the candle from 2 periods ago.
- Bearish FVG: Identified when the current Daily/Weekly High is lower than the Low of the candle from 2 periods ago.
The indicator draws a box extending to the right to visualize the zone, along with a dotted midline which often acts as a sensitive support/resistance level.
Unique Feature: Smart Mitigation (Auto-Hide)
To keep your chart clean and focused on relevant data, the script includes a "Full Fill" logic. It continuously monitors price action relative to existing FVG boxes.
- If price completely crosses through a box (fully fills the gap), the indicator considers it "mitigated" and automatically hides the box and its midline (sets transparency to 100%).
- This ensures you only see "fresh" or unfilled gaps that are still relevant for trading.
Settings:
- TF Checkboxes (Daily/Weekly FVG): Toggle the visibility of Daily or Weekly gaps independently based on your analysis needs.
- Design Mode:
Colored: Uses classic Green (Bullish) and Red (Bearish) colors for easy trend identification.
Monochrome: Uses Gray tones for a minimalist look that reduces visual noise on the chart.
Usage:
Use these zones to identify potential reversal points or liquidity targets. Since these are higher-timeframe levels, they often carry more weight than intraday imbalances.

Daily/Weekly Swing Highs-Lows + Candle PatternsDescription
Daily/Weekly Swing Highs-Lows + Candle Patterns
This indicator plots the most recent Daily and Weekly Swing Highs and Lows (key support/resistance levels) using a simple and effective logic: a swing high/low is confirmed when the previous bar's extreme is higher/lower than both the current and the one before it.
Features:
• Daily Swing Highs/Lows (teal/maroon circles) – toggleable
• Weekly Swing Highs/Lows (blue/purple circles) – optional
• Visual separators for new daily and weekly bars (light background color)
• Daily candle pattern labels (optional):
- US = Up Swing (strong bullish continuation)
- DS = Down Swing (strong bearish continuation)
- IN = Inside Bar
- OUT = Outside Bar
• Daily close position labels (optional):
- P = Positive (close in upper 25% of the range)
- mP = minor Positive (50–75%)
- mN = minor Negative (25–50%)
- N = Negative (lower 25%)
All elements are fully customizable (colors, visibility) and work on any timeframe.
Best suited for intraday timeframes (1 min to 4 hours) where daily and weekly key levels provide important context for price action and reversals.
The optional "Trading session length" input is mainly useful for markets with shorter sessions (e.g., European indices) and does not affect swing detection.
Open-source, free to use and modify.
How to Use the Indicator + Practical Use Case
Key Settings (Inputs)
Trading session length (hours) → Default 8.5 h (useful for FTSEMIB, DAX, etc.). Leave it as is unless you trade a market with a different session length.
Daily Swing Levels → Show/Hide daily swing highs (teal) and lows (maroon).
Weekly Swing Levels → Usually keep off on intraday charts to avoid clutter (turn on for higher-timeframe context).
Daily Candle Patterns → Enable only if you want to see US/DS/IN/OUT labels on the daily close.
Close Position (P/mP/mN/N) → Enable if you want to quickly see how strong/weak the daily close was.
What You See on the Chart
Teal circles = Last confirmed daily swing high (resistance).
Maroon circles = Last confirmed daily swing low (support).
Blue/purple circles (if enabled) = Weekly swing high/low.
Light gray background = Start of a new trading day.
Purple background (if weekly enabled) = Start of a new week.
Small labels on daily close (if enabled):
- US = strong bullish day
- DS = strong bearish day
- IN = inside bar (consolidation)
- OUT = outside bar (expansion)
- P/mP/mN/N = how far the close was from the high/low of the day.
Best Timeframes 1 min to 240 min charts → Daily levels act as major support/resistance zones for intraday trading.
Avoid using on daily or higher charts (the logic is designed for intraday context).
Why this works well intraday:
The daily swing high/low levels are high-probability zones where institutions and algorithms often defend positions. On intraday charts, they act as “magnets” for price, giving you clean entries and exits with clear invalidation levels.
This indicator keeps your chart clean while providing exactly the context most intraday traders need: key daily levels + daily momentum context.

Daily 9 SMA S/R with Std DevThis indicator plots the Daily 9 Simple Moving Average as dynamic support/resistance on any timeframe, with standard deviation bands to measure trend strength and identify overextended price action.
━━━━━━━━━━━━━━━━━━━━━━
HOW IT WORKS
━━━━━━━━━━━━━━━━━━━━━━
The Daily 9 SMA acts as a key level institutions watch. When price is above it, bullish bias. Below it, bearish bias. Simple.
Standard deviation bands show you:
- 1 StdDev = Strong trend territory
- 2 StdDev = Extreme/overextended - potential reversal zone
━━━━━━━━━━━━━━━━━━━━━━
FEATURES
━━━━━━━━━━━━━━━━━━━━━━
- Daily 9 SMA plotted on any timeframe
- 1 & 2 Standard Deviation bands
- Trend strength scoring (-3 to +3)
- Info table showing current values and trend status
- Visual signals for MA reclaims, losses, and trend entries
━━━━━━━━━━━━━━━━━━━━━━
ALERTS
━━━━━━━━━━━━━━━━━━━━━━
- Price Reclaims Daily 9 SMA
- Price Loses Daily 9 SMA
- Enter Strong Bullish Zone (>1 StdDev)
- Enter Strong Bearish Zone (<1 StdDev)
- Extreme Extension Alerts (2 StdDev)
- Bounce/Rejection at MA
━━━━━━━━━━━━━━━━━━━━━━
HOW TO USE
━━━━━━━━━━━━━━━━━━━━━━
1. Use on lower timeframes (5m, 15m, 1H) to see Daily levels
2. Look for bounces off the Daily 9 SMA for entries
3. Avoid longs when price loses the MA, avoid shorts when price reclaims
4. Use StdDev bands to gauge when price is overextended
━━━━━━━━━━━━━━━━━━━━━━
SETTINGS
━━━━━━━━━━━━━━━━━━━━━━
- MA Length - Default 9
- StdDev Multipliers - Default 1.0 and 2.0
- StdDev Lookback - Default 20
- Customizable colors
Works on any market - Forex, Crypto, Stocks, Futures.

Daily Dollar Cost Averaging (DCA) Simulator & Yearly PerformanceThis indicator simulates a "Daily Dollar Cost Averaging" strategy directly on your chart. Unlike standard backtesters that trade based on signals, this script calculates the performance of a portfolio where a fixed dollar amount is invested every single day, regardless of price action.
Key Features:
Daily Accumulation: Simulates buying a specific dollar amount (e.g., $10) at the market close every day.
Yearly Breakdown Table: A detailed dashboard displayed on the chart that breaks down performance by year. It tracks total invested, average entry price, total holdings, current value, and PnL percentage for each individual year.
Global Stats: The bottom row of the table summarizes the total performance of the entire strategy since the start date.
Breakeven Line: Plots a yellow line on the chart representing your "Global Average Price." When the current price is above this line, the total strategy is in profit.
How to Use:
Add to chart (Works best on the Daily (D) timeframe).
Open settings to adjust your Daily Investment Amount and Start Year.
The table will automatically update to show how a daily investment strategy would have performed over time.

Daily MA — Higher-Timeframe Daily Moving Average OverlayThis indicator plots a clean, higher-timeframe daily moving average directly on any chart, so you can always see where price sits relative to the daily trend — even while trading on lower timeframes (1m, 5m, etc.).
It’s designed to be:
Simple – a single, configurable daily MA line
Consistent – always anchored to the 1D timeframe
Flexible – choose EMA or SMA and customize line width/color
⸻
What This Indicator Does
Pulls the 1-Day (1D) moving average of the current symbol, regardless of your chart timeframe.
Lets you choose between EMA (Exponential Moving Average) or SMA (Simple Moving Average).
Plots that daily MA as a smooth overlay on your current chart.
Keeps the line visually clean and continuous, making it easy to see daily trend and dynamic support/resistance.
This is not a signals/strategy script. It doesn’t generate buy/sell arrows or backtest logic. It’s a context tool for visualizing the daily trend while you execute your own strategy.
⸻
Why a Daily MA Overlay Is Useful
Traders commonly use a daily moving average to:
Anchor intraday trades to the higher-timeframe trend
Longs when price is holding above the Daily MA
Shorts or caution when price is rejecting from the Daily MA
Identify dynamic support/resistance
Price often reacts around well-watched daily MAs (e.g., 50, 100, 200)
Filter setups
Only take long setups when price is above the daily trend line
Avoid counter-trend trades when price is extended far from the Daily MA
Because this script forces the MA to always be computed on 1D, you don’t have to switch back and forth between intraday and daily charts to keep track of the bigger picture.
⸻
Inputs & Settings
MA Length
Default: 200
Any positive integer (min 1)
Common examples: 50, 100, 200 for trend structure
MA Type
EMA – reacts faster to recent price (default)
SMA – smoother, slower, more “classic” feel
Line Width
Default: 2
Range: 1 to 10
Increase if you want the Daily MA to stand out clearly against other indicators
Color
Default: Purple tone
Fully customizable – pick any color that works with your chart theme
⸻
How to Use It in Your Workflow
Intraday traders (scalpers/day-traders):
Apply the indicator to your 1m/5m/15m charts.
Use the Daily MA as a trend filter :
Only look for long scalps when price is above the Daily MA.
Be more cautious with longs or consider shorts when price is below it.
Swing traders :
Use it on 1H/4H charts to see where price sits relative to a longer-term daily trend.
Watch for:
Pullbacks to the Daily MA in an uptrend as potential demand zones.
Rejections at the Daily MA in a downtrend as potential supply zones.
Risk management & context :
Avoid chasing extended moves far from the Daily MA.
Mark confluence with other tools (support/resistance, volume profile, etc.) around the Daily MA.
⸻
Notes & Limitations
The moving average itself is calculated from daily candles , then displayed on your current timeframe.
This is a visual aid only . It does not guarantee future performance or provide financial advice.
Always combine this indicator with your own analysis, risk management, and trading plan.
⸻
Disclaimer :
This script is provided for educational and informational purposes only. It is not financial advice and does not constitute a recommendation to buy or sell any financial instrument. Always do your own research and trade at your own risk.
