MACD-V with Volatility Normalisation [DCD]MACD-V with Volatility Normalisation
This indicator is a modified version of the traditional MACD, designed to account for market volatility by normalizing the MACD line using the Average True Range (ATR). It provides a more adaptive approach to identifying momentum shifts and potential trend reversals. This indicator was developed by Alex Spiroglou in this paper:
Spiroglou, Alex, MACD-V: Volatility Normalised Momentum (May 3, 2022).
Features:
Volatility Normalization: The MACD line is adjusted using ATR to standardize its values across different market conditions.
Customizable Parameters: Users can adjust the MACD fast length, slow length, signal line smoothing, and ATR length to suit their trading style.
Histogram Visualization: The histogram highlights the difference between the MACD and signal lines, with customizable colors for positive and negative momentum.
Crossover Signals: Green and red dots indicate bullish and bearish crossovers between the MACD and signal lines.
Background Highlighting: The chart background changes to green when the MACD is above 0 and red when it is below 0, providing a clear visual cue for bullish and bearish conditions.
Horizontal Levels: Dotted horizontal lines are plotted at key levels for better visualization of MACD values.
How to Use:
Look for crossovers between the MACD and signal lines to identify potential buy or sell signals.
Use the histogram to gauge the strength of momentum.
Pay attention to the background color for quick identification of bullish (green) or bearish (red) conditions.
This indicator is ideal for traders who want a more dynamic MACD that adapts to market volatility. Customize the settings to align with your trading strategy and timeframe.
In den Scripts nach "crossover债券是什么" suchen

Buy/Sell EMA Trend Filter v6Buy/Sell EMA Trend Filter v6
This indicator provides a comprehensive trading system based on EMA crossovers with trend filtering for TradingView. It's designed to identify high-probability buy and sell signals by combining short-term crossovers with longer-term trend direction confirmation.
Key Features:
EMA Crossover System: Uses fast and slow EMAs (9 and 21 by default) to generate initial signals
Trend Filtering: Confirms signals with longer-term trend direction (50 and 200 EMAs)
Automatic TP/SL Calculation: Displays clear take profit and stop loss levels based on fixed risk points
Visual Alerts: Clear buy/sell markers at the point of signal with detailed labels
Risk Management: Pre-calculated risk-to-reward setup (default 1:2 ratio)
How It Works:
Buy Signal: When the fast EMA crosses above the slow EMA while the 50 EMA is above the 200 EMA (bullish trend)
Sell Signal: When the fast EMA crosses below the slow EMA while the 50 EMA is below the 200 EMA (bearish trend)
Customizable Parameters:
Fast EMA period (default: 9)
Slow EMA period (default: 21)
Trend EMA periods (default: 50 and 200)
Fixed risk in points (default: 20)
Reward ratio (default: 2.0)
The indicator displays clear entry points with predefined stop loss and take profit levels, making it ideal for traders looking for a systematic approach to the markets. Perfect for both day trading and swing trading timeframes.
This tool combines both trend following and momentum principles to filter out low-probability trades and focus on high-quality setups where the trend and momentum align.

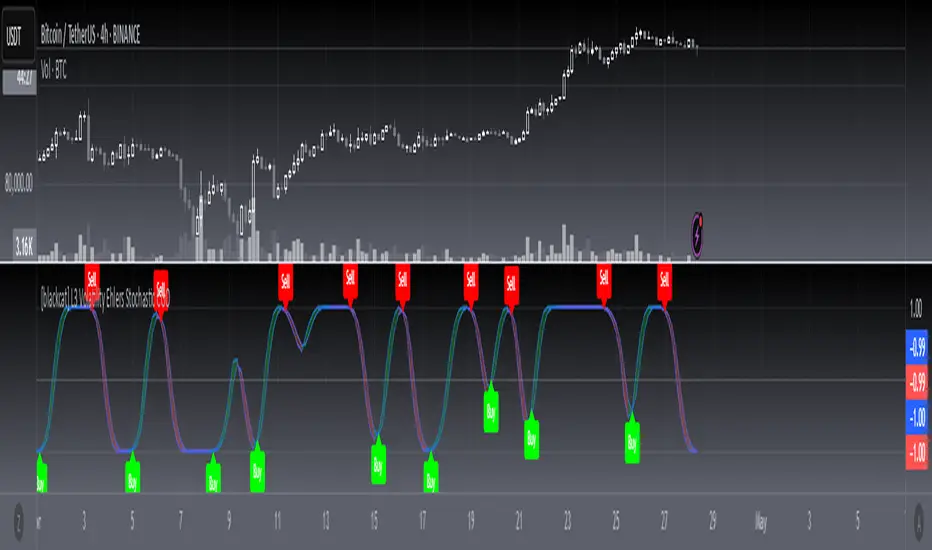
[blackcat] L3 Volatility Ehlers Stochastic CGOOVERVIEW
This advanced indicator integrates the Center of Gravity Oscillator (CGO) with an Ehlers-Stochastic framework and an Adaptive Local Minimum-Maximum Average (ALMA) smoothing algorithm. Designed for non-overlaid charts, it identifies market momentum shifts by analyzing price action through multi-layer volatility analysis.
FEATURES
• Dual-line system:
✓ Stochastic CGO: Core oscillating line derived from weighted OHLC price calculations
✓ ALMA Lagging Line: Smoothing component using customizable offset/sigma parameters
• Dynamic color scheme:
✓ Green/red trend differentiation via crossover comparison
✓ Optional fill areas between lines (toggleable)
• Clear trade signals:
✓ Buy/Sell labels triggered by mathematically defined crossovers
✓ Zero-reference baseline marker (#0ebb23)
• Customizable parameters:
Fast Length (9 default) controls CGO sensitivity
Slow Length (5 default) governs ALMA responsiveness
ALMA Offset/Sigma allow adaptive curve optimization
HOW TO USE
Configure core parameters:
• Adjust Fast Length (CGO timeframe window)
• Set Slow Length, ALMA Offset, and Sigma for smoother/laggier response
Interpret visuals:
• Bullish trend = green shaded zone (when primary line above lagging line)
• Bearish trend = red shaded zone (primary line below lagging line)
Analyze signals:
• Buy triggers occur when rising CGO crosses above ALMA while below zero
• Sell triggers activate when falling CGO breaks below ALMA after exceeding zero base
Optimize display:
✓ Enable/disable fill area via Fill Between Lines
LIMITATIONS
• Relies heavily on lookback periods - rapid market changes may reduce predictive accuracy
• Signal frequency increases during high-volatility environments
• Requires additional confirmation methods due to occasional premature crossovers
• Default parameter settings may lack universality across asset classes
NOTES
• Best paired with volume-based confirmations for stronger signals
• Reducing ALMA Sigma sharpens line responsiveness at cost of noise susceptibility
• Increasing Fast Length extends calculation horizon while reducing peak sensitivity
• Weighted OHLC source formula prioritizes closing prices for swing direction assessment
Power Balance Bull&Bear - CoffeeKillerPower Balance Bull&Bear - CoffeeKiller Indicator Guide
Welcome traders! This guide will walk you through the Power Balance Bull&Bear indicator, a unique and powerful market analysis tool developed by CoffeeKiller that visualizes the ongoing battle between buyers and sellers in any market.
Core Concept: Buyers vs. Sellers
The foundation of this indicator rests on a simple yet profound concept: every price movement in the market represents a battle between buyers and sellers.
Positive Green Line: Buyer Power
- Represents cumulative buying pressure in the market
- Tracks positive directional movement over a specified period
- Rising positive line indicates increasing buying momentum
- Peaks in the positive line show moments of maximum buyer dominance
Negative Red Line: Seller Power
- Represents cumulative selling pressure in the market
- Tracks negative directional movement over a specified period
- Falling negative line indicates increasing selling momentum
- Troughs in the negative line show moments of maximum seller dominance
Master Line: Market Balance
- Calculated as the difference between positive and negative movements
- Above zero: buyers are in control
- Below zero: sellers are in control
- Peaks and troughs: moments of extreme buyer or seller dominance
Core Components
1. Directional Movement Analysis
- Cumulative measurement of price changes in both directions
- Normalization for consistent visualization
- Optional smoothing for clearer signals
- Custom box size for sensitivity control
2. Distance Measurement
- Calculation of separation between buyer and seller lines
- Convergence and divergence thresholds
- Dynamic fill coloring based on distance trends
- Distance trend visualization
3. Peak Detection System
- Identification of local maxima and minima in buyer/seller dominance
- Background highlighting of significant peaks
- Zero-line cross detection for trend changes
- Visual cues for market extremes
4. Trend Analysis
- Buyer/seller line crossovers for major trend signals
- Distance trending for momentum confirmation
- Status monitoring (Near, Far, Normal)
- Direction tracking for both buyer and seller lines
Main Features
Time Resolution Settings
- Normal mode: calculations based on chart timeframe
- Custom resolution mode: calculations based on specified timeframe
- Multi-timeframe analysis capabilities
- Flexible time projection options
Visual Elements
- Color-coded buyer and seller lines
- Dynamic fill coloring based on convergence/divergence
- Background highlighting for significant peaks
- Distance line with threshold markers
Signal Generation
- Buyer/seller crossover alerts
- Convergence/divergence notifications
- Peak detection signals
- Status change alerts
Analysis Table(I personally don't use the table it was coded to take longer signals to show strength or weakness in overall trend)
- Current distance measurement
- Distance trend indication
- Status monitoring (Near, Far, Normal)
- Buyer and seller line trend tracking
Trading Applications
1. Trend Identification
- Buyer line crossing above seller line: bullish trend beginning
- Seller line crossing above buyer line: bearish trend beginning
- Distance between lines: trend strength
- Distance trending: momentum confirmation
2. Reversal Detection
- Peak formation after extended trend: potential exhaustion
- Buyer/seller line convergence: decreasing trend strength
- Distance falling below convergence threshold: potential trend change
- Background highlighting: visual cue for significant peaks
3. Momentum Analysis
- Increasing distance: accelerating trend
- Decreasing distance: decelerating trend
- Distance above divergence threshold: strong momentum
- Distance below convergence threshold: weak momentum
4. Market Balance Assessment
- Buyer line trend: indicates strength/weakness of bulls
- Seller line trend: indicates strength/weakness of bears
- Master line position relative to zero: overall market bias
- Distance between lines: consensus or disagreement in the market
Optimization Guide
1. Period Settings
- Longer period: smoother signals, less noise, fewer false signals
- Shorter period: more responsive, captures minor moves, potentially more noise
- Default (20): balanced approach for most timeframes
2. Box Size Parameter
- Smaller box size: more sensitive to price changes
- Larger box size: less sensitive, focuses on major moves
- Default (0.001): calibrated for typical price ranges
3. Distance Thresholds
- Convergence threshold: determines when lines are considered "near"
- Divergence threshold: determines when lines are considered "far"
- Adjusting these based on volatility of the instrument
4. Color Customization
- Positive Green line: representing buyer strength
- Negative Red line: representing seller strength
- Diverging fill: when the gap between buyers and sellers is increasing
- Converging fill: when buyers and sellers are moving closer together
Best Practices
1. Signal Confirmation
- Wait for buyer/seller crossovers to confirm
- Look for background highlighting at peaks
- Check distance trends for momentum confirmation
- Use the analysis table for additional context
2. Timeframe Selection
- Lower timeframes: more signals, potential noise
- Higher timeframes: cleaner signals, less frequent
- Custom resolution: allows comparison across timeframes
- Consider using multiple timeframes for confirmation
3. Market Context
- Strong buyer line rising + weak seller line: very bullish
- Strong seller line falling + weak buyer line: very bearish
- Both lines rising: volatile uptrend
- Both lines falling: volatile downtrend
4. Combining with Other Indicators
- Use with trend indicators for confirmation
- Pair with oscillators for overbought/oversold conditions
- Combine with volume analysis for validation
- Consider support/resistance levels when peaks form
Advanced Trading Strategies
1. Buyer/Seller Balance Strategy
- Enter long when buyer line crosses above seller line
- Enter short when seller line crosses above buyer line
- Use distance trend for filtering quality of signals
- Exit when distance falls below convergence threshold
2. Peak Trading Strategy
- Identify significant peaks with background highlighting
- Look for consecutive lower peaks in buyer line for shorting opportunities
- Look for consecutive higher troughs in seller line for buying opportunities
- Use master line crosses through zero as confirmation
3. Convergence/Divergence Strategy
- Enter positions when distance exceeds divergence threshold (strong trend)
- Take partial profits when distance starts decreasing
- Exit fully when distance falls below convergence threshold
- Re-enter when a new trend forms with increasing distance
4. Line Trend Combination Strategy
- Strongest bullish signal: Rising buyer line + falling seller line + increasing distance
- Strongest bearish signal: Falling buyer line + rising seller line + increasing distance
- Potential reversal signal: Decreasing distance + peak formation + line trend change
- Continuation signal: Consistent buyer/seller dominance + increasing distance after consolidation
Practical Analysis Examples
Bullish Market Scenario
- Buyer line trends upward as buying pressure increases
- Seller line remains flat or trends downward as selling pressure decreases
- Distance between lines expands, showing divergence (strong trend)
- Positive background highlights appear at new peaks in buyer dominance
- Master line moves further above zero
Bearish Market Scenario
- Seller line trends downward as selling pressure increases
- Buyer line remains flat or trends downward as buying pressure decreases
- Distance between lines expands, showing divergence (strong trend)
- Negative background highlights appear at new troughs in seller dominance
- Master line moves further below zero
Consolidation Scenario
- Buyer and seller lines move sideways
- Distance between lines narrows, showing convergence
- Few or no new peak highlights appear
- Master line oscillates close to the zero line
- Analysis table shows "Stable" trends for both buyer and seller lines
Understanding Market Dynamics Through Power Balance
At its core, this indicator provides a unique lens to visualize the ongoing battle between bulls and bears:
1. **Relative Strength**: When the buyer line rises faster than the seller line, bulls are gaining strength relative to bears - a bullish signal. When the seller line falls faster than the buyer line, bears are dominating - a bearish signal.
2. **Market Consensus**: Convergence between lines suggests market participants are reaching consensus about price direction. Divergence suggests growing disagreement and potential for stronger moves.
3. **Exhaustion Signals**: Major peaks in either line that are highlighted by background colors suggest moments where one side (buyers or sellers) has reached maximum strength - often precursors to reversals.
4. **Trend Confirmation**: The status indicators (Near, Far, Normal) provide context about the current market phase, helping confirm whether a trend is establishing, continuing strongly, or potentially fading.
Remember:
- Combine signals from buyer/seller lines, distance measurements, and peak formations
- Use appropriate timeframe settings for your trading style
- Monitor the analysis table for additional context
- Consider market conditions and correlate with price action
This indicator works best when:
- Used as part of a comprehensive trading system
- Combined with proper risk management
- Applied with an understanding of current market conditions
- Signals are confirmed by price action and other indicators
**DISCLAIMER**: This indicator and its signals are intended solely for educational and informational purposes. They do not constitute financial advice. Trading involves significant risk of loss. Always conduct your own analysis and consult with financial professionals before making trading decisions.

Keltner Channel StrategyOverview
The Keltner Channel Strategy is a powerful trend-following and mean-reversion system that leverages the Keltner Channels, EMA crossovers, and ATR-based stop-losses to optimize trade entries and exits. This strategy has proven to be highly effective, particularly when applied to Gold (XAUUSD) and other commodities with strong trend characteristics.
📈 How It Works
This strategy incorporates two trading approaches: 1️⃣ Keltner Channel Reversal Trades – Identifies overbought and oversold conditions when price touches the outer bands.
2️⃣ Trend Following Trades – Uses the 9 EMA & 21 EMA crossover, with confirmation from the 50 EMA, to enter trades in the direction of the trend.
🔍 Entry & Exit Criteria
📊 Keltner Channel Entries (Reversal Strategy)
✅ Long Entry: When the price crosses below the lower Keltner Band (potential reversal).
✅ Short Entry: When the price crosses above the upper Keltner Band (potential reversal).
⏳ Exit Conditions:
Long positions close when price crosses back above the mid-band (EMA-based).
Short positions close when price crosses back below the mid-band (EMA-based).
📈 Trend Following Entries (Momentum Strategy)
✅ Long Entry: When the 9 EMA crosses above the 21 EMA, and price is above the 50 EMA (bullish momentum).
✅ Short Entry: When the 9 EMA crosses below the 21 EMA, and price is below the 50 EMA (bearish momentum).
⏳ Exit Conditions:
Long positions close when the 9 EMA crosses back below the 21 EMA.
Short positions close when the 9 EMA crosses back above the 21 EMA.
📌 Risk Management & Profit Targeting
ATR-based Stop-Losses:
Long trades: Stop set at 1.5x ATR below entry price.
Short trades: Stop set at 1.5x ATR above entry price.
Take-Profit Levels:
Long trades: Profit target 2x ATR above entry price.
Short trades: Profit target 2x ATR below entry price.
🚀 Why Use This Strategy?
✅ Works exceptionally well on Gold (XAUUSD) due to high volatility.
✅ Combines reversal & trend strategies for improved adaptability.
✅ Uses ATR-based risk management for dynamic position sizing.
✅ Fully automated alerts for trade entries and exits.
🔔 Alerts
This script includes automated TradingView alerts for:
🔹 Keltner Band touches (Reversal signals).
🔹 EMA crossovers (Momentum trades).
🔹 Stop-loss & Take-profit activations.
📊 Ideal Markets & Timeframes
Best for: Gold (XAUUSD), NASDAQ (NQ), Crude Oil (CL), and trending assets.
Recommended Timeframes: 15m, 1H, 4H, Daily.
⚡️ How to Use
1️⃣ Add this script to your TradingView chart.
2️⃣ Select a 15m, 1H, or 4H timeframe for optimal results.
3️⃣ Enable alerts to receive trade notifications in real time.
4️⃣ Backtest and tweak ATR settings to fit your trading style.
🚀 Optimize your Gold trading with this Keltner Channel Strategy! Let me know how it performs for you. 💰📊

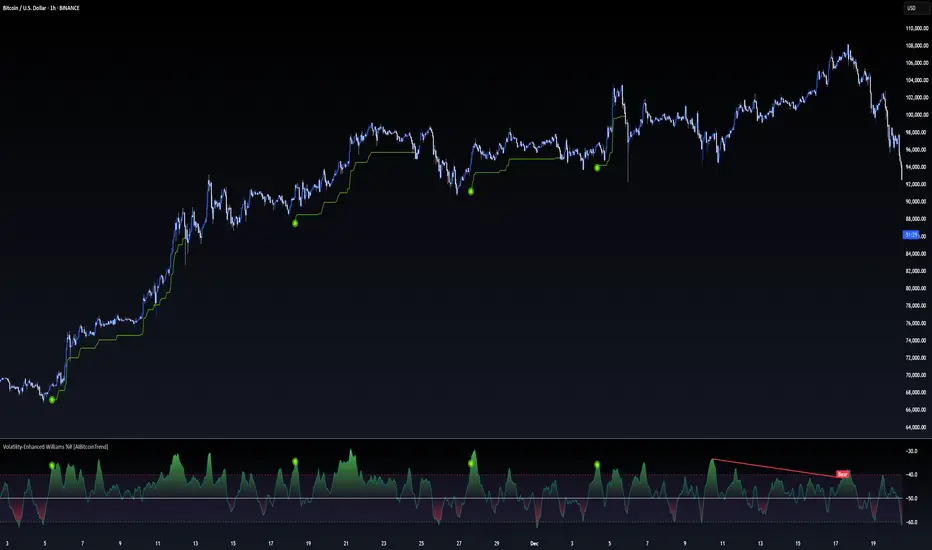
Volatility-Enhanced Williams %R [AIBitcoinTrend]👽 Volatility-Enhanced Williams %R (AIBitcoinTrend)
The Volatility-Enhanced Williams %R takes the classic Williams %R oscillator to the next level by incorporating volatility-adaptive smoothing, making it significantly more responsive to market dynamics. Unlike the traditional version, which uses a fixed calculation method, this indicator dynamically adjusts its smoothing factor based on market volatility, helping traders capture trends more effectively while filtering out noise.
Additionally, the indicator includes real-time divergence detection and an ATR-based trailing stop system, providing traders with enhanced risk management tools and early reversal signals.
👽 What Makes the Volatility-Enhanced Williams %R Unique?
Unlike the standard Williams %R, which applies a simple lookback-based formula, this version integrates adaptive smoothing and volatility-based filtering to refine its signals and reduce false breakouts.
✅ Volatility-Adaptive Smoothing – Adjusts dynamically based on standard deviation, enhancing signal accuracy.
✅ Real-Time Divergence Detection – Identifies bullish and bearish divergences for early trend reversal signals.
✅ Crossovers & Trailing Stops – Implements Williams %R crossovers with ATR-based trailing stops for intelligent trade management.
👽 The Math Behind the Indicator
👾 Volatility-Adaptive Smoothing
The indicator smooths the Williams %R calculation by applying an adaptive filtering mechanism, which adjusts its responsiveness based on market conditions. This helps to eliminate whipsaws and makes trend-following strategies more reliable.
The smoothing function is defined as:
clamp(x, lo, hi) => math.min(math.max(x, lo), hi)
adaptive(src, prev, len, divisor, minAlpha, maxAlpha) =>
vol = ta.stdev(src, len)
alpha = clamp(vol / divisor, minAlpha, maxAlpha)
prev + alpha * (src - prev)
Where:
Volatility Factor (vol) measures price dispersion using standard deviation.
Adaptive Alpha (alpha) dynamically adjusts smoothing strength.
Clamped Output ensures that the smoothing factor remains within a stable range.
👽 How Traders Can Use This Indicator
👾 Divergence Trading Strategy
Bullish Divergence Setup:
Price makes a lower low, while Williams %R forms a higher low.
Buy signal is confirmed when Williams %R reverses upward.
Bearish Divergence Setup:
Price makes a higher high, while Williams %R forms a lower high.
Sell signal is confirmed when Williams %R reverses downward.
👾 Trailing Stop & Signal-Based Trading
Bullish Setup:
✅ Williams %R crosses above trigger level → Buy signal.
✅ A bullish trailing stop is placed at Low - (ATR × Multiplier).
✅ Exit if price crosses below the stop.
Bearish Setup:
✅ Williams %R crosses below trigger level → Sell signal.
✅ A bearish trailing stop is placed at High + (ATR × Multiplier).
✅ Exit if price crosses above the stop.
👽 Why It’s Useful for Traders
Adaptive Filtering Mechanism – Avoids excessive noise while maintaining responsiveness.
Real-Time Divergence Alerts – Helps traders anticipate market reversals before they occur.
ATR-Based Risk Management – Stops dynamically adjust based on market volatility.
Multi-Market Compatibility – Works effectively across stocks, forex, crypto, and futures.
👽 Indicator Settings
Smoothing Factor – Controls how aggressively the indicator adapts to volatility.
Enable Divergence Analysis – Activates real-time divergence detection.
Lookback Period – Defines the number of bars for detecting pivot points.
Enable Crosses Signals – Turns on Williams %R crossover-based trade signals.
ATR Multiplier – Adjusts trailing stop sensitivity.
Disclaimer: This indicator is designed for educational purposes and does not constitute financial advice. Please consult a qualified financial advisor before making investment decisions.
RSI Trend Bias█ OVERVIEW
The RSI Trend Bias indicator is a custom technical analysis tool that utilizes the Relative Strength Index (RSI) to gauge market momentum and identify potential trend shifts. By monitoring RSI crossovers and crossunders relative to customizable threshold levels, the indicator provides clear visual cues that distinguish between bullish and bearish market conditions. This flexible approach makes it suitable for both short-term scalping and longer-term trend analysis.
█ KEY FEATURES
Dynamic RSI Trend Detection
The indicator dynamically determines market bias by monitoring the RSI for crossovers above the upper threshold and crossunders below the lower threshold. This method ensures that only significant momentum shifts trigger a change in trend, reducing false signals in volatile markets.
Adaptive Visualizations
The RSI Trend Bias indicator enhances clarity by plotting the RSI with colors that reflect current market conditions. Additionally, it offers an optional background color change to further emphasize bullish or bearish states, providing immediate visual feedback to traders.
Clear Threshold Indicators
Upper and lower threshold levels are plotted as constant reference lines, clearly delineating overbought and oversold regions. These markers help traders quickly assess market conditions at a glance.
Customizable Settings
Users have full control over key parameters including the RSI length, threshold levels, and visual settings. This customization allows the indicator to be tailored for different markets and trading styles, ensuring optimal performance across various timeframes.
█ UNDERLYING METHODOLOGY & CALCULATIONS
RSI Calculation
The indicator computes the Relative Strength Index over a user-defined period (default is 14), providing a measure of market momentum that reflects price changes over time.
Trend Determination Logic
By detecting when the RSI crosses above the upper threshold, the indicator signals a shift towards bullish momentum. Conversely, a crossunder below the lower threshold indicates bearish conditions. This straightforward binary approach filters out minor fluctuations, ensuring clarity in trend analysis.
Visual Signal Integration
Based on the detected trend, the RSI line is dynamically colored—green for bullish conditions and red for bearish conditions. An optional background color change further reinforces these signals, offering an immediate visual cue of prevailing market sentiment.
█ HOW TO USE THE INDICATOR
1 — Apply the Indicator
• Add the RSI Trend Bias indicator to a separate pane in your trading platform.
2 — Adjust Settings for Your Market
• RSI Length – Define the period for RSI calculation (default is 14).
• Threshold Levels – Set the upper (default 70) and lower (default 30) thresholds to identify overbought and oversold conditions.
• Visual Customization – Choose the bullish (green) and bearish (red) colors, and enable background color changes to enhance visual trend recognition.
3 — Interpret the Signals
• RSI Line – Observe the dynamically colored RSI line; a shift to green signals bullish momentum, while red indicates bearish conditions.
• Threshold Levels – Use the constant upper and lower lines as reference points for overbought and oversold states.
• Signal Timing – A crossover above the upper threshold or a crossunder below the lower threshold suggests potential entry or exit points.
4 — Integrate with Your Trading Strategy
• Combine RSI Trend Bias signals with other technical analysis tools to confirm market direction.
• Utilize the visual cues for fine-tuning your entry and exit decisions, ensuring robust risk management and optimized trade timing.
█ CONCLUSION
The RSI Trend Bias indicator offers a streamlined yet effective approach to monitoring market momentum. By leveraging the established principles of RSI analysis alongside dynamic visual cues, it enables traders to quickly identify bullish and bearish trends. Its customizable features and clear threshold indicators make it a valuable tool for enhancing technical analysis and making informed trading decisions.

On Balance Volume with Cross DetectionThis indicator enhances the On Balance Volume (OBV) indicator by detecting and visually highlighting crossovers and crossunders between the OBV and its smoothed moving average. The script colors the background of the chart to make these key events more noticeable: red highlights a bearish crossunder when the OBV crosses below the smoothed OBV, while green marks a bullish crossover when the OBV crosses above the smoothed OBV. By focusing on these significant interactions, the script provides traders with a clear visual cue to help identify potential buying and selling opportunities based on the relationship between OBV and its smoothed trend.
This script offers several customizable features to suit different trading preferences. The main editable parameter is the type of moving average used to smooth the OBV: you can choose from options such as Simple Moving Average (SMA), Exponential Moving Average (EMA), Smoothed Moving Average (RMA), Weighted Moving Average (WMA), or Volume Weighted Moving Average (VWMA). The length of the moving average can also be adjusted to better match the trader’s desired sensitivity, with the default set to 14 periods. These options allow traders to tailor the script to their preferred smoothing method and time frame, making it a flexible tool for a variety of strategies. The ability to switch between different moving averages and adjust their lengths ensures that the script can be adapted to various market conditions and trading styles.
This indicator enhances the analysis of the On Balance Volume (OBV) indicator by visually highlighting key crossovers and crossunders with its smoothed moving average. With customizable settings for different moving averages and lengths, traders can tailor the script to their specific strategies. By offering clear visual cues through background coloring, it helps quickly identify potential buy and sell signals. When combined with other technical analysis tools, this script can further improve trading decisions by providing additional context and confirmation, allowing traders to create a more robust and comprehensive trading strategy.

Williams %R IntensityOverview
"Williams %R Intensity" is a unique indicator that combines the classic Williams %R with a dynamic intensity-based visualization. This indicator helps traders identify overbought and oversold conditions with enhanced clarity while also predicting potential future crossovers using smoothed slope calculations. It is tailored for traders seeking a more nuanced approach to trend detection and momentum analysis.
Features and How It Works
Core Calculation:
Williams %R : Measures the current closing price relative to the highest high and lowest low over a user-defined length (default: 14).
Exponential Moving Average (EMA) : Smoothens the %R values for better trend tracking (default length: 14).
Overbought/Oversold Zones :
Upper and lower threshold levels are set at -20 (overbought) and -80 (oversold), making it easier to identify extreme conditions.
Intensity Visualization:
The intensity is calculated based on the absolute distance between Williams %R and its EMA.
The closer the value is to extreme levels, the more pronounced the visual intensity, capping at 90% transparency.
Overbought conditions are highlighted in red; oversold conditions in teal.
Crossover Signals:
Bullish Cross: When Williams %R crosses above its EMA in the oversold zone.
Bearish Cross: When Williams %R crosses below its EMA in the overbought zone.
The background color changes (lime for bullish, red for bearish) to highlight these critical moments when enabled via the "Show Cross & Predicted Cross Signal" option.
Future Cross Prediction:
Uses the smoothed slope of %R to estimate future values over a customizable number of steps.
Predicts potential bullish or bearish crosses based on the interaction between the predicted Williams %R and EMA.
Light green and light red background colors indicate predicted bullish and bearish crosses, respectively.
How to Use
Trend Detection: Use the Williams %R and its EMA to identify ongoing trends and confirm their strength.
Overbought/Oversold Analysis: Pay attention to crosses in extreme zones (-20 and -80) for potential reversals.
Intensity-Based Filtering: The intensity visualization helps to focus on the most significant conditions, reducing noise.
Cross Prediction: Enable "Show Cross & Predicted Cross Signal" to anticipate future turning points and plan trades proactively.
Example Applications
Scalping: Monitor rapid crossovers in lower timeframes for quick entries and exits.
Swing Trading: Use the overbought/oversold zones and cross predictions to identify longer-term reversal opportunities.
Risk Management: The intensity visualization can be used to filter out weak signals, ensuring higher-quality trade setups.
Chart Information
For clarity and compliance with publishing standards:
The chart should display the full symbol, timeframe, and the script name ("Williams %R Intensity").
Ensure the indicator is visible and properly configured for the chart.

Arrow-SimplyTrade vol1.5-FinalTitle: Arrow-SimplyTrade vol1.5-Final
Description:
This advanced trading indicator is designed to assist traders in analyzing market trends and identifying optimal entry signals. It combines several popular technical analysis tools and strategies, including EMA (Exponential Moving Average), MA (Simple Moving Averages), Bollinger Bands, and candlestick patterns. This indicator provides both trend-following and counter-trend signals, making it suitable for various trading styles, such as scalping and swing trading.
Main Features:
EMA (Exponential Moving Average):
EMA200 is the main trend line that helps determine the overall market direction. When the price is above EMA200, the trend is considered bullish, and when the price is below EMA200, the trend is considered bearish.
It helps filter out signals that go against the prevailing market trend.
Simple Moving Averages (MA5 and MA15):
This indicator uses two Simple Moving Averages: MA5 (Fast) and MA15 (Slow). Their crossovers create buy or sell signals:
Buy Signal: When MA5 crosses above MA15, signaling a potential upward trend.
Sell Signal: When MA5 crosses below MA15, signaling a potential downward trend.
Bollinger Bands:
Bollinger Bands measure market volatility and can identify periods of overbought or oversold conditions. The Upper and Lower Bands help detect potential breakout points, while the Middle Line (Basis) serves as dynamic support or resistance.
This tool is particularly useful for identifying volatile conditions and potential reversals.
Arrows:
The indicator plots arrows on the chart to signal entry opportunities:
Green Arrows signal buy opportunities (when MA5 crosses above MA15 and price is above EMA200).
Red Arrows signal sell opportunities (when MA5 crosses below MA15 and price is below EMA200).
Opposite Arrows: Optionally, the indicator can also display arrows for counter-trend signals, triggered by MA5 and MA15 crossovers, regardless of the price's position relative to EMA200.
Candlestick Patterns:
The indicator detects popular candlestick patterns such as Bullish Engulfing, Bearish Engulfing, Hammer, and Doji.
These patterns are important for confirming entry points or anticipating trend reversals.
How to Use:
EMA200: The main trend line. If the price is above EMA200, consider long positions. If the price is below EMA200, consider short positions.
MA5 and MA15: Short-term trend indicators. The crossover of these averages generates buy or sell signals.
Bollinger Bands: Use these bands to spot overbought/oversold conditions. Breakouts from the bands may signal potential entry points.
Arrows: Green arrows represent buy signals, and red arrows represent sell signals. Opposite direction arrows can be used for counter-trend strategies.
Candlestick Patterns: Patterns like Bullish Engulfing or Doji can help confirm the signals.
Customizable Settings:
Fully customizable colors, line styles, and display settings for EMA, MAs, Bollinger Bands, and arrows.
The Candlestick Patterns feature can be toggled on or off based on user preference.
Important Notes:
This indicator is intended to be used in conjunction with other analysis tools.
Past performance does not guarantee future results.
Polish:
Tytuł: Arrow-SimplyTrade vol1.5-Final
Opis:
Ten zaawansowany wskaźnik handlowy jest zaprojektowany, aby pomóc traderom w analizie trendów rynkowych oraz identyfikowaniu optymalnych sygnałów wejścia. Łączy w sobie kilka popularnych narzędzi analizy technicznej i strategii, w tym EMA (Wykładnicza Średnia Ruchoma), MA (Prosta Średnia Ruchoma), Bollinger Bands oraz formacje świecowe. Wskaźnik generuje zarówno sygnały podążające za trendem, jak i przeciwnym trendowi, co sprawia, że jest odpowiedni do różnych stylów handlu, takich jak scalping oraz swing trading.
Główne Funkcje:
EMA (Wykładnicza Średnia Ruchoma):
EMA200 to główna linia trendu, która pomaga określić ogólny kierunek rynku. Gdy cena znajduje się powyżej EMA200, trend jest uznawany za wzrostowy, a gdy poniżej EMA200, za spadkowy.
Pomaga to filtrować sygnały, które są niezgodne z głównym trendem rynkowym.
Proste Średnie Ruchome (MA5 i MA15):
Wskaźnik używa dwóch Prostych Średnich Ruchomych: MA5 (szybka) oraz MA15 (wolna). Ich przecięcia generują sygnały kupna lub sprzedaży:
Sygnał Kupna: Kiedy MA5 przecina MA15 od dołu, sygnalizując potencjalny wzrost.
Sygnał Sprzedaży: Kiedy MA5 przecina MA15 od góry, sygnalizując potencjalny spadek.
Bollinger Bands:
Bollinger Bands mierzą zmienność rynku i mogą pomóc w identyfikowaniu okresów wykupienia lub wyprzedania rynku. Górna i dolna linia pomagają wykrywać punkty wybicia, a Środkowa Linia (Basis) działa jako dynamiczny poziom wsparcia lub oporu.
Narzędzie to jest szczególnie przydatne w wykrywaniu warunków zmienności i potencjalnych odwróceń trendu.
Strzałki:
Wskaźnik wyświetla strzałki na wykresie, które wskazują sygnały kupna i sprzedaży:
Zielona strzałka wskazuje sygnał kupna (gdy MA5 przecina MA15 i cena jest powyżej EMA200).
Czerwona strzałka wskazuje sygnał sprzedaży (gdy MA5 przecina MA15 i cena jest poniżej EMA200).
Strzałki w przeciwnym kierunku: Opcjonalna funkcja, która pokazuje strzałki w przeciwnym kierunku, uruchamiane przez przecięcia MA5 i MA15, niezależnie od pozycji ceny względem EMA200.
Formacje Świecowe:
Wskaźnik wykrywa popularne formacje świecowe, takie jak Bullish Engulfing, Bearish Engulfing, Hammer oraz Doji.
Formacje te pomagają traderom potwierdzić punkty wejścia i przewidzieć możliwe odwrócenia trendu.
Jak Używać:
EMA200: Główna linia trendu. Jeśli cena jest powyżej EMA200, rozważaj pozycje długie. Jeśli cena jest poniżej EMA200, rozważaj pozycje krótkie.
MA5 i MA15: Śledzą krótkoterminowe zmiany trendu. Przecięcia tych średnich generują sygnały kupna lub sprzedaży.
Bollinger Bands: Używaj tych pasm do wykrywania wykupionych lub wyprzedanych warunków. Wybicia z pasm mogą wskazywać potencjalne punkty wejścia.
Strzałki: Zielona strzałka wskazuje sygnał kupna, a czerwona strzałka sygnał sprzedaży. Strzałki w przeciwnym kierunku mogą być używane do strategii przeciwtrendowych.
Formacje Świecowe: Formacje takie jak Bullish Engulfing czy Doji mogą pomóc w potwierdzaniu sygnałów.
Ustawienia Personalizacji:
W pełni personalizowalne kolory, style linii i ustawienia wyświetlania dla EMA, MAs, Bollinger Bands oraz strzałek.
Funkcja Formacji Świecowych może być włączana lub wyłączana według preferencji użytkownika.
Ważne Uwagi:
Ten wskaźnik powinien być używany w połączeniu z innymi narzędziami analizy rynku.
Wyniki z przeszłości nie gwarantują wyników w przyszłości.

Dynamic Signal EngineDynamic Signal Engine
The Dynamic Signal Engine is a powerful and versatile indicator, designed to help traders make informed decisions by combining trend analysis with key support and resistance levels. This tool is inspired by the Linear Regression Oscillator , which laid the foundation for this enhanced implementation. By building on the original concept, this script introduces additional features, customization, and integration with dynamic trading strategies to suit diverse trading styles.
Key Features
Inspiration and Foundation
This indicator draws inspiration from the Linear Regression Oscillator , leveraging its robust trend detection capabilities while adding custom enhancements for broader functionality and user adaptability.
Trading Style Customization
Adaptable for Scalping, Intraday, and Swing Trading with dynamic parameter adjustments for each style.
User-defined inputs for thresholds, lookback periods, and visualization options provide further control.
Enhanced Linear Regression Oscillator (LRO)
A refined implementation of the LRO calculates deviations from a regression line, normalized for improved trend detection.
Identifies bullish and bearish crossovers with added alerts and visual markers.
Includes proximity alerts for critical thresholds to help traders anticipate key market movements.
Dynamic Support and Resistance Integration
Incorporates ENIGMA Signal Logic to identify swing highs and lows, dynamically marking them as fractal support and resistance levels.
When a sell signal from ENIGMA is generated, traders can choose to sell immediately or use the low of the previous candle as the entry point. Similarly, for a buy signal, traders can buy immediately or use the high of the previous candle for entry. These signals are visually indicated by a green triangle for buy signals, ensuring clear and actionable insights.
Advanced Visualization
Displays key levels with customizable horizontal lines (solid, dashed, or dotted) and labels for clarity.
Candle colours and mini arrows highlight trends and potential trading opportunities.
Real-Time Alerts
Alerts for LRO threshold crossings and swing-level breaches keep you updated without the need for constant monitoring.
Optimized for Usability
Designed to keep charts clean by limiting displayed trades and signals to recent activity.
Adjustable parameters ensure flexibility and a user-friendly experience.
How It Works
Trend Detection with Enhanced LRO
The indicator builds on the Linear Regression Oscillator , calculating oscillations of price movements and normalizing them for trend analysis. Crossovers and threshold proximity are visualized on the chart and trigger alerts for potential market shifts.
Dynamic Support and Resistance Levels
The ENIGMA Signal Logic identifies recent swing highs and lows, marking them as key levels. These levels are dynamically updated as new swing points are detected, providing actionable support and resistance zones.
Signal Confirmation
Buy or sell signals are confirmed when:
Price breaches the swing levels.
The LRO aligns with directional bias (e.g., bearish crossover for sell signals).
Signals are further clarified by ENIGMA's green triangle indicators, showing key buy and sell opportunities.
Visualization and Alerts
Signals are displayed using arrows, labelled horizontal lines, and optional candle colours. Alerts notify traders of key events, such as LRO threshold crossings or swing-level breaches.
How to Use
Choose your Trading Style: Scalping, Intraday, or Swing Trading. The indicator adjusts its default settings automatically.
Fine-tune parameters like LRO thresholds, line lengths, and the number of visible trades to suit your preferences.
Observe the chart for signals:
Green arrows and lines indicate buy opportunities.
Red arrows and lines signal sell opportunities.
Use the alert system to stay informed about LRO thresholds and signal confirmations.
Integrate the indicator with your existing trading strategy for better decision-making.
Acknowledgement
This script was inspired by the Linear Regression Oscillator . While it builds on the core concept, this implementation introduces unique enhancements, such as dynamic signal integration, trading style adaptability, and advanced visualization tools, making it a highly customizable and versatile tool for traders.
Disclaimer
This indicator is intended for educational purposes only and should not be considered financial advice. Always perform due diligence and apply appropriate risk management when trading.

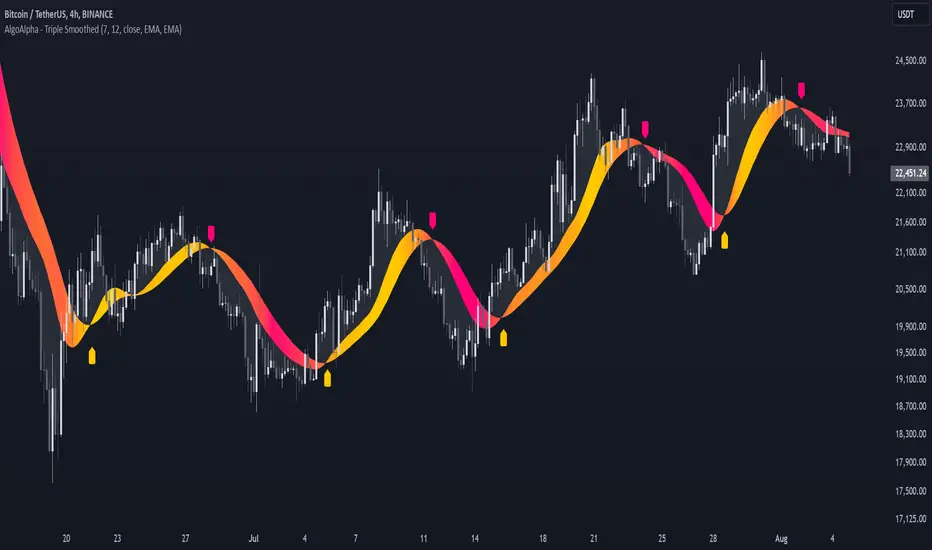
Triple Smoothed Signals [AlgoAlpha]Introducing the Triple Smoothed Signals indicator by AlgoAlpha, a powerful tool designed to help traders identify trend direction and market momentum with greater accuracy. By applying triple smoothing techniques to your chosen data source, this indicator filters out market noise, allowing you to focus on significant price movements. Perfect for traders looking to enhance their technical analysis and gain an edge in the markets.
Key Features
🎨 Customizable Moving Averages : Choose between EMA, SMA, RMA, or WMA for both the triple smoothing and the signal line to tailor the indicator to your trading style.
🛠 Adjustable Smoothing Lengths : Configure the main smoothing length and signal length to fit different timeframes and market conditions.
🌈 Dynamic Color Fills : Visual gradients and fills highlight trend strength and direction, making chart analysis more intuitive.
🔔 Alerts : Set alerts for bullish and bearish crossover signals to stay ahead of market moves without constant chart monitoring.
📈 Clear Signal Visualization : Bullish and bearish signals are plotted directly on your chart for easy interpretation and timely decision-making.
Quick Guide to Using the Triple Smoothed Signals Indicator
🛠 Add the Indicator : Add the indicator to your TradingView chart by clicking on the star icon to add it to your favorites. Customize the settings such as the main smoothing length, signal length, data source, and moving average types to match your trading strategy.
📊 Market Analysis : Monitor the crossovers between the triple smoothed moving average and the signal line. A bullish signal is generated when the signal line crosses under the triple smoothed MA, indicating a potential upward trend. Conversely, a bearish signal occurs when the signal line crosses over the triple smoothed MA, suggesting a possible downward trend.
🔔 Alerts : Enable notifications for reversal signals and trend shifts to stay informed about market movements without constantly monitoring the chart.
How It Works
The Triple Smoothed Signals indicator enhances trend detection by applying a triple smoothing process to your selected data source using the moving average type of your choice (EMA, SMA, RMA, or WMA). This triple smoothed moving average (v1) effectively reduces short-term fluctuations and noise, revealing the underlying market trend. A signal line (v2) is then calculated by smoothing the triple smoothed MA with a separate moving average, further refining the signal. The indicator calculates the normalized distance between the triple smoothed MA and the signal line over a specified period, which is used to create dynamic color gradients and fills on the chart. These visual elements provide immediate insight into trend strength and direction. Bullish and bearish signals are generated based on the crossovers between the signal line and the triple smoothed MA, and are plotted directly on the chart along with customizable alerts to assist traders in making timely decisions.
MERCURY by DrAbhiramSivprasad"MERCURY by DrAbhiramSivprasad"
Developed from over 10 years of personal trading experience, the Mercury Indicator is a strategic tool designed to enhance accuracy in trading decisions. Think of it as a guiding light—a supportive tool that helps traders refine and build more robust strategies by integrating multiple powerful elements into a single indicator. I’ll be sharing some examples to illustrate how I use this indicator in my own trading journey, highlighting its potential to improve strategy accuracy.
Reason behind the combination of emas , cpr and vwap is it provides very good support and resistance in my trading carrier so now i brought them together in one plate
How It Works:
Mercury combines three essential elements—EMA, VWAP, and CPR—each of which plays a vital role in detecting support and resistance:
Exponential Moving Averages (EMAs): Known for their strength in providing dynamic support and resistance levels, EMAs help in identifying trends and shifts in momentum. This indicator includes a dashboard with up to nine customizable EMAs, showing whether each is acting as support or resistance based on real-time price movement.
Volume Weighted Average Price (VWAP): VWAP also provides valuable support and resistance, often regarded as a fair price level by institutional traders. Paired with EMAs, it forms a dual-layered support/resistance system, adding an additional level of confirmation.
Central Pivot Range (CPR): By combining CPR with EMAs and VWAP, Mercury highlights “traffic blocks” in your target journey. This means it identifies zones where price is likely to stall or reverse, providing additional guidance for navigating entries and exits.
Why This Combination Matters:
Using these three tools together gives you a more complete view of the market. VWAP and EMAs offer dynamic trend direction and support/resistance, while CPR pinpoints critical price zones. This combination helps you find high-probability trades, adding clarity to complex market situations and enabling stronger confirmation on trend or reversal decisions.
How to Use:
Trend Confirmation: Check if all EMAs are aligned (green for uptrend, red for downtrend), which is visible in the EMA dashboard. An alignment across VWAP, CPR, and EMAs signifies high confidence in trend direction.
Breakouts & Breakdowns: Mercury has an alert system to signal when a price breakout or breakdown occurs across VWAP, EMA1, and EMA2. This can help in spotting strong directional moves.
Example Application: In my trading, I use Mercury to identify support/resistance zones, confirming trends with EMA/VWAP alignment and using CPR as a checkpoint. I find this especially useful for day trading and swing setups.
Recommended Timeframes:
Day Trading: 5 to 15-minute charts for swift, actionable insights.
Swing Trading: 1-hour or 4-hour charts for broader trend analysis.
Note:
The Mercury Indicator should be used as a supportive tool rather than a standalone strategy, guiding you toward informed decisions in line with your trading style and goals.
EXAMPLE OF TRADE
you can see the cart of XAUUSD on 11th nov 2024
1.SHORT POSITION - TIME FRAME 15 MIN
So here for a short position you need to wait for a breakdown candle which will print in orange post the candle you need to check ema dashboard is completly red that indicates no traffic blocks in your journey to destiny target from ema's and you can take the target from nearest cpr support line
TAKEN IN XAUUSD you can see in chart of XAUUSD on 7th nov
2.LONG POSITION - TIME FRAME 15 MIN -
So here for long position you need to wait for a breakout candle from indicator thats here is blue and check all ema boxes are green and candle body should close above all the 3 lines here it is the both ema 1 and 2 and the vwap line then you can take and entry and your target will be the nearest resistance from the daily cpr
3. STOP LOSS CRITERIA
After the entry any candle close below any of the last line from entry for example we have 3 lines vwap and ema 1 and 2 lines and u have made an entry and the last line before the entry is vwap then if any candle closes below vwap can be considered as stoploss like wise in any lines
The MERCURY indicator is a comprehensive trading tool designed to enhance traders' ability to identify trends, breakouts, and reversals effectively. Created by Dr. Abhiram Sivprasad, this indicator integrates several technical elements, including Central Pivot Range (CPR), EMA crossovers, VWAP levels, and a table-based EMA dashboard, to offer a holistic trading view.
Core Components and Functionality:
Central Pivot Range (CPR):
The CPR in MERCURY provides a central pivot level along with Below Central (BC) and Top Central (TC) pivots. These levels act as potential support and resistance, useful for identifying reversal points and zones where price may consolidate.
Exponential Moving Averages (EMAs):
MERCURY includes up to nine EMAs, with a customizable EMA crossover alert system. This feature enables traders to see shifts in trend direction, especially when shorter EMAs cross longer ones.
VWAP (Volume-Weighted Average Price):
VWAP is incorporated as a dynamic support/resistance level and, combined with EMA crossovers, helps refine entry and exit points for higher probability trades.
Breakout and Breakdown Alerts:
MERCURY monitors conditions for upside and downside breakouts. For an upside breakout, all EMAs turn green and a candle closes above VWAP, EMA1, and EMA2. Similarly, all EMAs turning red, combined with a close below VWAP and EMA1/EMA2, signals a downside breakdown. Continuous alerts are available until the trend shifts.
Real-Time EMA Dashboard:
A table displays each EMA’s relative position (Above or Below), helping traders quickly gauge trend direction. Colors in the table adjust to long/short conditions based on EMA alignment.
Usage Recommendations:
Trend Confirmation:
Use the CPR, EMA alignments, and VWAP to confirm uptrends and downtrends. The table highlights trends, making it easy to spot long or short setups at a glance.
Breakout and Breakdown Alerts:
The alert system is customizable for continuous notifications on critical price levels. When all EMAs align in one direction (green for long, red for short) and the close is above or below VWAP and key EMAs, the indicator confirms a breakout/breakdown.
Adaptable for Different Styles:
Day Trading: Traders can set shorter EMAs for quick insights.
Swing Trading: Longer EMAs combined with CPR offer insights into sustained trends.
Recommended Settings:
Timeframes: MERCURY is suitable for timeframes as low as 5 minutes for intraday traders, up to daily charts for trend analysis.
Symbols: Works across forex, stocks, and crypto. Adjust EMA lengths for asset volatility.
Example Strategy:
Long Entry: When the price crosses above CPR and closes above both EMA1 and EMA2.
Short Entry: When the price falls below CPR with a close below both EMA1 and EMA2.

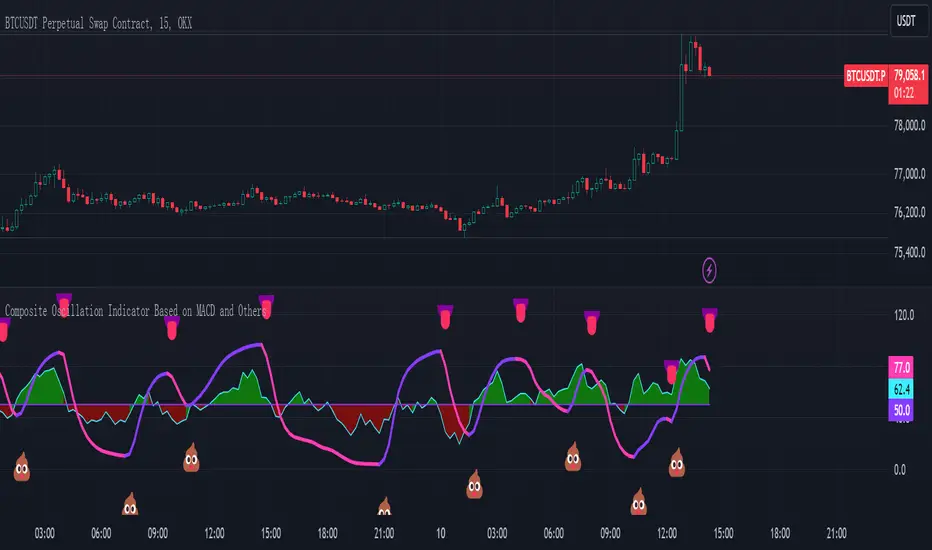
Composite Oscillation Indicator Based on MACD and OthersThis indicator combines various technical analysis tools to create a composite oscillator that aims to capture multiple aspects of market behavior. Here's a breakdown of its components:
* Individual RSIs (xxoo1-xxoo15): The code calculates the RSI (Relative Strength Index) of numerous indicators, including volume-based indicators (NVI, PVI, OBV, etc.), price-based indicators (CCI, CMO, etc.), and moving averages (WMA, ALMA, etc.). It also includes the RSI of the MACD histogram (xxoo14).
* Composite RSI (xxoojht): The individual RSIs are then averaged to create a composite RSI, aiming to provide a more comprehensive view of market momentum and potential turning points.
* MACD Line RSI (xxoo14): The RSI of the MACD histogram incorporates the momentum aspect of the MACD indicator into the composite measure.
* Double EMA (co, coo): The code employs two Exponential Moving Averages (EMAs) of the composite RSI, with different lengths (9 and 18 periods).
* Difference (jo): The difference between the two EMAs (co and coo) is calculated, aiming to capture the rate of change in the composite RSI.
* Smoothed Difference (xxp): The difference (jo) is further smoothed using another EMA (9 periods) to reduce noise and enhance the signal.
* RSI of Smoothed Difference (cco): Finally, the RSI is applied to the smoothed difference (xxp) to create the core output of the indicator.
Market Applications and Trading Strategies:
* Overbought/Oversold: The indicator's central line (plotted at 50) acts as a reference for overbought/oversold conditions. Values above 50 suggest potential overbought zones, while values below 50 indicate oversold zones.
* Crossovers and Divergences: Crossovers of the cco line above or below its previous bar's value can signal potential trend changes. Divergences between the cco line and price action can also provide insights into potential trend reversals.
* Emoji Markers: The code adds emoji markers ("" for bullish and "" for bearish) based on the crossover direction of the cco line. These can provide a quick visual indication of potential trend shifts.
* Colored Fill: The area between the composite RSI line (xxoojht) and the central line (50) is filled with color to visually represent the prevailing market sentiment (green for above 50, red for below 50).
Trading Strategies (Examples):
* Long Entry: Consider a long entry (buying) signal when the cco line crosses above its previous bar's value and the composite RSI (xxoojht) is below 50, suggesting a potential reversal from oversold conditions.
* Short Entry: Conversely, consider a short entry (selling) signal when the cco line crosses below its previous bar's value and the composite RSI (xxoojht) is above 50, suggesting a potential reversal from overbought conditions.
* Confirmation: Always combine the indicator's signals with other technical analysis tools and price action confirmation for better trade validation.
Additional Notes:
* The indicator offers a complex combination of multiple indicators. Consider testing and optimizing the parameters (EMAs, RSI periods) to suit your trading style and market conditions.
* Backtesting with historical data can help assess the indicator's effectiveness and identify potential strengths and weaknesses in different market environments.
* Remember that no single indicator is perfect, and the cco indicator should be used in conjunction with other forms of analysis to make informed trading decisions.
By understanding the logic behind this composite oscillator and its potential applications, you can incorporate it into your trading strategy to potentially identify trends, gauge market sentiment, and generate trading signals.
Confluence StrategyOverview of Confluence Strategy
The Confluence Strategy in trading refers to the combination of multiple technical indicators, support/resistance levels, and chart patterns to identify high-probability trading opportunities. The idea is that when several indicators agree on a price movement, the likelihood of that movement being successful increases.
Key Components
Technical Indicators:
Moving Averages (MA): Commonly used to determine the trend direction. Look for crossovers (e.g., the 50-day MA crossing above the 200-day MA).
Relative Strength Index (RSI): Helps identify overbought or oversold conditions. A reading above 70 may indicate overbought conditions, while below 30 suggests oversold.
MACD (Moving Average Convergence Divergence): Useful for spotting changes in momentum. Look for MACD crossovers and divergence from price.
Support and Resistance Levels:
Identify key levels where price has historically reversed. These can be drawn from previous highs/lows, Fibonacci retracement levels, or psychological price levels.
Chart Patterns:
Patterns like head and shoulders, double tops/bottoms, or flags can indicate potential reversals or continuations in price.
Strategy Implementation
Set Up Your Chart:
Add the desired indicators (e.g., MA, RSI, MACD) to your TradingView chart.
Mark significant support and resistance levels.
Identify Confluence Points:
Look for situations where multiple indicators align. For instance, if the price is near a support level, the RSI is below 30, and the MACD shows bullish divergence, this may signal a buying opportunity.
Entry and Exit Points:
Entry: Place a trade when your confluence conditions are met. Use limit orders for better prices.
Exit: Set profit targets based on resistance levels or use trailing stops. Consider the risk-reward ratio to ensure your trades are favorable.
Risk Management:
Always implement stop-loss orders to protect against unexpected market moves. Position size should reflect your risk tolerance.
Example of a Confluence Trade
Setup:
Price approaches a strong support level.
RSI shows oversold conditions (below 30).
The 50-day MA is about to cross above the 200-day MA (bullish crossover).
Action:
Enter a long position as the conditions align.
Set a stop loss just below the support level and a take profit at the next resistance level.
Conclusion
The Confluence Strategy can significantly enhance trading accuracy by ensuring that multiple indicators support a trade decision. Traders on TradingView can customize their indicators and charts to fit their personal trading styles, making it a flexible approach to technical analysis.

Carlos IndexOverview:
The "Carlos Index" is designed to help traders identify potential buy and sell opportunities by combining an Exponential Moving Average (EMA) with recent high and low levels of price action. This indicator is particularly useful for those looking to spot trend reversals and potential support/resistance zones.
How It Works:
EMA Calculation: The indicator uses a customizable EMA to smooth price data, making it easier to identify the underlying trend. The default length of the EMA is set to 20 periods, but this can be adjusted to suit different trading styles or timeframes.
High and Low Levels: The script plots the highest and lowest prices over the last 8 periods, providing a visual representation of recent market extremes. These levels can act as potential support and resistance areas.
Buy and Sell Signals: The indicator generates buy and sell signals based on the crossover and crossunder of the price and the EMA. A "Buy" signal is generated when the price crosses above the EMA and was higher than the previous period, indicating a potential bullish reversal. Conversely, a "Sell" signal appears when the price crosses below the EMA and was lower than the previous period, suggesting a bearish reversal.
Customization:
Length: The period length for the EMA can be adjusted to better fit the user's trading strategy.
Source: Users can select the price source for the EMA calculation, such as close, open, high, or low prices.
Originality and Usefulness:
The "Carlos Index" combines traditional technical analysis tools in a unique way to enhance traders' decision-making processes. While moving averages and price extremes are commonly used in market analysis, this indicator integrates them to provide a more holistic view of market conditions. The combination of EMA crossovers with recent high and low levels helps identify potential trend reversals and market sentiment changes more effectively.
What sets the "Carlos Index" apart is its dual approach to signal generation: it not only uses EMA crossovers but also considers the immediate price movement relative to the previous period, adding a layer of confirmation to buy and sell signals. This feature aims to reduce false signals and improve the accuracy of market entry and exit points.
Additionally, the customizable settings allow traders to tailor the indicator to their specific trading strategies, making it adaptable across different market environments and timeframes. The clear visual cues provided by the plotted EMA and price levels, along with the buy/sell labels, offer an intuitive understanding of market dynamics, even for those new to technical analysis.
Chart Usage:
This indicator should be used on a clean chart for best visibility.
The plotted lines (EMA, highs, and lows) and signals (Buy/Sell labels) provide a straightforward visual guide for traders.
By using the Carlos Index, traders can gain a clearer understanding of market dynamics and make more informed trading decisions. This script combines both trend-following and mean-reversion elements, making it versatile across various market conditions.

ToxicJ3ster - Day Trading SignalsThis Pine Script™ indicator, "ToxicJ3ster - Signals for Day Trading," is designed to assist traders in identifying key trading signals for day trading. It employs a combination of Moving Averages, RSI, Volume, ATR, ADX, Bollinger Bands, and VWAP to generate buy and sell signals. The script also incorporates multiple timeframe analysis to enhance signal accuracy. It is optimized for use on the 5-minute chart.
Purpose:
This script uniquely combines various technical indicators to create a comprehensive and reliable day trading strategy. Each indicator serves a specific purpose, and their integration is designed to provide multiple layers of confirmation for trading signals, reducing false signals and increasing trading accuracy.
1. Moving Averages: These are used to identify the overall trend direction. By calculating short and long period Moving Averages, the script can detect bullish and bearish crossovers, which are key signals for entering and exiting trades.
2. RSI Filtering: The Relative Strength Index (RSI) helps filter signals by ensuring trades are only taken in favorable market conditions. It detects overbought and oversold levels and trends within the RSI to confirm market momentum.
3. Volume and ATR Conditions: Volume and ATR multipliers are used to identify significant market activity. The script checks for volume spikes and volatility to confirm the strength of trends and avoid false signals.
4. ADX Filtering: The ADX is used to confirm the strength of a trend. By filtering out weak trends, the script focuses on strong and reliable signals, enhancing the accuracy of trade entries and exits.
5. Bollinger Bands: Bollinger Bands provide additional context for the trend and help identify potential reversal points. The script uses Bollinger Bands to avoid false signals and ensure trades are taken in trending markets.
6. Higher Timeframe Analysis: This feature ensures that signals align with broader market trends by using higher timeframe Moving Averages for trend confirmation. It adds a layer of robustness to the signals generated on the 5-minute chart.
7. VWAP Integration: VWAP is used for intraday trading signals. By calculating the VWAP and generating buy and sell signals based on its crossover with the price, the script provides additional confirmation for trade entries.
8. MACD Analysis: The MACD line, signal line, and histogram are calculated to generate additional buy/sell signals. The MACD is used to detect changes in the strength, direction, momentum, and duration of a trend.
9. Alert System: Custom alerts are integrated to notify traders of potential trading opportunities based on the signals generated by the script.
How It Works:
- Trend Detection: The script calculates short and long period Moving Averages and identifies bullish and bearish crossovers to determine the trend direction.
- Signal Filtering: RSI, Volume, ATR, and ADX are used to filter and confirm signals, ensuring trades are taken in strong and favorable market conditions.
- Multiple Timeframe Analysis: The script uses higher timeframe Moving Averages to confirm trends, aligning signals with broader market movements.
- Additional Confirmations: VWAP, MACD, and Bollinger Bands provide multiple layers of confirmation for buy and sell signals, enhancing the reliability of the trading strategy.
Usage:
- Customize the input parameters to suit your trading strategy and preferences.
- Monitor the generated signals and alerts to make informed trading decisions.
- This script is made to work best on the 5-minute chart.
Disclaimer:
This indicator is not perfect and can generate false signals. It is up to the trader to determine how they would like to proceed with their trades. Always conduct thorough research and consider seeking advice from a financial professional before making trading decisions. Use this script at your own risk.

Jobinsabu014This Pine Script code is for an advanced trading indicator that displays enhanced moving averages with buy and sell labels, trend probability, and support/resistance levels. Here’s a detailed description of its components and functionality:
### Description:
1. **Indicator Initialization**:
- The indicator is named "Enhanced Moving Averages with Buy/Sell Labels and Trend Probability" and is set to overlay on the chart.
2. **Input Parameters**:
- **Moving Averages**: Four different moving averages (short and long periods for default and enhanced) with customizable periods.
- **Probability Threshold**: Determines the threshold for trend probability.
- **Support/Resistance Lookback**: Number of bars to look back for calculating support and resistance levels.
- **Signals Valid From**: Timestamp from which the signals are considered valid.
3. **Moving Averages Calculation**:
- **Default Moving Averages**: Calculated using simple moving averages (SMA) for the specified periods.
- **Enhanced Moving Averages**: Calculated using SMAs for different specified periods.
4. **Plotting Moving Averages**:
- Plots the default and enhanced moving averages with different colors for distinction.
5. **Crossover Detection**:
- Detects when the short moving average crosses above or below the long moving average for default moving averages.
6. **Buy/Sell Signal Labels**:
- Adds "BUY" and "SELL" labels on the chart when crossovers are detected after the specified valid timestamp.
- Tracks entry prices for buy/sell signals and adds labels when the price moves +100 points.
7. **Trend Detection for Enhanced Indicator**:
- Detects uptrend or downtrend based on the enhanced moving averages.
- Calculates a simple probability of trend based on price movement and EMA.
- Determines buy and sell signals based on trend conditions and volume-based buy/sell pressure.
8. **Plot Buy/Sell Signals for Enhanced Indicator**:
- Plots buy/sell signals based on the enhanced conditions.
9. **Background Color for Trends**:
- Changes the background color to green for uptrend and red for downtrend.
10. **Trend Lines**:
- Draws imaginary trend lines for uptrend and downtrend based on enhanced moving averages.
11. **Support and Resistance Levels**:
- Calculates and plots support and resistance levels using the specified lookback period.
- Stores and plots previous support and resistance levels with dashed lines.
12. **Expected Trend Labels**:
- Adds labels indicating expected uptrend or downtrend based on buy/sell signals.
13. **Alerts**:
- Sets alert conditions for buy and sell signals, triggering alerts when these conditions are met.
14. **Demand and Supply Zones**:
- Draws and extends horizontal lines for demand (support) and supply (resistance) zones.
### Summary:
This script enhances traditional moving average crossovers by adding trend probability calculations, volume-based pressure, and support/resistance levels. It visualizes expected trends and provides comprehensive buy/sell signals with corresponding labels, background color changes, and alerts to help traders make informed decisions.

On-Balance Accumulation Distribution (Volume-Weighted)The On-Balance Accumulation Distribution (OBAD) indicator is designed to analyze the accumulation and distribution of assets based on volume-weighted price movements. The indicator helps traders identify periods of buying and selling pressure and assess the strength of market trends. By incorporating volume and price data, the OBAD indicator provides valuable insights into the flow of funds in the market.
To calculate the OBAD, the indicator multiplies the volume, price, and volume factor (user-defined) with the price change and aggregates the values over a specified length. This results in a histogram and a line plot representing the OBAD values. The OBAD signal line is derived by applying a simple moving average (SMA) to the OBAD values over a shorter period (9 by default). The crossover of the OBAD line and signal line can indicate potential entry or exit points.
The OBAD indicator utilizes coloration to enhance its visual representation and interpretation. The OBAD background is colored based on the relationship between the OBAD values and the OBAD signal line. When the OBAD values are above the signal line, the background is displayed in lime, suggesting a bullish accumulation scenario. Conversely, when the OBAD values are below the signal line, the background is colored fuchsia, indicating a bearish distribution pattern. The bar coloration is also applied to provide further visual cues, with lime representing bullish conditions and fuchsia denoting bearish conditions. When the OBAD signal line is above 0, it is colored green. Conversely, if the signal line is below 0, it is colored maroon.
The length parameter in the OBAD indicator determines the number of periods used in the calculation. Shorter lengths, such as 10 or 20, can make the indicator more responsive to recent price and volume changes, providing quicker signals. This can be beneficial for short-term traders or in fast-paced markets. Conversely, longer lengths, such as 50 or 100, smooth out the indicator and provide a broader view of accumulation and distribution over a more extended period. This may suit longer-term traders or when analyzing trends in less volatile markets. Traders should experiment with different lengths to find the optimal balance between responsiveness and smoothness that aligns with their trading goals.
The volume factor parameter allows traders to adjust the weighting of volume in the OBAD calculation. By modifying this factor, traders can emphasize the impact of volume on the indicator. Increasing the volume factor amplifies the influence of volume in the OBAD calculation, making it more sensitive to volume changes. This can be advantageous when volume is considered a significant driver of price movements, such as during news events or market catalysts. On the other hand, decreasing the volume factor reduces the impact of volume, making the indicator less sensitive to volume fluctuations. Traders can experiment with different volume factors to align the indicator's responsiveness with their analysis of volume patterns and its importance in their trading decisions.
The signal line period parameter determines the number of periods used to calculate the moving average of the OBAD values. Adjusting this parameter can help smooth out the indicator and filter out short-term noise or provide more timely signals. A shorter signal line period, such as 5 or 7, provides more sensitive and frequent crossovers with the OBAD values, potentially offering early entry or exit signals. This can be useful for traders seeking shorter-term trades or more agile trading strategies. Conversely, a longer signal line period, such as 9 or 14, smooths out the indicator and provides more stable signals. This may suit traders who prefer longer-term trends or a more conservative approach. Traders should consider their trading timeframe and the desired balance between responsiveness and stability when adjusting the signal line period.
The OBAD indicator can be applied in various trading strategies and scenarios. It helps traders identify potential trend reversals, confirm existing trends, and generate entry and exit signals. For example, when the OBAD histogram transitions from fuchsia to lime, it may suggest a shift from selling to buying pressure, signaling a potential buying opportunity. Traders can also use the OBAD indicator in conjunction with other technical analysis tools, such as trendlines or support/resistance levels, to confirm signals and make more informed trading decisions.
-- Trend Reversal Identification : The OBAD indicator can be useful in identifying potential trend reversals. When the OBAD values cross above the signal line after being below it, it may suggest a shift from bearish distribution to bullish accumulation. Conversely, when the OBAD values cross below the signal line after being above it, it may indicate a transition from bullish accumulation to bearish distribution. Traders can use these crossovers as potential signals to enter or exit trades in anticipation of a trend reversal.
-- Confirmation of Trend Strength : The OBAD indicator can act as a confirmation tool for assessing the strength of existing trends. When the OBAD values remain consistently above the signal line, it confirms the presence of strong bullish accumulation and validates the upward trend. Similarly, when the OBAD values stay consistently below the signal line, it confirms the presence of strong bearish distribution and validates the downward trend. Traders can use this confirmation to have more confidence in the prevailing trend and adjust their trading strategies accordingly.
-- Divergence Analysis : Divergence between the price and the OBAD indicator can provide valuable insights. Bullish divergence occurs when the price forms lower lows while the OBAD indicator forms higher lows, suggesting a potential trend reversal to the upside. Conversely, bearish divergence occurs when the price forms higher highs while the OBAD indicator forms lower highs, indicating a potential trend reversal to the downside. Traders can use these divergences as additional confirmation signals in their trading decisions.
-- Volume Analysis : The OBAD indicator incorporates volume data, making it particularly useful for volume analysis. Traders can analyze the relationship between OBAD values and volume levels to gauge the strength and validity of price movements. Higher OBAD values accompanied by higher volume can indicate strong accumulation or distribution, providing confirmation for potential trade setups. On the other hand, lower OBAD values accompanied by low volume may suggest a lack of participation and potentially signal caution in trading decisions.
It is important to note that the OBAD indicator, like any other technical indicator, has certain limitations. It relies on historical price and volume data, which may not always accurately reflect current market conditions or future price movements. Traders should exercise caution and use the OBAD indicator in conjunction with other analysis techniques and risk management strategies. Additionally, customization of the OBAD parameters, such as adjusting the length or volume factor, can provide flexibility to adapt the indicator to different market conditions and trading preferences.
Overall, the OBAD indicator serves as a valuable tool for traders to gauge the accumulation and distribution patterns in the market. Its calculation based on volume-weighted price movements and the coloration enhancements make it visually appealing and intuitive to interpret. By incorporating the OBAD indicator into trading strategies and considering its limitations, traders can potentially improve their decision-making process and enhance their trading outcomes.

True Strength Indicator + Realtime DivergencesTrue Strength Indicator (TSI) + Realtime Divergences + Alerts + Lookback periods.
This version of the True Strength Indicator adds the following 5 additional features to the stock TSI by Tradingview:
- Optional divergence lines drawn directly onto the oscillator in realtime.
- Configurable alerts to notify you when divergences occur, as well as when the TSI and lagline bands crossover one another, when the oscillator begins heading up, or heading down.
- Configurable lookback periods to fine tune the divergences drawn in order to suit different trading styles and timeframes.
- Background colouring option to indicate when the two TSI bands, the TSI line and the TSI lagline, have crossed one another, either moving upwards or downwards, or optionally when the two TSI bands have crossed upwards and an external oscillator, which can be linked via the settings, has crossed above its centerline, and the TSI bands have crossed downwards and the external oscillator has crossed below its centerline.
- Alternate timeframe feature allows you to configure the oscillator to use data from a different timeframe than the chart it is loaded on.
This indicator adds additional features onto the stock TSI by Tradingview, whose core calculations remain unchanged, although this version has different settings as default to suit a shorter time period (it uses 6, 13, 4 by default, whereas the stock TSI typically ships with higher values, e.g. 25, 13, 13). Namely the configurable option to automatically, quickly and clearly draw divergence lines onto the oscillator for you as they occur in realtime. It also has the addition of unique alerts, so you can be notified when divergences occur without spending all day watching the charts. Furthermore, this version of the TSI comes with configurable lookback periods, which can be configured in order to adjust the sensitivity of the divergences, in order to suit shorter or higher timeframe trading approaches.
The True Strength Indicator
Tradingview describes the True Strength Indicator as follows:
“The True Strength Index (TSI) is a momentum oscillator that ranges between limits of -100 and +100 and has a base value of 0. Momentum is positive when the oscillator is positive (pointing to a bullish market bias) and vice versa. It was developed by William Blau and consists of 2 lines: the index line and an exponential moving average of the TSI, called the signal line. Traders may look for any of the following 5 types of conditions: overbought, oversold, centerline crossover, divergence and signal line crossover. The indicator is often used in combination with other signals..”
What are divergences?
Divergence is when the price of an asset is moving in the opposite direction of a technical indicator, such as an oscillator, or is moving contrary to other data. Divergence warns that the current price trend may be weakening, and in some cases may lead to the price changing direction.
There are 4 main types of divergence, which are split into 2 categories;
regular divergences and hidden divergences. Regular divergences indicate possible trend reversals, and hidden divergences indicate possible trend continuation.
Regular bullish divergence: An indication of a potential trend reversal, from the current downtrend, to an uptrend.
Regular bearish divergence: An indication of a potential trend reversal, from the current uptrend, to a downtrend.
Hidden bullish divergence: An indication of a potential uptrend continuation.
Hidden bearish divergence: An indication of a potential downtrend continuation.
Setting alerts.
With this indicator you can set alerts to notify you when any/all of the above types of divergences occur, on any chart timeframe you choose.
Configurable lookback values.
You can adjust the default lookback values to suit your prefered trading style and timeframe. If you like to trade a shorter time frame, lowering the default lookback values will make the divergences drawn more sensitive to short term price action.
How do traders use divergences in their trading?
A divergence is considered a leading indicator in technical analysis , meaning it has the ability to indicate a potential price move in the short term future.
Hidden bullish and hidden bearish divergences, which indicate a potential continuation of the current trend are sometimes considered a good place for traders to begin, since trend continuation occurs more frequently than reversals, or trend changes.
When trading regular bullish divergences and regular bearish divergences, which are indications of a trend reversal, the probability of it doing so may increase when these occur at a strong support or resistance level . A common mistake new traders make is to get into a regular divergence trade too early, assuming it will immediately reverse, but these can continue to form for some time before the trend eventually changes, by using forms of support or resistance as an added confluence, such as when price reaches a moving average, the success rate when trading these patterns may increase.
Typically, traders will manually draw lines across the swing highs and swing lows of both the price chart and the oscillator to see whether they appear to present a divergence, this indicator will draw them for you, quickly and clearly, and can notify you when they occur.
Disclaimer: This script includes code from the stock TSI by Tradingview as well as the Divergence for Many Indicators v4 by LonesomeTheBlue
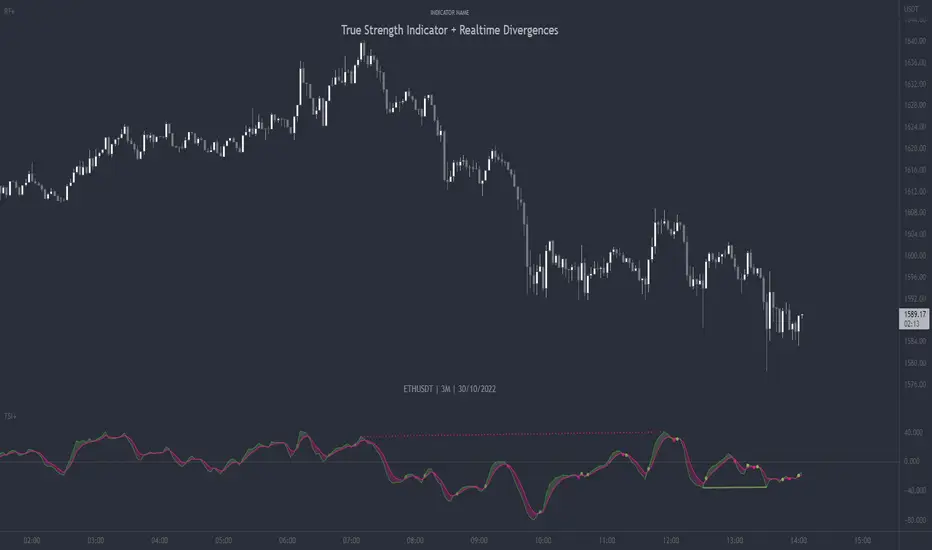
CCMA - Count Condition MA (560 Indicators In One) Do you like using moving averages?
Why do you think a pair of moving averages on a chart will help you?
What is the probability that once two moving averages have crossed, you will successfully enter the trade?
So why not use 100+ moving averages at once to increase the probability of a successful trade?
And all this can be seen in a single oscillator as a histogram!
I want to introduce you to a system that takes into account 560 moving averages movements. And that's just for a second, 560 potential indicators.
Specifically:
- 22 types of MA (EMA, SMA, RMA and others).
- 176 moving averages.
- 310 crossover checks.
- 252 checks of trend following.
The indicator makes the most of the opportunities provided by television. Therefore, it can take a long time to load it.
How does it work ?
In general, the indicator counts the number of fulfilled conditions.
It checks if MA #1 and MA #2 have crossed. If so, it adds +1 to the statistics. It also checks if price is above or below the moving average. There are a total of 560 such checks. (This is about the maximum the TV allowed me).
The default is 8 lengths of moving averages, I took the Fibonacci numbers thinking they were the optimal solution. You can take any of your favorites.
If the "Ratio MOD" feature is on. Then you can see how many MAs are showing signals to enter a long or short position.
You can also see the indication at the bottom as dots. They show which signals are longer/shorter. If the number of signals is the same, the dot will be yellow. The first line of dots counts the number of crossings. The second line counts the number of crossovers + checks whether the price is above or below the average slippage.
If the "Differ MOD" function is enabled. Then you can see the difference between long and short signals. With the same indication as in RATIO MOD.
If "Show all" is on, then the bar graph shows all 560 accounting options. If it is off, only the number of crossovers is displayed. (This does not apply to the display as points)
If the script shows an error, try to change the timeframe and go back. Or add it again.
You can also disable the histogram in the stats settings and leave only the points that help in determining the trend.
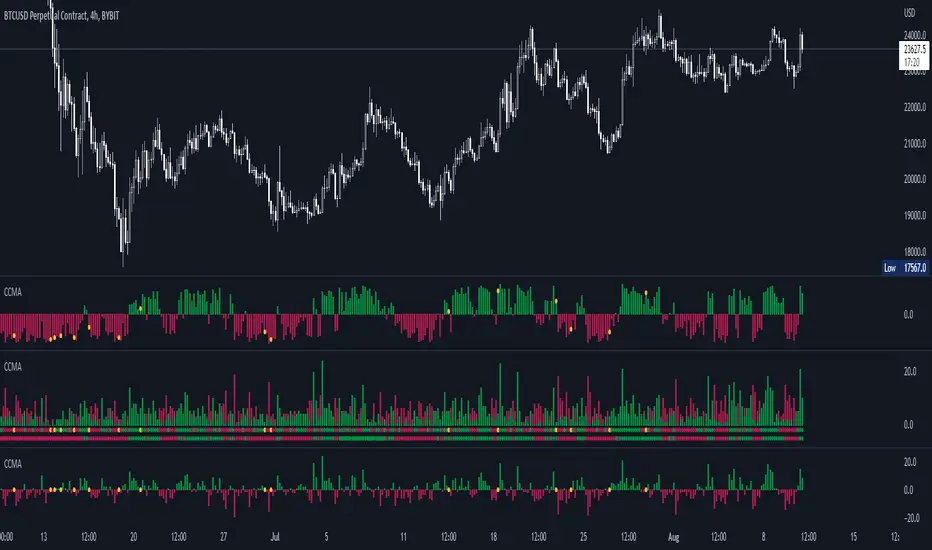
Oscillators Overlay w/ Divergencies/Alerts by DGTAn oscillator is a technical analysis tool that, simply said, gauge momentum, determine market trend direction and duration. For some oscillators, fluctuations are bounded by some upper and lower band, and traders use them to discover short-term overbought or oversold conditions.
Oscillators are often combined with moving average indicators to signal trend breakouts or reversals
Histogram, is the difference between the oscillator and signal lines, which oscillates above and below a center line and is used as a good indication of an asset's momentum
What to look for
- Signal Line Crossover is the most common signal produced by the oscillators
- Zero Line Crossovers have a very similar premise to Signal Line Crossovers
- Divergence , when the oscillator and actual price are not in agreement, is another signal created by the oscillators
- Overbought and Oversold , with any range-bound oscillator, conditions are a primary signal generated
Oscillators Overlay study
* Presents oscillators on top of the mian chart (price chart)
* A single indicator for many well known and custom oscillators
* Divergence detection
* Alerts for various condtions
The list of oscillators included;
- Awesome Oscillator (AO)
- Chaikin Oscillator (Chaikin Osc)
- Commodity Channel Index (CCI)
- Distance Oscillator
- Elder-Ray Bear and Bull Power
- Elliott Wave Oscillator (EWO)
- Klinger Oscillator
- Money Flow Index (MFI)
- Moving Average Convergence Divergence (MACD)
- Rate Of Change (ROC)
- Relative Strength Index (RSI)
- Stochastic (Stoch)
- Stochastic RSI (Stoch RSI)
- Volume Oscillator (Volume Osc)
- Wave Trend
In technical analysis, investors find oscillators to be important technical tools and consider them more effective when used in conjunction with other means of technical analysis
Disclaimer : Trading success is all about following your trading strategy and the indicators should fit within your trading strategy, and not to be traded upon solely
The script is for informational and educational purposes only. Use of the script does not constitutes professional and/or financial advice. You alone the sole responsibility of evaluating the script output and risks associated with the use of the script. In exchange for using the script, you agree not to hold dgtrd TradingView user liable for any possible claim for damages arising from any decision you make based on use of the script

DC Breakout Strategy | This is simplicity at its finest.As the title already describes: this is a Donchian breakout strategy. This strategy, as of now, only goes long. It goes long when the price close makes a new high and the 8 day moving average is above the 32 day moving average. The strategy exits the trade if the price breaks the atr trailing stop of * 3 or the 8 day moving average crosses below the 32 day moving average.
This is simplicity at its finest.
