SMA & EMA Simple CrossoverTracks and highlights trends by using a simple SMA and EMA indicator. When a shorter SMA (default set to 10 periods) and a longer EMA (default set to 20 periods) cross over, a cross is placed upon the chart at the crossover point. Defaults settings for the periods and colours can be changed the user to meet their own preferences using the settings button (i.e. without having to edit the script).
In den Scripts nach "crossover债券是什么" suchen

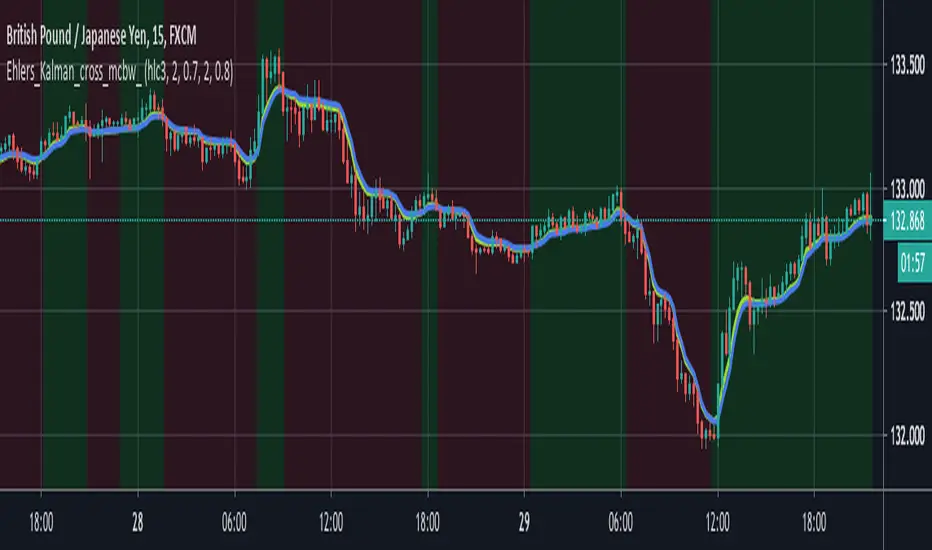
powerful moving average crossoverThis script is a simplified version of John Ehlers's adaption of Dr. Kalman's optimum estimator as applied to price action (More can be found on this here: www.dimensionetrading.com). Here I have adapted two of these optimum estimators to work together to provide crossover signals. The user can choose the input of this filter in the 'input source'. The 'Ratio of Uncertainties' controls how adaptive the moving averages are, increasing this number will increase adaptivity and vice versa for decreasing. The 'Kalman Gain' allows the user to choose how much error to let into the calculation. The smaller this number is the quicker the moving average will approach price action.
In practice this indicator is much smoother than most other moving averages and has significantly less whiplash while still getting very early entries. If anyone wants to adapt this script for their own uses please feel free. Message me what you make with it, I am very curious what this can do when in the right hands!
Happy trading!
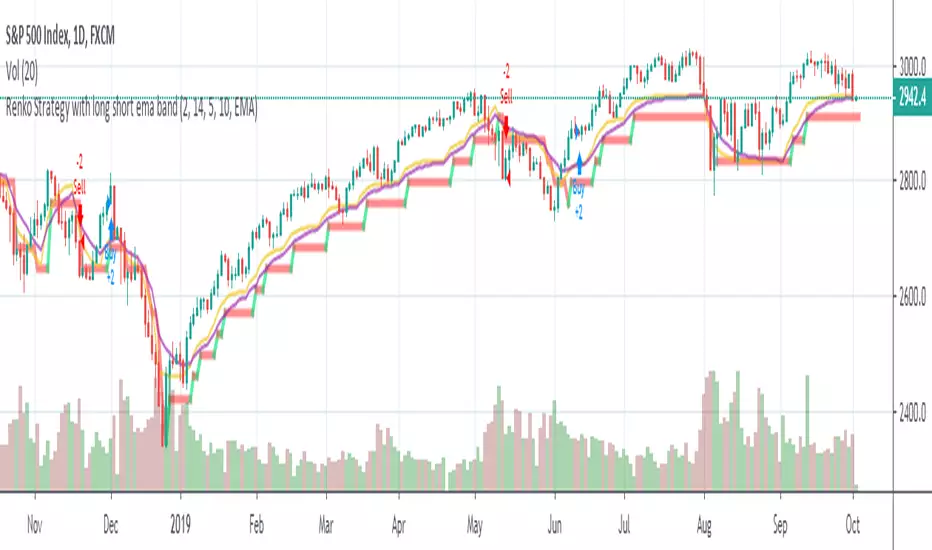
Renko Strategy with Ema against price crossover/underRenko Strategy with Ema against price crossover/under

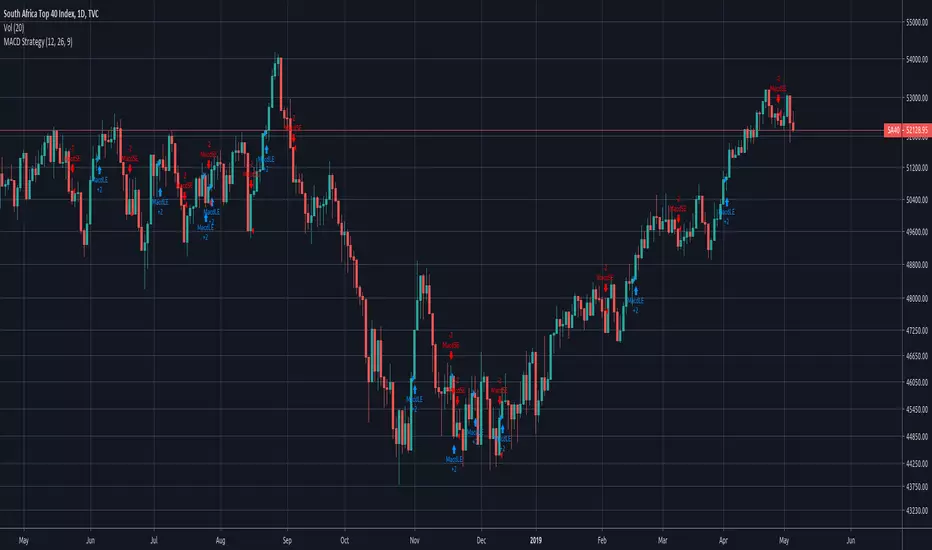
Simple MACD Strategy - CrossoverSimple MACD Crossover Strategy
No secret sauce here!
Script was requested by user
Moving Average Shaded Fill Area Crossover EMA Color - EditableMoving Average Shaded Fill Area Crossover EMA Color with option to change EMA value

Volume + Ema CrossoverIf Volume crossover its ema, we can consider it as a volume pump.
It may be useful for combining with other indicators.


SMA EMA HMA VWMA Crossover Strategy with MA Turning Point ExitsThis version adds HMA and VWMA, allowing you to backtest different crossover strategies for any combination, with the exits on the turning point of the faster MA. Due to order limitations this will only work on higher timeframes for some combinations, or on more recent exchanges with less history. You can edit the code though to add the timestamp to a recent date.


Intraday - Exponential Moving Average 3 CrossOverA Simple EMA crossover strategy for intraday traders.
A Buy signal is triggered when a green arrow is followed by a blue arrow.
A Sell signal is triggered when a red arrow is followed by a purple arrow.
To remove false positives, combine this with other indicators.


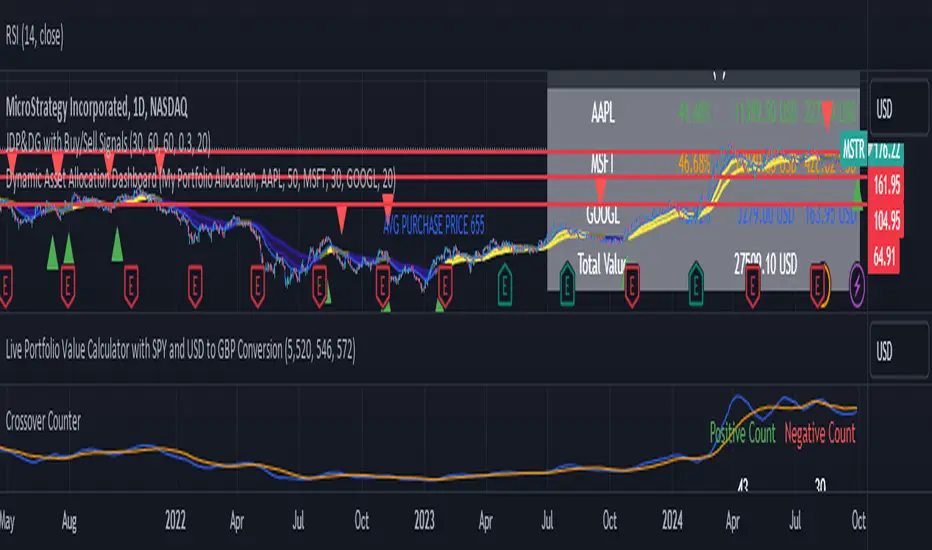
Crossover CounterExplanation:
Crossover Detection: We detect the crossover of the 20-period and 50-period moving averages using ta.crossover().
Tracking Price Movement: After the crossover, we start tracking the price to check if it moves up or down by 2%. If an up movement occurs before a down movement, we increment the positive counter. If a down movement occurs first, we increment the negative counter.
Reset Condition: Once either a 2% up or down move is detected, we stop tracking until the next crossover.
Table Display: A table shows the counts of positive and negative events.
Crossover Alerts for Yesterday O/H/L/C , Today Vwap [Zero54]This is a very simple script/indicator that trigger alerts every time the script triggers the following conditions.
1) Script crosses yesterday's (previous day's) high
2) Script crosses yesterday's (previous day's) low
3) Script crosses yesterday's (previous day's) open
4) Script crosses yesterday's (previous day's) close
5) Script crosses today's vwap.
I developed this to keep track of the scripts I follow and I find it useful. Hope you will find it useful too.
Steps to use:
1) Open the ticker for which you want to set the alerts.
2) Add this indicator to the chart.
3) Right Click on the text and set choose "Add Alert"
4) After you have done with setting up the alert, feel free to remove the indicator from the chart. It is not necessary for the indicator to be added in the chart in order for it to work.
5) Repeat 1-4 for all the scripts for which you want to set the alerts.
Be advised: During market open, if you have set alerts for multiple scripts, a tsunami of alerts may be triggered.
If you like this alert indicator, please like/boost it. Feel free to re-use this code however you may wish to. Cheers!

Directional Indicator Crossovers [JopAlgo]Directional Indicator Crossovers — read trend intent at a glance, on any timeframe
Most traders ask two questions before they click: who’s in control right now and is control getting stronger or weaker?
The Directional Indicator (DI) answers the first one cleanly. +DI tracks upward directional movement; –DI tracks downward directional movement. When +DI crosses above –DI, buyers have the initiative; when –DI crosses above +DI, sellers do. DI Xover focuses on that simple, tradeable signal—the crossover—and keeps the pane uncluttered so you can layer it with your location/flow tools.
(If you add screenshots: image #1 can label +DI, –DI and a bullish crossover; image #2 can show a failed crossover in chop next to a successful one at a strong level.)
What you’re seeing (and how it’s built)
This indicator plots two lines in a separate pane:
+DI (green): smoothed positive directional movement.
–DI (red): smoothed negative directional movement.
Under the hood (length = 14 by default):
It measures how much today’s high exceeded yesterday’s high (up move) and how much today’s low fell below yesterday’s low (down move).
It keeps only the dominant side each bar (if up > down and up > 0 → up counts; vice-versa for down).
It normalizes by True Range (so moves are scaled by volatility) and smooths with RMA (so you don’t get jitter).
It raises alerts when +DI crosses above –DI (bullish) or –DI crosses above +DI (bearish).
How to read it, fast:
Cross up = buyers just took initiative.
Cross down = sellers just took initiative.
Wider distance between the lines = stronger control.
Lines braided/tight = balance/chop → expect more fake crosses.
DI is about directional control. It doesn’t tell you where to trade—that’s your location (e.g., Volume Profile, AVWAP). Use DI as a timing/confirmation layer, not as a standalone level generator.
Using DI Crossovers on any timeframe
The framework doesn’t change; only your expectations do as you zoom.
Scalping (1–5m)
Treat crossovers as triggers at levels. If price is tagging VAL/VAH/LVN (from Volume Profile v3.2) or Anchored VWAP, a fresh +DI cross up is your green light for a quick long; –DI cross up flips that logic for shorts.
Avoid taking every crossover mid-range—wait for location first.
In fast tape, require the lines to separate for 1–2 bars after the cross before you click.
Intraday (15m–1H)
In trend days, the first pullback into your level (POC/VA boundary/AVWAP) that prints a fresh +DI cross up is often the cleanest add/entry.
In balance days, fade DI crosses at edges back to POC—only if your flow tool isn’t screaming absorption against you.
Swing (2H–4H)
Look for confluence: at Weekly AVWAP or composite VAL/VAH, a DI crossover that stays separated for several bars is a solid momentum confirmation.
Failed crossover (lines recross quickly) near a level is a useful fail signal—expect a move back into value.
Position (1D–1W)
Use fewer, bigger signals: a weekly DI cross at Monthly/Quarterly AVWAP or at composite value edges marks a regime change.
Add on pullbacks when the controlling DI stays dominant (distance holds or widens).
Entries, exits, and risk (simple rules)
Entry (with level): wait for price to reach your level (e.g., VAL/VAH or AVWAP), then take the trade with the DI cross in that direction.
Filter: skip crosses when the two lines are braided (tiny separation) unless you’re trading a tight scalp with strict risk.
Exit / reduce: if your trade was based on a bullish cross, consider reducing when –DI recaptures +DI or the lines flatten at your target HVN/POC.
Stops: put them beyond the level (not just on a DI recross), but treat a fast recross as a warning to tighten.
Settings that actually matter (and how to tune them)
DI Length (default 14):
Shorter (7–10) = faster signals, more noise (good for scalps with filters).
Longer (20–30) = fewer but stronger signals (good for swing/position).
If you often see flip-flops, lengthen the setting or take crosses only at VP/AVWAP levels.
Pro tip: Define a minimum separation rule for yourself (e.g., after a cross, require the gap between +DI and –DI to increase on the next bar). You don’t need extra code for this—just enforce it visually.
What to look for (pattern cheatsheet)
Cross + hold at a level: The lines cross at your level and keep separating → high-quality entry in that direction.
Sneaky fail: Cross, then immediate recross back → treat it as a fade signal back into value (especially near VAH/VAL).
Strength confirmation: After a breakout, +DI stays above –DI on pullbacks → trend is healthy; buy dips at AVWAP/POC.
Pre-move tell: DI lines unbraid and begin diverging before price leaves a range; wait for location + trigger.
Combining DI Xover with other tools
Cumulative Volume Delta v1 (CVDv1):
Use DI for direction, and CVDv1 for quality. A bullish DI cross with ALIGN OK + Imbalance strong + no Absorption is a far better long than DI alone.
If DI crosses up but CVDv1 flags Absorption (red), don’t chase—look for the fail/reclaim instead.
Volume Profile v3.2 :
Let VP choose the battleground (POC/VAH/VAL/LVNs). Take the DI crossover at those references.
Classic: bearish DI cross at VAH → fade toward POC; bullish DI cross at VAL → rotate to POC—assuming CVDv1 isn’t vetoing with Absorption.
Anchored VWAP :
Treat reclaims/rejections of AVWAP as the location and DI cross as the trigger.
Example: price reclaims Weekly AVWAP, then on the next pullback, a +DI cross up confirms the add.
Common pitfalls this helps you avoid
Trading crosses in the middle of nowhere. DI is a trigger, not a level; wait for VP/AVWAP.
Chasing every wiggle. When the lines are braided, you’re likely in balance—expect fake crosses.
Ignoring flow. A DI cross against CVDv1 Absorption is often a trap; quality > quantity.
Practical defaults to start with
Length: 14
Timeframes: Works out of the box on 15m–4H. For 1–5m scalps try 10–12; for daily/weekly swings try 20–30.
Process: Only act on crosses at levels (VP v3.2 / Anchored VWAP), and prefer those where CVDv1 says ALIGN OK and no Absorption.
Alerts (what they tell you)
Bullish DI Crossover: +DI crossed above –DI → buyers just took initiative. Look to your chart for location and CVDv1 quality before entering.
Bearish DI Crossover: –DI crossed above +DI → sellers took initiative. Same rule: confirm at a level with flow.
Open source & disclaimer
This indicator is published open source so traders can learn, adapt, and build rules they trust. No tool guarantees outcomes; risk management remains essential.
Disclaimer — Not Financial Advice.
The “Directional Indicator Crossovers ” indicator and this description are provided for educational purposes only and do not constitute financial or investment advice. Trading involves risk, including possible loss of capital. makes no warranties and assumes no responsibility for any trading decisions or outcomes resulting from the use of this script. Past performance is not indicative of future results.

Multiple SMA, EMA, and VWAP CrossoversMultiple SMA, EMA, and VWAP Crossovers with Alerts
Overview : The "Multiple SMA, EMA, and VWAP Crossovers" script is designed for traders who want to monitor various simple moving averages (SMAs), exponential moving averages (EMAs), and the volume-weighted average price (VWAP) to identify potential buy and sell opportunities. This script allows you to visualize key moving averages on your chart and create custom alerts for specific crossover events.
Detail s: This script plots the following moving averages:
Simple Moving Averages (SMA): 5, 10, 20, 50, 100, 200, and 325 periods
Exponential Moving Average (EMA): 9 periods
Volume-Weighted Average Price (VWAP)
It includes options to display these moving averages and set alerts for their crossovers.
Available Crossovers:
20/50 SMA, 20/100 SMA, 20/200 SMA, 20/325 SMA
50/100 SMA, 50/200 SMA, 50/325 SMA
100/200 SMA, 100/325 SMA
200/325 SMA
VWAP/20 SMA, VWAP/50 SMA, VWAP/100 SMA, VWAP/200 SMA, VWAP/325 SMA
Optional Lines to Add to the Chart:
9 EMA, 5 SMA, 10 SMA, 20 SMA, 50 SMA, 100 SMA, 200 SMA, 325 SMA, VWAP
How to Use:
Enable Indicators: Use the input options to select which SMAs, EMA, and VWAP you want to display on your chart.
Set Alerts: Choose the specific crossover events you want to monitor. For example, you can set an alert for the 20/50 SMA crossover or the VWAP/100 SMA crossover.
Monitor the Chart: The script will plot the selected moving averages on your chart. When a selected crossover event occurs, an alert will be triggered, notifying you of the potential trade opportunity.
Usage Tips:
Trending Market: Use the buy and sell alerts in trending markets where the moving averages can help confirm the direction of the trend.
Key Support and Resistance Levels: Combine crossover alerts with key support and resistance levels for more reliable trading signals.
Volume Confirmation: Ensure there is sufficient volume to support the crossover signals, indicating stronger momentum behind the move.
When NOT to Use Buy and Sell Alerts:
Low Volume: Avoid using buy and sell alerts during periods of low trading volume, as the signals may be less reliable.
Market Noise: Be cautious in highly volatile markets where frequent crossovers might generate false signals.
Sideways Market: In a sideways or range-bound market, crossover signals can result in multiple whipsaws, leading to potential losses.
Why Use This Script? This script provides a comprehensive tool for traders to monitor multiple moving averages and VWAP crossovers efficiently. It allows you to customize alerts based on your trading strategy and helps you make informed decisions by visualizing key technical indicators on your chart.
Legal Disclaimer: The information provided by this script is for educational and informational purposes only and should not be considered financial advice. The developer of this script is not responsible for any financial losses incurred from using this script.

[GrandAlgo] Moving Averages Cross LevelsMoving Averages Cross Levels
Many traders watch for moving average crossovers – such as the golden cross (50 MA crossing above 200 MA) or death cross – as signals of changing trends. However, once a crossover happens, the exact price level where it occurred often fades from view, even though that level can be an important reference point. Moving Averages Cross Levels is an indicator that keeps those crossover price levels visible on your chart, helping you track where momentum shifts occurred and how price behaves relative to those key levels.
This tool plots horizontal line segments at the price where each pair of selected moving averages crossed within a recent window of bars. Each level is labeled with the moving average lengths (for example, “21×50” for a 21/50 MA cross) and is color-coded – green for bullish crossovers (short-term MA crossing above long-term MA) and red for bearish crossunders (short-term crossing below). By visualizing these crossover levels, you can quickly identify past trend change points and use them as potential support/resistance or decision levels in your trading. Importantly, this indicator is non-repainting – once a crossover level is plotted, it remains fixed at the historical price where the cross occurred, allowing you to continually monitor that level going forward. (As with any moving average-based analysis, crossover signals are lagging, so use these levels in conjunction with other tools for confirmation.)
Key Features:
✅ Multiple Moving Averages: Track up to 7 different MAs (e.g. 5, 8, 21, 50, 64, 83, 200 by default) simultaneously. You can enable/disable each MA and set its length, allowing flexible combinations of short-term and long-term averages.
✅ Selectable MA Type: Each average can be calculated as a Simple (SMA), Exponential (EMA), Volume-Weighted (VWMA), or Smoothed (RMA) moving average, giving you flexibility to match your preferred method.
✅ Auto Crossover Detection: The script automatically detects all crosses between any enabled MA pairs, so you don’t have to specify pairs manually. Whether it’s a fast cross (5×8) or a long-term cross (50×200), every crossover within the lookback period will be identified and marked.
✅ Horizontal Level Markers: For each detected crossover, a horizontal line segment is drawn at the exact price where the crossover occurred. This makes it easy to glance at your chart and see precisely where two moving averages intersected in the recent past.
✅ Labeled and Color-Coded: Each crossover line is labeled with the two MA lengths that crossed (e.g. “50×200”) for clear identification. Colors indicate crossover direction – by default green for bullish (positive) crossovers and red for bearish (negative) crossovers – so you can tell at a glance which way the trend shifted. (You can customize these colors in the settings.)
✅ Adjustable Lookback: A “Crosses with X candles” input lets you control how far back the script looks for crossovers to plot. This prevents your chart from getting cluttered with too many old levels – for example, set X = 100 to show crossovers from roughly the last 100 bars. Older crossover lines beyond this lookback window will automatically clear off the chart.
✅ Optional MA Plots: You can toggle the display of each moving average line on the chart. This means you can either view just the crossover levels alone for a clean look, or also overlay the MA curves themselves for additional context (to see how price and MAs were moving around the crossover).
✅ No Repainting or Hindsight Bias: Once a crossover level is plotted, it stays at that fixed price. The indicator doesn’t move levels around after the fact – each line is a true historical event marker. This allows you to backtest visually: see how price acted after the crossover by observing if it retested or respected that level later.
How It Works:
1️⃣ Add to Chart & Configure – Simply add the indicator to your chart. In the settings, choose which moving averages you want to include and set their lengths. For example, you might enable 21, 50, 200 to focus on medium and long-term crosses (including the golden cross), or turn on shorter MAs like 5 and 8 for quick momentum shifts. Adjust the lookback (number of bars to scan for crosses) if needed.
2️⃣ Visualization – The script continuously checks the latest X bars for any points where one MA crossed above or below another. Whenever a crossover is found, it calculates the exact price level at which the two moving averages intersected. On the last bar of your chart, it will draw a horizontal line segment extending from the crossover bar to the current bar at that price level, and place a label to the right of the line with the MA lengths. Green lines/labels signify bullish crossovers (where the first MA crossed above the second), and red lines indicate bearish crossunders.
3️⃣ On Your Chart – You will see these labeled levels aligned with the price scale. For example, if a 50 MA crossed above a 200 MA (bullish) 50 bars ago at price $100, there will be a green “50×200” line at $100 extending to the present, showing you exactly where that golden cross happened. You might notice price pulling back near that level and bouncing, or if price falls back through it, it could signal a failed crossover. The indicator updates in real-time: if a new crossover happens on the latest bar, a new line and label will instantly appear, and if any old cross moves out of the lookback range, its line is removed to keep the chart focused.
4️⃣ Customization – You can fine-tune the appearance: toggle any MA’s visibility, change line colors or label styles, and modify the lookback length to suit different timeframes. For instance, on a 1-hour chart you might use a lookback of 500 bars to see a few weeks of cross history, whereas on a daily chart 100 bars (about 4–5 months) may be sufficient. Adjust these settings based on how many crossover levels you find useful to display.
Ideal for Traders Who:
Use MA Crossovers in Strategy: If your strategy involves moving average crossovers (for trend confirmation or entry/exit signals), this indicator provides an extra layer of insight by keeping the price of those crossover events in sight. For example, trend-followers can watch if price stays above a bullish crossover level as a sign of trend strength, or falls below it as a sign of weakness.
Identify Support/Resistance from MA Events: Crossover levels often coincide with pivot points in market sentiment. A crossover can act like a regime change – the level where it happened may turn into support or resistance. This tool helps you mark those potential S/R levels automatically. Rather than manually noting where a golden cross occurred, you’ll have it highlighted, which can be useful for setting stop-losses (e.g. below the crossover price in a bullish scenario) or profit targets.
Track Multiple Averages at Once: Instead of focusing on just one pair of moving averages, you might be interested in the interaction of several (short, medium, and long-term trends). This indicator caters to that by plotting all relevant crossovers among your chosen MAs. It’s great for multi-timeframe thinkers as well – e.g. you could apply it on a higher timeframe chart to mark major cross levels, then drill down to lower timeframes knowing those key prices.
Value Clean Visualization: There are no flashing signals or arrows – just simple lines and labels that enhance your chart’s storytelling. It’s ideal if you prefer to make trading decisions based on understanding price interaction with technical levels rather than following automatic trade calls. Moving Averages Cross Levels gives you information to act on, without imposing any bias or strategy – you interpret the crossover levels in the context of your own trading system.

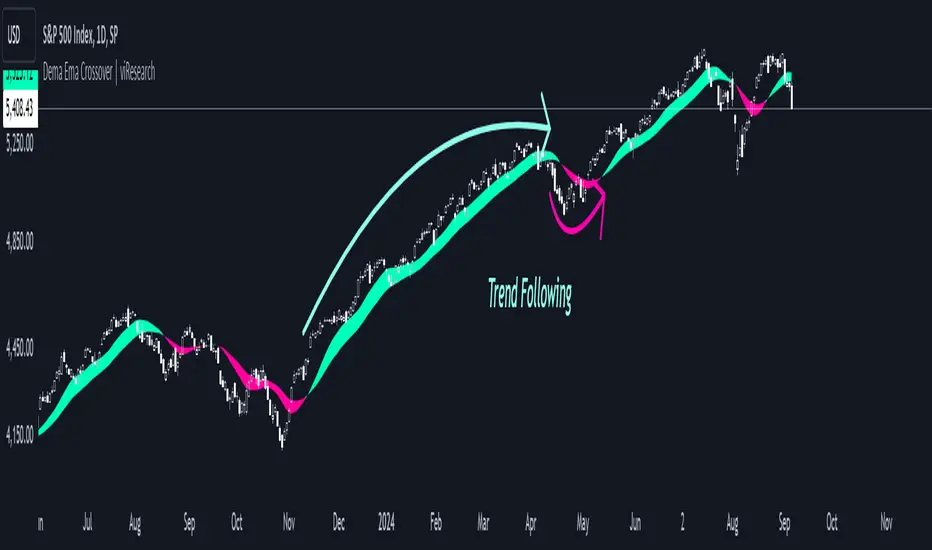
Dema Ema Crossover | viResearchDema Ema Crossover | viResearch
Conceptual Foundation and Innovation
The "Dema Ema Crossover" indicator combines the strengths of the Double Exponential Moving Average (DEMA) with an Exponential Moving Average (EMA) crossover strategy. The DEMA is well-known for its ability to reduce lag compared to standard moving averages, offering smoother trend-following signals. In this script, the DEMA is used as the foundation, with two EMAs applied on top of it to further refine the trend detection and crossover points. This combination provides traders with a robust tool for identifying trend shifts and potential entry or exit points.
By leveraging the faster responsiveness of the DEMA and using EMA crossovers, the "Dema Ema Crossover" indicator helps traders detect and act on trend reversals more efficiently, making it a powerful solution for capturing both short- and long-term market movements.
Technical Composition and Calculation
The "Dema Ema Crossover" script consists of three main components: the Double Exponential Moving Average (DEMA), the fast EMA, and the slow EMA. The DEMA is calculated based on the selected length and source price, providing a smooth representation of market trends. Two EMAs are then applied to the DEMA, with one being faster (shorter period) and the other slower (longer period). The crossover between these two EMAs generates the signals for trend changes.
For the DEMA, the calculation uses the ta.dema function, which reduces lag while maintaining smoothness in the moving average. The fast and slow EMAs are calculated using the ta.ema function, with the fast EMA responding more quickly to price changes, while the slow EMA captures broader trends. The crossover between these two EMAs is used to generate buy and sell signals based on the direction of the crossover.
Features and User Inputs
The "Dema Ema Crossover" script offers several customizable inputs that allow traders to tailor the indicator to their trading strategies. The DEMA Length controls how smooth the DEMA is, with a longer length creating a slower-moving average and a shorter length providing a more responsive one. The Fast EMA Length and Slow EMA Length are also customizable, allowing traders to adjust the sensitivity of the crossover signals based on their market outlook and preferred trading timeframe.
Practical Applications
The "Dema Ema Crossover" indicator is designed for traders looking for a reliable crossover strategy that combines the responsiveness of the DEMA with the precision of EMA crossovers. This tool is particularly effective for:
Identifying Trend Reversals: The crossover between the fast and slow EMAs applied to the DEMA provides early signals of potential trend reversals, allowing traders to position themselves in the market more effectively. Confirming Trend Direction: The combined effect of the DEMA and EMA crossovers helps confirm the strength of a trend, improving decision-making around trade entries and exits. Adapting to Different Market Conditions: The customizable parameters allow traders to adjust the sensitivity of the crossover signals, making the indicator suitable for both fast-moving markets and slower, trending environments.
Advantages and Strategic Value
The "Dema Ema Crossover" script offers a significant advantage by combining the smoothness of the DEMA with the accuracy of EMA crossovers. The DEMA’s ability to reduce lag while maintaining responsiveness makes it ideal for trend-following strategies, while the crossover between the fast and slow EMAs provides precise entry and exit points. This combination reduces false signals and helps traders adapt to changing market conditions, resulting in a more reliable and efficient trend-following system.
Alerts and Visual Cues
The script includes alert conditions to notify traders of key crossover events. The "Dema Ema Crossover Long" alert is triggered when the fast EMA crosses above the slow EMA, signaling a potential upward trend. Conversely, the "Dema Ema Crossover Short" alert signals a possible downward trend when the fast EMA crosses below the slow EMA. Visual cues such as colored fills between the two EMAs highlight these crossover points on the chart, helping traders quickly identify trend shifts.
Summary and Usage Tips
The "Dema Ema Crossover | viResearch" indicator provides traders with a powerful combination of the DEMA and EMA crossovers, offering a smooth yet responsive tool for detecting trend reversals and confirming trend direction. By incorporating this script into your trading strategy, you can improve your ability to capture trend changes with greater accuracy, reducing the impact of market noise. Whether you are focused on short-term market moves or long-term trends, the "Dema Ema Crossover" indicator offers a flexible and reliable solution for traders at all levels.
Note: Backtests are based on past results and are not indicative of future performance.
RSI Crossover AlertRSI Crossover Alert Indicator - User Guide
The RSI Crossover Alert Indicator is a comprehensive technical analysis tool that detects multiple types of RSI crossovers and generates real-time alerts. It combines traditional RSI analysis with signal lines, divergence detection, and multi-level crossing alerts.
1. Multiple Crossover Detection
- RSI/Signal Line Cross: Signals a primary trend change.
- RSI/Second Signal Cross: Confirmation signals for stronger trends.
- Level Crossings: Crosses of Overbought 70, Oversold 30, and Midline 50.
- Divergence Detection: Hidden and regular divergences for reversal signals.
2. Alert Types
- Alert: RSI > Signal
Description: Bullish momentum is building.
Signal: Consider long positions.
- Alert: RSI < Signal
Description: Bearish momentum is building.
Signal: Consider short positions.
- Alert: RSI > 70
Description: Entering the overbought zone.
Signal: Prepare for a potential reversal.
- Alert: RSI < 30
Description: Entering the oversold zone.
Signal: Watch for a bounce opportunity.
- Alert: RSI crosses 50
Description: A shift in momentum.
Signal: Trend confirmation.
3. Visual Components
- Lines: RSI blue, Signal orange, Second Signal purple
- Histogram: Visualizes momentum by showing the difference between RSI and the Signal line.
- Background Zones: Red overbought, Green oversold
- Markers: Up/down triangles to indicate crossovers.
- Info Table: Real-time RSI values and status.
Strategy 1: Classic Crossover
- Entry Long: RSI crosses above the Signal Line AND RSI is below 50.
- Entry Short: RSI crosses below the Signal Line AND RSI is above 50.
- Take Profit: On the opposite signal.
- Stop Loss: At the recent swing high/low.
Strategy 2: Extreme Zone Reversal
- Entry Long: RSI is below 30 and crosses above the Signal Line.
- Entry Short: RSI is above 70 and crosses below the Signal Line.
- Risk Management: Higher win rate but fewer signals. Use a minimum 2:1 risk-reward ratio.
Strategy 3: Divergence Trading
- Setup: Enable divergence alerts and look for price/RSI divergence. Wait for an RSI crossover for confirmation.
- Entry: Enter on the crossover after the divergence appears. Place the stop loss beyond the starting point of the divergence.
Strategy 4: Multi-Timeframe Confirmation
1. Check the higher timeframe e.g. Daily to identify the main trend.
2. Use the current timeframe e.g. 4H/1H for your entry.
3. Only enter in the direction of the main trend.
4. Use the RSI crossover as the entry trigger.
Optimal Settings by Market
- Forex Major Pairs
RSI Length: 14, Signal Length: 9, Overbought/Oversold: 70/30
- Crypto High Volatility
RSI Length: 10-12, Signal Length: 6-8, Overbought/Oversold: 75/25
- Stocks Trending
RSI Length: 14-21, Signal Length: 9-12, Overbought/Oversold: 70/30
- Commodities
RSI Length: 14, Signal Length: 9, Overbought/Oversold: 80/20
Risk Management Rules
1. Position Sizing: Never risk more than 1-2% on a single trade. Reduce size in ranging markets.
2. Stop Loss Placement: Place stops beyond the recent swing high/low for crossovers. Using an ATR-based stop is also effective.
3. Profit Taking: Take partial profits at a 1:1 risk-reward ratio. Switch to a trailing stop after reaching 2:1.
1. Filtering Signals
- Combine with volume indicators.
- Confirm the trend on a higher timeframe.
- Wait for candlestick pattern confirmation.
2. Avoid Common Mistakes
- Don't trade every single crossover.
- Avoid taking signals against a strong trend.
- Do not ignore risk management.
3. Market Conditions
- Trending Market: Focus on midline 50 crosses.
- Ranging Market: Look for reversals from overbought/oversold levels.
- Volatile Market: Widen the overbought/oversold levels.
- If you get too many false signals:
Increase the signal line period, add other confirmation indicators, or use a higher timeframe.
- If you are missing major moves:
Decrease the RSI length, shorten the signal line period, or check your alert settings.
Recommended Combinations
1. RSI + MACD: For dual momentum confirmation.
2. RSI + Bollinger Bands: For volatility-adjusted signals.
3. RSI + Volume: To confirm the strength of a signal.
4. RSI + Moving Averages: To use as a trend filter.
This indicator provides a comprehensive RSI analysis. Success depends on proper configuration, risk management, and combining signals with the overall market context. Start with the default settings, then optimize based on your trading style and market conditions.

The Most Powerful TQQQ EMA Crossover Trend Trading StrategyTQQQ EMA Crossover Strategy Indicator
Meta Title: TQQQ EMA Crossover Strategy - Enhance Your Trading with Effective Signals
Meta Description: Discover the TQQQ EMA Crossover Strategy, designed to optimize trading decisions with fast and slow EMA crossovers. Learn how to effectively use this powerful indicator for better trading results.
Key Features
The TQQQ EMA Crossover Strategy is a powerful trading tool that utilizes Exponential Moving Averages (EMAs) to identify potential entry and exit points in the market. Key features of this indicator include:
**Fast and Slow EMAs:** The strategy incorporates two EMAs, allowing traders to capture short-term trends while filtering out market noise.
**Entry and Exit Signals:** Automated signals for entering and exiting trades based on EMA crossovers, enhancing decision-making efficiency.
**Customizable Parameters:** Users can adjust the lengths of the EMAs, as well as take profit and stop loss multipliers, tailoring the strategy to their trading style.
**Visual Indicators:** Clear visual plots of the EMAs and exit points on the chart for easy interpretation.
How It Works
The TQQQ EMA Crossover Strategy operates by calculating two EMAs: a fast EMA (default length of 20) and a slow EMA (default length of 50). The core concept is based on the crossover of these two moving averages:
- When the fast EMA crosses above the slow EMA, it generates a *buy signal*, indicating a potential upward trend.
- Conversely, when the fast EMA crosses below the slow EMA, it produces a *sell signal*, suggesting a potential downward trend.
This method allows traders to capitalize on momentum shifts in the market, providing timely signals for trade execution.
Trading Ideas and Insights
Traders can leverage the TQQQ EMA Crossover Strategy in various market conditions. Here are some insights:
**Scalping Opportunities:** The strategy is particularly effective for scalping in volatile markets, allowing traders to make quick profits on small price movements.
**Swing Trading:** Longer-term traders can use this strategy to identify significant trend reversals and capitalize on larger price swings.
**Risk Management:** By incorporating customizable stop loss and take profit levels, traders can manage their risk effectively while maximizing potential returns.
How Multiple Indicators Work Together
While this strategy primarily relies on EMAs, it can be enhanced by integrating additional indicators such as:
- **Relative Strength Index (RSI):** To confirm overbought or oversold conditions before entering trades.
- **Volume Indicators:** To validate breakout signals, ensuring that price movements are supported by sufficient trading volume.
Combining these indicators provides a more comprehensive view of market dynamics, increasing the reliability of trade signals generated by the EMA crossover.
Unique Aspects
What sets this indicator apart is its simplicity combined with effectiveness. The reliance on EMAs allows for smoother signals compared to traditional moving averages, reducing false signals often associated with choppy price action. Additionally, the ability to customize parameters ensures that traders can adapt the strategy to fit their unique trading styles and risk tolerance.
How to Use
To effectively utilize the TQQQ EMA Crossover Strategy:
1. **Add the Indicator:** Load the script onto your TradingView chart.
2. **Set Parameters:** Adjust the fast and slow EMA lengths according to your trading preferences.
3. **Monitor Signals:** Watch for crossover points; enter trades based on buy/sell signals generated by the indicator.
4. **Implement Risk Management:** Set your stop loss and take profit levels using the provided multipliers.
Regularly review your trading performance and adjust parameters as necessary to optimize results.
Customization
The TQQQ EMA Crossover Strategy allows for extensive customization:
- **EMA Lengths:** Change the default lengths of both fast and slow EMAs to suit different time frames or market conditions.
- **Take Profit/Stop Loss Multipliers:** Adjust these values to align with your risk management strategy. For instance, increasing the take profit multiplier may yield larger gains but could also increase exposure to market fluctuations.
This flexibility makes it suitable for various trading styles, from aggressive scalpers to conservative swing traders.
Conclusion
The TQQQ EMA Crossover Strategy is an effective tool for traders seeking an edge in their trading endeavors. By utilizing fast and slow EMAs, this indicator provides clear entry and exit signals while allowing for customization to fit individual trading strategies. Whether you are a scalper looking for quick profits or a swing trader aiming for larger moves, this indicator offers valuable insights into market trends.
Incorporate it into your TradingView toolkit today and elevate your trading performance!
