CBDE OscillatorWhat makes The Universe grow at an accelerating pace?
Dark Energy.
What makes The Economy grow at an accelerating pace?
Debt.
Debt is the Dark Energy of The Economy.
The Central Bank Dark Energy Oscillator (CBDEO) is a companion to the popular CBDET (Central Bank Dark Energy Tracer) script.
CBDEO is an oscillator that shows up in a separate TradingView pane in order to provide a relative change signal. It uses the same equations to aggregate central bank liquidity that are used in CBDET, and adds unique analysis tools that provide rate of change data.
There are 2 signals in the chart. First is the change/delta on a per bar basis, based on the chart time frame. The default style for this plot is "columns". This style parameter can be changed in the settings, along with each plot's visibility.
The second plot is a divergence signal that tests the change vs a simple moving average of the CBDET signal (central bank liquidity). The SMA length is customizable in the Input tab within the settings for the indicator. The SMA is based on the chart's current time frame.
The changes in liquidity on various time frames, and calculated as divergence against the liquidity signal SMA can be useful in determining the rate of change in liquidity, and therefore potential thrust in market price action.
In den Scripts nach "change" suchen

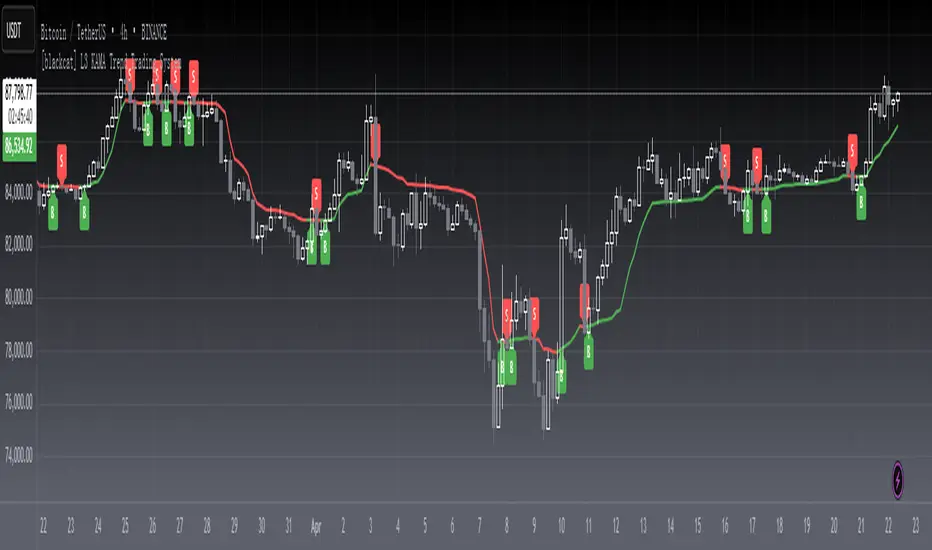
[blackcat] L3 KAMA Trend Trading SystemLevel: 3
Background
Kaufman’s Adaptive Moving Average ( KAMA ) was developed by American quantitative financial theorist Perry J. Kaufman in 1998.
Function
This is an improved KAMA trading system with my customized algorithm.You can use KAMA like any other trend-following indicator, such as a moving average. You can look for price crosses, directional changes and filtered signals. First, a cross above or below KAMA indicates directional changes in prices. As with any moving average, a simple crossover system will generate lots of signals and lots of whipsaws. Second, You can use the direction of KAMA to define the overall trend for a security. This may require a parameter adjustment to smooth the indicator further. You can change the fastline and slowline parameters to smooth KAMA and look for directional changes. The trend is down as long as KAMA is falling and forging lower lows. The trend is up as long as KAMA is rising and forging higher highs. Finally, You can combine signals and techniques. You can use a longer-term KAMA to define the bigger trend and a shorter-term KAMA for trading signals.
I have included in the indicator an input named "EnableSmooth" that allows you to determine if the KAMA line should be smoothed or not. A "True" as the input value smoothes the calculation. An "False" simply plots the raw KAMA line. When market volatility is low, Kaufman’s Adaptive Moving Average remains near the current market price, but when volatility increases, it will lag behind. What the KAMA indicator aims to do is filter out “market noise” – insignificant, temporary surges in price action. One of the primary weaknesses of traditional moving averages is that when used for trading signals, they tend to generate many false signals. The KAMA indicator seeks to lessen this tendency – generate fewer false signals – by not responding to short-term, insignificant price movements. Traders generally use the moving average indicator to identify market trends and reversals.
Remarks
Feedbacks are appreciated.
MTF Stoch RSI + Realtime DivergencesMulti-timeframe Stochastic RSI + Realtime Divergences + Alerts + Pivot lookback periods.
This version of the Stochastic RSI adds the following additional features to the stock UO by Tradingview:
- Optional 3 x Multiple-timeframe overbought and oversold signals, indicating where 3 selected timeframes are all overbought (>80) or all oversold (<20) at the same time, with alert option.
- Optional divergence lines drawn directly onto the oscillator in realtime, with alert options.
- Configurable lookback periods to fine tune the divergences drawn in order to suit different trading styles and timeframes, including the ability to enable automatic adjustment of pivot period per chart timeframe.
- Alternate timeframe feature allows you to configure the oscillator to use data from a different timeframe than the chart it is loaded on.
- Indications where the Stoch RSI is crossing down from above the overbought threshold (<80) and crossing above the oversold threshold (>20) levels on a given user selected timeframe, by printing gold dots on the indicator.
- Also includes standard configurable Stoch RSI options, including k length, d length, RSI length, Stochastic length, and source type (close, hl2, etc)
While this version of the Stochastic RSI has the ability to draw divergences in realtime along with related settings and alerts so you can be notified as divergences occur without spending all day watching the charts, the main purpose of this indicator was to provide the triple multiple-timeframe overbought and oversold confluence signals and alerts, in an attempt to add more confluence, weight and reliability to the single timeframe overbought and oversold states, commonly used for trade entry confluence. It's primary purpose is intended for scalping on lower timeframes, typically between 1-15 minutes. The triple timeframe overbought can often indicate near term reversals to the downside, with the triple timeframe oversold often indicating neartime reversals to the upside. The default timeframes for this confluence are set to check the 1 minute, 5 minute, and 15 minute timeframes, ideal for scalping the < 15 minute charts.
The Stochastic RSI
The popular oscillator has been described as follows:
“The Stochastic RSI is an indicator used in technical analysis that ranges between zero and one (or zero and 100 on some charting platforms) and is created by applying the Stochastic oscillator formula to a set of relative strength index (RSI) values rather than to standard price data. Using RSI values within the Stochastic formula gives traders an idea of whether the current RSI value is overbought or oversold. The Stochastic RSI oscillator was developed to take advantage of both momentum indicators in order to create a more sensitive indicator that is attuned to a specific security's historical performance rather than a generalized analysis of price change.”
How do traders use overbought and oversold levels in their trading?
The oversold level, that is when the Stochastic RSI is above the 80 level is typically interpreted as being 'overbought', and below the 20 level is typically considered 'oversold'. Traders will often use the Stochastic RSI at an overbought level as a confluence for entry into a short position, and the Stochastic RSI at an oversold level as a confluence for an entry into a long position. These levels do not mean that price will necessarily reverse at those levels in a reliable way, however. This is why this version of the Stoch RSI employs the triple timeframe overbought and oversold confluence, in an attempt to add a more confluence and reliability to this usage of the Stoch RSI.
What are divergences?
Divergence is when the price of an asset is moving in the opposite direction of a technical indicator, such as an oscillator, or is moving contrary to other data. Divergence warns that the current price trend may be weakening, and in some cases may lead to the price changing direction.
There are 4 main types of divergence, which are split into 2 categories;
regular divergences and hidden divergences. Regular divergences indicate possible trend reversals, and hidden divergences indicate possible trend continuation.
Regular bullish divergence: An indication of a potential trend reversal, from the current downtrend, to an uptrend.
Regular bearish divergence: An indication of a potential trend reversal, from the current uptrend, to a downtrend.
Hidden bullish divergence: An indication of a potential uptrend continuation.
Hidden bearish divergence: An indication of a potential downtrend continuation.
Setting alerts.
With this indicator you can set alerts to notify you when any/all of the above types of divergences occur, on any chart timeframe you choose, and also when the triple timeframe overbought and oversold confluences occur.
Configurable pivot lookback values.
You can adjust the default pivot lookback values to suit your prefered trading style and timeframe. If you like to trade a shorter time frame, lowering the default lookback values will make the divergences drawn more sensitive to short term price action. By default, this indicator has enabled the automatic adjustment of the pivot periods for 4 configurable timeframes, in a bid to optimise the divergences drawn when the indicator is loaded onto any of the 4 timeframes. These timeframes and the auto adjusted pivot periods on each of them can also be reconfigured within the settings menu.
How do traders use divergences in their trading?
A divergence is considered a leading indicator in technical analysis , meaning it has the ability to indicate a potential price move in the short term future.
Hidden bullish and hidden bearish divergences, which indicate a potential continuation of the current trend are sometimes considered a good place for traders to begin, since trend continuation occurs more frequently than reversals, or trend changes.
When trading regular bullish divergences and regular bearish divergences, which are indications of a trend reversal, the probability of it doing so may increase when these occur at a strong support or resistance level . A common mistake new traders make is to get into a regular divergence trade too early, assuming it will immediately reverse, but these can continue to form for some time before the trend eventually changes, by using forms of support or resistance as an added confluence, such as when price reaches a moving average, the success rate when trading these patterns may increase.
Typically, traders will manually draw lines across the swing highs and swing lows of both the price chart and the oscillator to see whether they appear to present a divergence, this indicator will draw them for you, quickly and clearly, and can notify you when they occur.
Disclaimer: This script includes code from the stock UO by Tradingview as well as the Divergence for Many Indicators v4 by LonesomeTheBlue.

mess JBI have made an all in one powerful script. It contains all meme lines(Moving average, Ema, Dema, Vwma, Hma)
In general, orange color means negative and white means positive. But you can very easily customize the colors according to your need and enable and disable any meme line.
Dots represent change of price action, although it works on every time frame but I have got best results on 15minute and 4hour Time Frame.
Cross represent change in volume. Now that's the most powerful thing, I have picked time segmented oscillator and changed the cod to represent Volume change. To take a better note of market, Start from Bigger Time frames. This indicator predicted every move Perfectly.
Enjoy

Fed Funds Rate ProjectionsThis script makes projections via drawing boxes based upon changes in the fed funds rate (FRED:EFFR).
It works by turning the change in the fed funds rate into a user defined percentage (using a multiplier, by default a 1% rate of change implies a 10% change in the chart) and then drawing a box that distance away depending on the direction of the rate of change.
The size of the multiplier should depend on the duration of the asset which this is being applied to, for example, a long duration asset such as a high beta growth stock should use a larger multiplier.

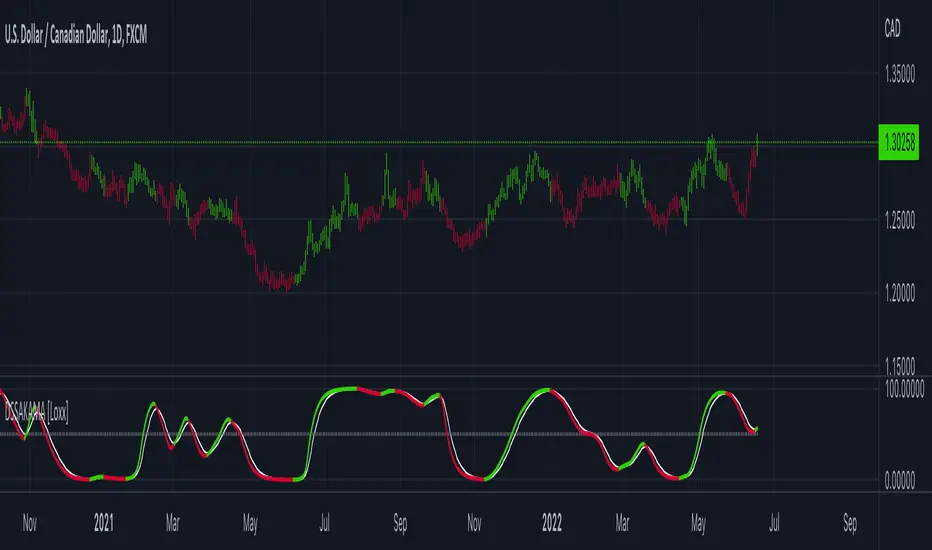
DSS of Advanced Kaufman AMA [Loxx]DSS of Advanced Kaufman AMA is a double smoothed stochastic oscillator using a Kaufman adaptive moving average with the option of using the Jurik Fractal Dimension Adaptive calculation. This helps smooth the stochastic oscillator thereby making it easier to identify reversals and trends.
What is the double smoothed stochastic?
The Double Smoothed Stochastic indicator was created by William Blau. It applies Exponential Moving Averages (EMAs) of two different periods to a standard Stochastic %K. The components that construct the Stochastic Oscillator are first smoothed with the two EMAs. Then, the smoothed components are plugged into the standard Stochastic formula to calculate the indicator.
What is KAMA?
Developed by Perry Kaufman, Kaufman's Adaptive Moving Average (KAMA) is a moving average designed to account for market noise or volatility . KAMA will closely follow prices when the price swings are relatively small and the noise is low. KAMA will adjust when the price swings widen and follow prices from a greater distance. This trend-following indicator can be used to identify the overall trend, time turning points and filter price movements.
What is the efficiency ratio?
In statistical terms, the Efficiency Ratio tells us the fractal efficiency of price changes. ER fluctuates between 1 and 0, but these extremes are the exception, not the norm. ER would be 1 if prices moved up 10 consecutive periods or down 10 consecutive periods. ER would be zero if price is unchanged over the 10 periods.
What is Jurik Fractal Dimension?
There is a weak and a strong way to measure the random quality of a time series.
The weak way is to use the random walk index ( RWI ). You can download it from the Omega web site. It makes the assumption that the market is moving randomly with an average distance D per move and proposes an amount the market should have changed over N bars of time. If the market has traveled less, then the action is considered random, otherwise it's considered trending.
The problem with this method is that taking the average distance is valid for a Normal (Gaussian) distribution of price activity. However, price action is rarely Normal, with large price jumps occuring much more frequently than a Normal distribution would expect. Consequently, big jumps throw the RWI way off, producing invalid results.
The strong way is to not make any assumption regarding the distribution of price changes and, instead, measure the fractal dimension of the time series. Fractal Dimension requires a lot of data to be accurate. If you are trading 30 minute bars, use a multi-chart where this indicator is running on 5 minute bars and you are trading on 30 minute bars.
Included
-Toggle bar colors on/offf
sm trend analyzer█ OVERVIEW
This script is intended to provide full time frame continuity information for almost all time frames (3, 5, 15, 30, 60, 4H, Day, Week, Month, Quarter, Year)
When added, the script provides a visual indicator/table to the bottom right of the screen to view the different performance at each time frame.
----------
Output
Time Frames: 3min, 5min, 15min, 30min, 60min, 4 Hour, Day, Week, Month Quarter, Year
Time Frame Labels: 3, 5, 15, 30, H, 4H, D, W, M, Q, Y
Colors: Will display the colors in RED if it's a down time frame (close/current < prior close) or a GREEN if it's a up time frame (close/current > prior close), the color will be more opaque/the opacity will increase the stronger it's levels are for the time frame.
Percentage: The percentages will also display, to give you a quick visual indicator or how strong a time frame is one way or the other.
Best Practices
----------
Had to decouple this from the other scripts because TV limits how much you can plot/show
May be a little slow at times, analyzing a lot of time periods/data be patient.
Used to indicate who is in control, buyers or sellers.
Jul 28, 2021
Release Notes: Fix study name, add some padding (high percentages are hard to get one the whole table)
Jul 28, 2021
Release Notes: Add more space... fix logic. It's open and close not close and prior close for FTC.
Jul 28, 2021
Release Notes: Set the width to ensure the whole percentage is shown. Also stack the cells (2 rows of 6) so it's more compressed and easier to read. Added in the 2H indicator as well.
Aug 2, 2021
Release Notes: Changes: added the ability to disable/hide each box and the ability to change the time frame of each box. The boxes are sequentially numbered, 1 - 12, left to right, top to bottom. So the first box, or 1, would be the top left, 2 would be the next box, all the way to 12 at the bottom right.

SuperTrend OptimizerHello!
This indicator attempts to optimize Supertrend parameters. To achieve this, 102 parameter combinations are tested concurrently - the top three performers are listed in descending order.
Parameters,
Factor: Changes to this parameter shifts the tested factor range. For instance, increasing the factor measure from 3.00 to 3.01 (+0.01) will remove 3.00 from the tested range - this setting controls the lower threshold of the range. The upper threshold, in all instances, is the lower Factor threshold + 3.3 (i.e. 3.0(lower) - 6.3(upper), 4.0(lower) - 7.3(upper), 2.5(lower) - 5.8(upper))
ATR period: Changes to this parameter shifts the tested ATR period range. For instance, increasing the ATR measure from 10 to 11 (+1) will remove 10 from the tested range - this setting controls the lower threshold of the range. The upper threshold, in all instances, is the lower threshold + 2 (i.e. 10(lower) - 12(upper), 11(lower) - 13(upper), 9(lower), - 11(upper))
The Factor parameter is modifiable to any positive decimal number; the ATR parameter is modifiable to any positive integer. Changing either parameter shifts the tested parameter combination range. Both parameters can be changed in the settings, to which you control the lower threshold of the range. If, for instance, you were to change the Factor measurement from 3.0 to 4.1 (+1.1) the 4.0 Factor measurement, and all Factor measures less than 4.0, will be excluded from the performance test.
Consequently, a Supertrend test will be performed with a Factor of 4.1 and an ATR period of 10 (default). This test repeats at 0.1 Factor intervals and 1.0 ATR intervals.
Therefore, assume you modify the Factor lower threshold to 3.1 and the ATR lower threshold to 10. The indicator will test three Supertrend systems with a Factor of 3.1 and an ATR period of 10.. then 11.. 12, then three systems with a Factor of 3.2 and an ATR period of 10.. then 11.. 12... until (lower Factor threshold + 3.3) and (lower ATR threshold + 2) are tested... which in this example is... a Factor of 6.4 and an ATR period of 12.
The tested Factor range and ATR range are displayed in a bottom right table alongside the top performing parameter combinations.
Of course, you can change the the lower thresholds, which means you can test numerous Supertrend parameter combinations! However, no greater than 102 parameter combinations will be tested simultaneously; the best performing Supertrend parameters are plotted on the chart automatically.
I will be working on this indicator more tomorrow! Let me know if you have questions or anything you would like included!
(I of course added something fun in the script. Be sure to try it with bar replay!)

Template Trailing Strategy (Backtester)💭 Overview
+ Title: Template Trailing Strategy (Backtester)
+ Author: Iason Nikolas (jason5480)
+ License: CC BY-NC-SA 4.0
💢 What is the "Template Trailing Strategy (Backtester)" ❓
The "Template Trailing Strategy (Backtester)" (TTS) is a back-tester orchestration framework. It supercharges the implementation-test-evaluation lifecycle of new trading strategies, by making it possible to plug in your own trading idea.
While TTS offers a vast number of configuration settings, it primarily allows the trader to:
Test and evaluate your own trading logic that is described in terms of entry, exit, and cancellation conditions.
Define the entry and exit order types as well as their target prices when the limit, stop, or stop-limit order types are used.
Utilize a variety of options regarding the placement of the stop-loss and take-profit target(s) prices and support for well-known techniques like moving to breakeven and trailing.
Provide well-known quantity calculation methods to properly handle risk management and easily evaluate trading strategies and compare them.
Alert on each trading event or any related change through a robust and fully customizable messaging system.
All of the above makes TTS a practical toolkit: once you learn it, many repetitive tasks that strategy authors usually re-implement are eliminated. Using TradingView’s built-in backtesting engine makes testing and comparing ideas straightforward.
By utilizing the TTS one can easily swap "trading logic" by testing, evaluating, and comparing each trading idea and/or individual component of a strategy.
Finally, TTS, through its per-event alert management (and debugging) system, provides an automated solution that supports live trading with brokers via webhooks.
NOTE: The "Template Trailing Strategy (Backtester)" does not dictate how you can combine different indicator types. Thus, it should not be confused as a "Trading System", because it gives its user full flexibility on that end (for better or worse).
💢 What is a "Signal Indicator" ❓
"Signal Indicator" (SI) is an indicator that can output a "signal" that follows a specific convention so that the "Template Trailing Strategy (Backtester)" can "understand" and execute the orders accordingly. The SI realizes the core trading logic signaling to the TTS when to enter, exit, or cancel an order. A SI instructs the TTS "when" to enter or exit, and the TTS determines "how" to enter and exit the position once the Signal Indicator generates a signal.
A very simple example of a Signal Indicator might be a 200-day Simple Moving Average Signal. When the price of the security closes above the 200-day SMA, a SI would provide TTS with a "long entry signal". Once TTS receives the "long entry signal", the TTS will open a long position and send an alert or automated trade message via webhook to a broker, based on the Entry settings defined in TTS. If the TTS Entry settings specify a "Market" order type, then the open long position will be executed by TTS immediately. But if the TTS Entry settings specify a "Stop" order type with a 1% Stop Distance, then when the price of the security rises by 1% after the "long entry signal" occurs, the TTS will open a long position and the Long Entry alert or webhook to the broker will be sent.
🤔 How to Guide
💢 How to connect a "signal" from a "Signal Indicator" ❓
The "Template Trailing Strategy (Backtester)" was designed to receive external signals from a "Signal Indicator". In this way, a "new trading idea" can be developed, configured, and evaluated separately from the TTS. Similarly, the SI can be held constant, and the trading mechanics can change in the TTS settings and back-tested to answer questions such as, "Am I better with a different stop loss placement method, what if I used a limit order instead of a stop order to enter, what if I used 25% margin instead of trading spot market?"
To make that possible by connecting an external signal indicator to TTS, you should:
Add both your SI (e.g. "Two MA Signal Indicator" , "Click Signal Indicator" , "Signal Adapter" , "Signal Composer" ) and the TTS script to the same chart.
Open the script's Settings / Inputs dialog for the TTS.
In the 🛠️ STRATEGY group set 𝐃𝐞𝐚𝐥 𝐂𝐨𝐧𝐝𝐢𝐨𝐧𝐬 𝐌𝐨𝐝𝐞 to 🔨External (this makes TTS listen to an external signal source).
Still inside 🛠️ STRATEGY locate the 🔌𝐒𝐢𝐠𝐧𝐚𝐥 🛈 input and choose the plotted output of your SI. The option should look like: "<SI short title>:🔌Signal to TTS" .
Verbose troubleshooting & tips
If the SI does not appear in the 🔌Signal 🛈 selector, confirm both scripts are added to the same chart and the SI exposes a plotted series (title often "🔌Signal to TTS").
When using multiple SIs, pick the SI instance that actually outputs the "🔌Signal to TTS" plotted series.
Validate on the chart: when your SI changes state, the plotted "🔌Signal" series in the TTS (visible in the data window) should change accordingly.
The TTS accepts only signals that follow the tts_convention DealConditions structure. Do not attempt to feed arbitrary scalar series without using conv.getDealConditions / conv.DealConditions.
Make sure your SI composes a DealConditions value following the TTS convention (startLong, endLong, startShort, endShort — optional cancel fields). See the template below.
If the plot is present but TTS does not react, ensure the SI plot is non-repainting (or accept realtime/backtest limitations). Test on historical bars first.
Create alerts on the strategy (see the Alerts section). Use the {{strategy.order.alert_message}} placeholder in the Create Alert dialog to forward TTS messages.
💢 How to create a custom trading logic ❓
The "Template Trailing Strategy (Backtester)" provides two ways to plug in your custom trading logic. Both of them have their advantages and disadvantages.
✍️ Develop your own Customized "Signal Indicator" 💥
The first approach is meant to be used for relatively more complex trading logic. The advantages of this approach are the full control and customization you have over the trading logic and the relatively simple configuration setup by having two scripts only. The downsides are that you have to have some experience with pinescript or you are willing to learn and experiment. You should also know the exact formula for every indicator you will use since you have to write it by yourself. Copy-pasting from existing open-source indicators will get you started quite fast though.
The idea here is either to create a new indicator script from scratch or to copy an existing non-signal indicator and make it a "Signal Indicator". To create a new script, press the "Pine Editor" button below the chart to open the "Pine Editor" and then press the "Open" button to open the drop-down menu with the templates. Select the "New Indicator" option. Add it to your chart to copy an existing indicator and press the source code {} button. Its source code will be shown in the "Pine Editor" with a warning on top stating that this is a read-only script. Press the "create a working copy". Now you can give a descriptive title and a short title to your script, and you can work on (or copy-paste) the (other) indicators of your interest. Once you have the information needed to decide, define a DealConditions object and plot it like this:
import jason5480/tts_convention/ as conv
// Calculate the start, end, cancel start, cancel end conditions
dealConditions = conv.DealConditions.new(
startLongDeal = ,
startShortDeal = ,
endLongDeal = ,
endShortDeal = ,
cnlStartLongDeal = ,
cnlStartShortDeal = ,
cnlEndLongDeal = ,
cnlEndShortDeal = )
// Use this signal in scripts like "Template Trailing Strategy (Backtester)" and "Signal Composer" that can utilize its value
// Emit the current signal value according to the TTS framework convention
plot(series = conv.getSignal(dealConditions), title = '🔌Signal to TTS', color = #808000, editable = false, display = display.data_window + display.status_line, precision = 0)
You should import the latest version of the tts_convention library and write your deal conditions appropriately based on your trading logic and put them in the code section shown above by replacing the "…" part after "=". You can omit the conditions that are not relevant to your logic. For example, if you use only market orders for entering and exiting your positions the cnlStartLongDeal, cnlStartShortDeal, cnlEndLongDeal, and cnlEndShortDeal are irrelevant to your case and can be safely omitted from the DealConditions object. After successfully compiling your new custom SI script add it to the same chart with the TTS by pressing the "Add to chart" button. If all goes well, you will be able to connect your "signal" to the TTS as described in the "How to connect a "signal" from a "Signal Indicator"?" guide.
🧩 Adapt and Combine existing non-signal indicators 💥
The second approach is meant to be used for relatively simple trading logic. The advantages of this approach are the lack of pine script and coding experience needed and the fact that it can be used with closed-source indicators as long as the decision-making part is displayed as a line in the chart. The drawback is that you have to have a subscription that supports the "indicator on indicator" feature so you can connect the output of one indicator as an input to another indicator. Please check if your plan supports that feature here
To plug in your own logic that way you have to add your indicator(s) of preference in the chart and then add the "Signal Adapter" script in the same chart as well. This script is a "Signal Indicator" that can be used as a proxy to define your custom logic in the CONDITIONS group of the "Settings/Inputs" tab after defining your inputs from your preferred indicators in the VARIABLES group. Then a "signal" will be produced, if your logic is simple enough it can be directly connected to the TTS that is also added to the same chart for execution. Check the "How to connect a "signal" from a "Signal Indicator"?" in the "🤔 How to Guide" for more information.
If your logic is slightly more complicated, you can add a second "Signal Adapter" in your chart. Then you should add the "Signal Composer" in the same chart, go to the SIGNALS group of the "Settings/Inputs" tab, and connect the "signals" from the "Signal Adapters". "Signal Composer" is also a SI so its composed "signal" can be connected to the TTS the same way it is described in the "How to connect a "signal" from a "Signal Indicator"?" guide.
At this point, due to the composability of the framework, you can add an arbitrary number (bounded by your subscription of course) of "Signal Adapters" and "Signal Composers" before connecting the final "signal" to the TTS.
💢 How to set up ⏰Alerts ❓
The "Template Trailing Strategy (Backtester)" provides a fully customizable per-event alert mechanism. This means that you may have an entirely different message for entering and exiting into a position, hitting a stop-loss or a take-profit target, changing trailing targets, etc. There are no restrictions, and this gives you great flexibility.
First enable the events you want under the "🔔 ALERT MESSAGES" module. Each enabled event exposes a text area where you can craft the message using placeholders that TTS replaces with actual values when the event occurs.
The placeholder categories (exact names used by the script) are:
Chart & instrument:
{{ticker}}
{{base_currency}}
{{quote_currency}}
Entry / exit / stop / TP prices & offsets:
{{entry_price}}
{{exit_price}}
{{stop_loss_price}}
{{take_profit_price_1}} ... {{take_profit_price_5}}
{{entry+_price}}, {{entry-_price}}, {{exit+_price}}, {{exit-_price}} — Optional offset helpers (computed using "Offset Ticks")
Quantities, percents & derived quantities:
{{entry_base_quantity}} — base units at entry (e.g. BTC)
{{entry_quote_quantity}} — quote amount at entry (e.g. USD)
{{risk_perc}} — % of capital risked for that entry (multiplied by 100 when "Percentage Range " is enabled)
{{remaining_quantity_perc}} — % of the initial position remaining at close/SL
{{remaining_base_quantity}} — remaining base units at close/SL
{{take_profit_quantity_perc_1}} ... {{take_profit_quantity_perc_5}} — % sold/bought at each TP
{{take_profit_base_quantity_1}} ... {{take_profit_base_quantity_5}} — base units closed at each TP
❗ Important: the per-event alert text is injected into the Create Alert dialog using TradingView's strategy placeholder:
{{strategy.order.alert_message}}
During the creation of a strategy alert, make sure the placeholder {{strategy.order.alert_message}} exists in the "Message" box. TradingView will substitute the per-event text you configured and enabled in TTS Settings/Inputs before sending it via webhook/notification.
Tip: For webhook/broker execution, set the proper "Condition" in the Create Alert dialog (for changing-entry/exit/SL notifications use "Order fills and alert() function calls" or "alert() function calls only" as appropriate).
💢 How to execute my orders in a broker ❓
To execute your orders in a broker that supports webhook integration, you should enable the appropriate alerts in the "Template Trailing Strategy (Backtester)" first (see the "How to set up Alerts?" guide above). Then you should go to the "Create Alert/Notifications" tab check the "Webhook URL" and paste the URL provided by your broker. You have to read the documentation of your broker for more information on what messages are expected.
Keep in mind that some brokers have deep integration with TradingView so a per-event alert approach might be overkill.
📑 Definitions
This section tries to give some definitions in terms that appear in the "Settings/Inputs" tab of the "Template Trailing Strategy (Backtester)"
💢 What is Trailing ❓
Trailing is a technique where a price target follows another "barrier" price (usually high or low) by trying to keep a maximum distance from the "barrier" when it moves in only one direction (up or down). When the "barrier" moves in the other direction the price target will not change. There are as many types of trailing as price targets, which means that there are entry trailing, exit trailing, stop-loss trailing, and take-profit trailing techniques.
💢 What is a Moonbag ❓
A Moonbag in a trade is the quantity of the position that is reserved and will not be exited even if all take-profit targets defined in the strategy are hit, the quantity will be exited only if the stop-loss is hit or a close signal is received. This makes the stop-loss trailing technique in a trend-following strategy a good candidate to take advantage of a Moonbag.
💢 What is Distance ❓
Distance is the difference between two prices.
💢 What is Bias ❓
Bias is a psychological phenomenon where you make decisions based on market sentiment. For example, when you want to enter a long position you have a long bias, and when you want to exit from the long position you have a short bias. It is the other way around for the short position.
💢 What is the Bias Distance of a price target ❓
The Bias Distance of a price target is the distance that the target will deviate from its initial price. The direction of this deviation depends on the bias of the market. For example, suppose you are in a long position, and you set a take-profit target to the local highest high. In that case, adding a bias distance of five ticks will place your take-profit target 5 ticks below this local highest high because you have a short bias when exiting a long position. When the bias is long the bias distance will be added resulting in a higher target price and when you have a short bias the bias distance will be subtracted.
⚙️ Settings
In the "Settings/Inputs" tab of the "Template Trailing Strategy (Backtester)", you can find all the customizable settings that are provided by the framework. The variety of those settings is vast; hence we will only scratch the surface here. However, for every setting, there is an information icon 🛈 where you can learn more if you mouse over it. The "Settings/Inputs" tab is divided into ten main groups. Each one of them is responsible for one module of the framework. Every setting is part of a group that is named after the module it represents. So, to spot the module of a setting find the title that appears above it comes with an emoji and uppercase letters. Some settings might have the same name but belong to different modules e.g. "Tgt Dist Mtd" (Target Distance Method). Some settings are indented, which means that they are closely related to the non-indented setting above. Usually, indented settings provide further configuration for one or more options of the non-indented setting above. The groups that correspond to each module of the framework are the following:
🗺️ Quick Module Cross-Reference (use emojis to jump to setting groups)
📆 FILTERS — session, date & weekday filters
🛠️ STRATEGY — internal vs external deal-conditions; pick the signal source
🔧 STRATEGY – INTERNAL — built-in Two MA logic for demonstration purposes
🎢 VOLATILITY — ATR / StDev update modes
🔷 ENTRY — entry order types & trailing
🎯 TAKE PROFIT — multi-step TP and trailing rules
🛑 STOP LOSS — stop placement, move-to-breakeven, trailing
🟪 EXIT — exit order types & cancel logic
💰 QUANTITY/RISK MANAGEMENT — position sizing, moonbag, limits
📊 ANALYTICS — stats, streaks, seasonal tables
🔔 ALERT MESSAGES — per-event alert templates & placeholders
😲 Caveats
💢 Does "Template Trailing Strategy (Backtester)" have repainting behavior? ❓
The answer is that the "Template Trailing Strategy (Backtester)" does not repaint as long as the "Signal Indicator" that is connected also does not repaint. If you developed your own SI make sure that you understand and know how to prevent this behavior. The publication by @PineCoders here will give you a good idea on how to avoid most of the repainting cases.
⚠️ There is an exception though, when the "Enable Trail⚠️💹" checkbox is checked, the Take Profit trailing feature is enabled, and a tick-based approach is used, meaning that after a while, when the TradingView discards all the real-time data, assumptions will be made by the backtesting engine that will cause a form of repainting. To avoid making false assumptions please disable this feature in the early stages and evaluate its usefulness in your strategy later on, after first confirming the success of the logic without this feature. In this case, consider turning on the bar magnifier feature. This way you will get more accurate backtest results when the Take Profit trailing feature is enabled.
💢 Can "Template Trailing Strategy (Backtester)" satisfy all my trading strategies ❓
While this framework can satisfy quite a large number of trading strategies there are cases where it cannot do so. For example, if you have a custom logic for your stop-loss or take-profit placement, or if you want to dollar cost average, then it might be better to start a new strategy script from scratch.
⚠️ It is not recommended to copy the official TTS code and start developing unless you are a Pine wizard! Even in that case, there is a stiff learning curve that might not be worth your time. Last, you must consider that I do not offer support for customized versions of the TTS script and if something goes wrong in the process you are all alone.
💝 Support & Feedback
For feedback, bug reports, or feature requests, contact me via TradingView PM or use the script comments.
Note: The author's personal links and contact are available on the TradingView profile.
🤗 Thanks
Special thanks to the welcoming community members, who regularly gave feedback all those years and helped me to shape the framework as it is today! Thanks everyone who contributed by either filing a "defect report" or asking questions that helped me to understand what improvements were necessary to help traders.
Enjoy!
Jason

40 crypto screener [LUPOWN]// ENGLISH
This indicator shows two tables, with 10 assets each, they can be currencies, stocks or cryptos, the columns can be changed to the information you want to see, among the options are price or change (change in percentage of the candle in the temporality where you are seeing it), TL are buy or sell signals according to the Latin trading strategy (Squeeze momentum combined with ADX) buy if the momentum changes to range or rise and the ADX has a negative slope, sell if the momentum changes to range or fall and The ADX has a negative slope, the signals are not 100% effective, you must support it with price action and market speculation, directionality in the momentum, slope of the ADX, if there is divergence in the momoentum squeeze, lux something and cipher use an indicator of Lazy bear, lux something signals when two wave trends cross and the cipher signals when the wave trend crosses above or below the 0 point.
You can choose between seeing one or two tables, this so that it can be seen on small screens, there is also the option to hide the tables and show the label, which is also an alternative to see it on small screens
i got the main idea from @QuantNomad
//SPANISH
Este indicador muestra dos tablas, con 10 activos cada una, pueden ser divisas, acciones o cryptos, las columnas se pueden cambiar a la información que quieras ver, entre las opciones están precio o cambio (cambio en porcentaje de la vela en la temporalidad donde lo estes viendo), TL son señales de compra o venta según estrategia de trading latino (Squeeze momentum combinado con ADX) compra si el momentum cambia a rango o subida y el ADX tiene pendiente negativa, venta si el momentum cambia a rango o caída y el ADX tiene pendiente negativa, las señales no son 100% efectivas debes apoyarla con la acción del precio y especulación del mercado, direccionalidad en el momentum, pendiente del ADX, si hay divergencia en el squeeze momoentum, lux algo y cipher utilizan un indicador de Lazy bear, lux algo da señal cuando dos wave trend se cruzan y el cipher da señal cuando el wave trend cruza por encima o debajo del punto 0.
Puedes elegir entre ver una o dos tablas, esto para que se pueda ver en pantallas pequeñas, también esta la opción de ocultar las tablas y mostrar el label, que también es una alternativa para verlo en pantallas pequeñas
La idea principal la tome de @QuantNomad

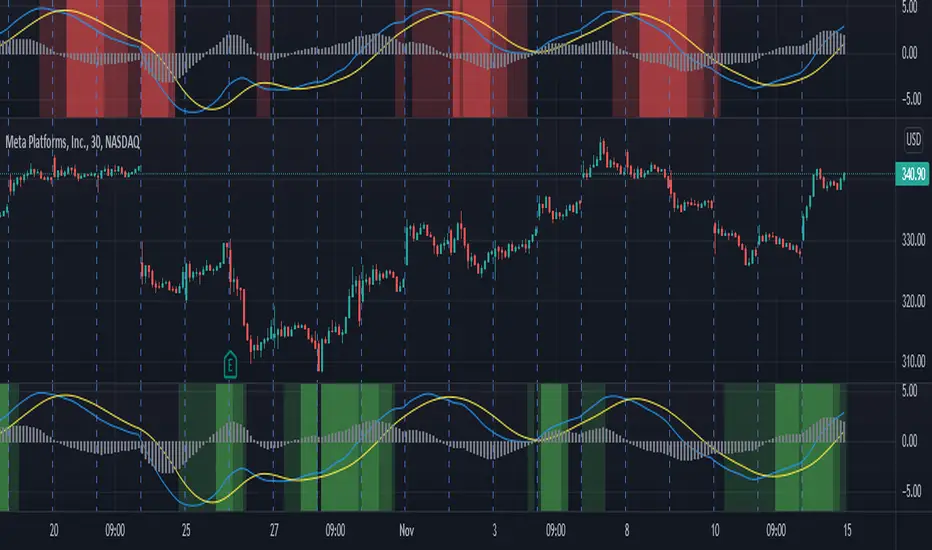
MomentumSignalsLibrary "MomentumSignals"
Contains utilities varying algorithms for detecting key changes in momentum. Note: Momentum is not velocity and should be used in conjunction with other indicators. A change in momentum does not mean a reversal of velocity or trend.
simple(primary, secondary, len) Compares two series for changes in momentum to derive signal values.
Parameters:
primary : The primary series (typically a moving average) to look for changes in momentum.
secondary : The secondary series (typically derived moving average of the primary) to use as a comparison value.
len : The number of bars to measure the change in momentum.
filtered(primary, secondary, len, stdlen, stdMultiple) Compares two series for changes in momentum to derive signal values. Uses statistics to filter out changes in momentum.
Parameters:
primary : The primary series (typically a moving average) to look for changes in momentum.
secondary : The secondary series (typically derived moving average of the primary) to use as a comparison value.
len : The number of bars to measure the change in momentum.
stdlen : The number of bars to measure the change in momentum for filtering.
stdMultiple : The multiple of the change in momentum to use before reversiing.
special(primary, secondary, stdlen, stdMultiple) Compares two series for changes in momentum to derive signal values. Uses statistics to filter out changes in momentum. Does not signal when likely overbought or oversold.
Parameters:
primary : The primary series (typically a moving average) to look for changes in momentum.
secondary : The secondary series (typically derived moving average of the primary) to use as a comparison value.
stdlen : The number of bars to measure the change in momentum for filtering.
stdMultiple : The multiple of the change in momentum to use before reversiing.
[blackcat] L2 Perry Kaufman Adaptive MA (KAMA)Level: 2
Background
Kaufman’s Adaptive Moving Average (KAMA) was developed by American quantitative financial theorist Perry J. Kaufman in 1998. The technique began in 1972 but Kaufman officially presented it to the public much later through his book, “Trading Systems and Methods.” Unlike other moving averages, Kaufman’s Adaptive Moving Average accounts not only for price action but also for market volatility. KAMA is a moving average that takes into account market noise or volatility. KAMA will closely track prices when price fluctuations are relatively small and noise is low. KAMA will adapt to increasing price fluctuations and track prices from a greater distance. This trend following indicator can be used to identify the overall trend, time turning points and to filter price movements.
Function
You can use KAMA like any other trend-following indicator, such as a moving average. You can look for price crosses, directional changes and filtered signals. First, a cross above or below KAMA indicates directional changes in prices. As with any moving average, a simple crossover system will generate lots of signals and lots of whipsaws. Second, You can use the direction of KAMA to define the overall trend for a security. This may require a parameter adjustment to smooth the indicator further. You can change the fastline and slowline parameters to smooth KAMA and look for directional changes. The trend is down as long as KAMA is falling and forging lower lows. The trend is up as long as KAMA is rising and forging higher highs. Finally, You can combine signals and techniques. You can use a longer-term KAMA to define the bigger trend and a shorter-term KAMA for trading signals.
I have included in the indicator an input named "EnableSmooth" that allows you to determine if the KAMA line should be smoothed or not. A "True" as the input value smoothes the calculation. An "False" simply plots the raw KAMA line. When market volatility is low, Kaufman’s Adaptive Moving Average remains near the current market price, but when volatility increases, it will lag behind. What the KAMA indicator aims to do is filter out “market noise” – insignificant, temporary surges in price action. One of the primary weaknesses of traditional moving averages is that when used for trading signals, they tend to generate many false signals. The KAMA indicator seeks to lessen this tendency – generate fewer false signals – by not responding to short-term, insignificant price movements. Traders generally use the moving average indicator to identify market trends and reversals.
Key Signal
AMAValF --> KAMA Fast Line.
AMAValS --> KAMA Slow Line.
Remarks
This is a Level 2 free and open source indicator.
Feedbacks are appreciated.

SMA + Trend Strength + Trailing Stop LossThe 'SMA + Trend Strength + Trailing Stop Loss' indicator was designed for swing trading long positions over the course of days/weeks. The benefit of the indicator is to identify areas where the market of a given asset is showing signs of a strong uptrend, divergences, and fear. A 13-bar simple moving average is color coded to four colors based on 5 given conditions at a time, which are represented as a trend meter on the bottom right of the screen. A trailing stop loss indicator is included to secure your profits or limit your loss in case the market reverses on you unexpected. Please use this indicator responsibly with proper risk management, and never rely on the indicator by itself for buy and sell signals.
When the simple moving average color is green, it means that at least 4 of 5 conditions are confirming a move upwards, this is when you can take an entry into a trade based on your entry strategy. As the trend continues, the color will eventually change to yellow signaling a divergence. This is when you can use your exit strategy to find a good point to sell. It is wise not to take new positions when the color is trending yellow.
If the color changes from yellow to orange, that is a warning sign that the trend is about to change or has begun to change. Prices may have already fallen. However, sometimes the color will change from yellow back to green signaling a continuation of the trend. You can either keep holding or take a new position in this instance.
When the color is red, this signals fear in the market, you should stay out of the market at first. However, as the market consolidates and the color starts changing back to orange, this is an opportunity to take a long position at a reasonably low price.
Simple Moving Average (13-Bar) Color Explanation:
The colors change based on 5 market conditions represented in the trend meter.
Green: Strong Uptrend
Yellow: Divergence Present
Orange: Warning
Red: Fear
Trend Meter Explanation:
The trend meter draws 5 arrows indicating bullish or bearish presence.
LL = Lower Lows - Detects when the market is trending with lower lows.
HH = Higher Highs - Detects when the market is trending with higher highs.
MA = SMA Direction - A formula is used to determine the direction of the SMA.
DI = Directional Index - Identifies when upwards momentum is trending.
RSI = Relative Strength Index - Identifies when the RSI is in an uptrend state.
Note: For advanced users, this indicator has a hidden DMI(4, 4, 4) and RSI(14) indicator used to determine the last two conditions. The Directional Index is based on a DI Plus momentum moving average to determine a momentum trend and the RSI trending over 50 will constitute an uptrend signal as below 50 it will point down.
Trailing stop loss:
The trailing stop loss is determined based on the lowest price of the last 8 bars.
A gray step-line is drawn at the suggested stop activation price.
A red step-line is drawn at the suggested stop limit price.
When the price breaches the trailing stop, a red X will appear below the bar.
You can turn each of these features on or off based on your preference. Happy trading!

CSPDMost Advanced & Accurate CandleStick Pattern Detector
Looking All Over of All Markets for All Important Powerful Reversal | Corrective Patterns (25 type)
Filtering the Results with Optional Features like Oscillator, Bollinger Bands, Volume Confirmation, Prior and Following Candles Confirmation which are Fully Customizable.
With this you can detect:
Hammer | Shooting star
Inverted Hammer | Hanging
Long legged Doji | Dragonfly Doji | Gravestone Doji
Bullish tweezers | Bearish tweezers
Bullish inside bar | Bearish inside bar
Bullish three line strike | Bearish three line strike
Bullish engulfing | Bearish engulfing
Piercing line | Dark cloud cover
Bullish abandoned baby | Bearish abandoned baby
Morning star | Evening star
Three white soldiers | Three black crows
*Bullish kayo | *Bearish kayo
Features:
Prior and Following candles Confirmation
You can set prior and following candle as basic prerequisites for marking candles as pattern to make sure you are at the top or bottom of the trend.
Volume confirmation
You can active volume increasing confirmation for some of pattern with adjustable increase % relative to prior candle | candles.
Oscillator Confirmation
Active oscillator confirmation. Select your approved oscillator from list (Stochastic, RSI, StochRSI, MFI, StochMFI) then enter desired value for marking candles as bullish | bearish pattern.
Bollinger Bands Confirmation
Active BB confirmation. Configure your Bollinger Bands. Now only see the patterns which reached or crossed from Bands. Also you can enable BB clod to have your BB indicator at the same time.
Adjustable Flexibility and Precision
You can set tolerance% for Osc and BB Confirmation - each one separately - for more control.
Self-adaptability
The properties of markets change over time, for example the amplitude of fluctuations and the intensity of movements. The script is designed in such a way that you can examine the price history as a benchmark for changes in market properties to adopt determinants. Also you can control those manually.
Self-regulatory
The user has the ability to change input factors depending on their point of view.
Behind the pattern recognition algorithms, there are relationships and similarities in their appearance that cause them to be influenced by each other. Simultaneously with changing the determining factors of each pattern by you, script automatically adjusts other details in accordance with your changes.
Alerts
You can set for type of pattern or each one of pattern have been detected.
Fully Costumizable
All of these options can be change and adjust.
Note 1.
The patterns are based on extensive study of reference and famous sources and the experience of me and my friends in trading and analysis with price action methods.
Note 2.
Due to the Pine limitations in the number of outputs | plots for each script, our attempt has been made to select the best and most important patterns.
Note 3.
So far, many scripts have been written in this field, but our experience with all of them and even the build in version was not satisfactory, and this was the initial motivation for making the script.
We strive to improve progress and elimination of shortcomings and we will continue to make this better.
Note 4.
Through personal experience and based on the principles of market and candlestick psychology, we discovered a new type of pattern and named it as Kayo.
kayo is a two candle pattern which formed when:
1.We have a pivot point with prior candles as left bars and following candles as right bar. Pivot candle called as second candle.
2.In a bullish kayo, first candle must closed descending and second candle must closed as ascending. For bearish kayo vise versa.
3.In a bullish kayo, second candle's lower wick must be longer then upper wick.
4. A pattern marked as kayo when its conditions do not correspond to any of the other patterns(include the confirmation that user added), ie it has the last naming priority over the other patterns.
Note 5.
When you active confirmation options for patterns like hammer, engulf and etc which they conditions are like kayo in some extent, if they can't pass the confirmation steps, they can be marked as kayo pattern.
Note 6.
If you active volume confirmation for Three white soldiers | Three black crows, the confirmation get passed if the volume of forth or third candle increased as value as entered relative to volume EMA3 of 3 candles.
Note 7.
In a bullish pattern all highs of following candles MUST be higher than prior highs and all lows of following candles MUST be higher than prior lows. For bearish patterns vise versa.
This type of confirmation depends on High and Low NOT close!
Gift to price action lovers!
Support us with your like and comments. let us know your experience, points and idea to make this better together.

Volume Brakeout v1Volume Brakout indicator is used to help determine trend direction strictly based on Negative and Positive volume data.
How to Read:
- Moving Average crossovers are used to help determine a possible trend change or retracement.
- The area cloud on the bottom is calculated by the difference of the moving averages. This could be used to help determine the trending volume strength.
- Bright colored volume bars are large volume spikes calculated by the x factor in the options.
Other changes:
- Volume Depth is going open source with numerous of its indicators. This is only one of many!
- Volume is now displayed without being altered for calculations.

EMAs MultiTimeFrames + Trends - BeloTradeThis is an indicator thats allows us to see the trend in diferent time frames, we use the 72EMA. (4h,1h, 15min).
When the price is above all the EMAs is an clear uptrend. When is below is a clear downtrend. In the middle we are in a consolidation phase.
Green = Bullish
Red = Bearish
Emas MultiTameFrames : EMA 72 (15m) + EMA 72 (1H) + EMA 72 (4H).
Color Change: Cross EMA 72 (1H) - EMA 72 (4H).
The cross tends to be a confirmation off the trend change.

Point and Figure (PnF) ChartThis is live and non-repainting Point and Figure Charting tool. The tool has it’s own P&F engine and not using integrated function of Trading View.
Point and Figure method is over 150 years old. It consist of columns that represent filtered price movements. Time is not a factor on P&F chart but as you can see with this script P&F chart created on time chart.
P&F chart provide several advantages, some of them are filtering insignificant price movements and noise, focusing on important price movements and making support/resistance levels much easier to identify.
If you are new to Point & Figure Chart then you better get some information about it before using this tool. There are very good web sites and books. Please PM me if you need help about resources.
Options in the Script
Box size is one of the most important part of Point and Figure Charting. Chart price movement sensitivity is determined by the Point and Figure scale. Large box sizes see little movement across a specific price region, small box sizes see greater price movement on P&F chart. There are four different box scaling with this tool: Traditional, Percentage, Dynamic (ATR), or User-Defined
4 different methods for Box size can be used in this tool.
User Defined: The box size is set by user. A larger box size will result in more filtered price movements and fewer reversals. A smaller box size will result in less filtered price movements and more reversals.
ATR: Box size is dynamically calculated by using ATR, default period is 20.
Percentage: uses box sizes that are a fixed percentage of the stock's price. If percentage is 1 and stock’s price is $100 then box size will be $1
Traditional: uses a predefined table of price ranges to determine what the box size should be.
Price Range Box Size
Under 0.25 0.0625
0.25 to 1.00 0.125
1.00 to 5.00 0.25
5.00 to 20.00 0.50
20.00 to 100 1.0
100 to 200 2.0
200 to 500 4.0
500 to 1000 5.0
1000 to 25000 50.0
25000 and up 500.0
Default value is “ATR”, you may use one of these scaling method that suits your trading strategy.
If ATR or Percentage is chosen then there is rounding algorithm according to mintick value of the security. For example if mintick value is 0.001 and box size (ATR/Percentage) is 0.00124 then box size becomes 0.001.
And also while using dynamic box size (ATR or Percentage), box size changes only when closing price changed.
Reversal : It is the number of boxes required to change from a column of Xs to a column of Os or from a column of Os to a column of Xs. Default value is 3 (most used). For example if you choose reversal = 2 then you get the chart similar to Renko chart.
Source: Closing price or High-Low prices can be chosen as data source for P&F charting.
Chart Style: There are 3 options for chart style: “Candle”, “Area” or “Don’t show”.
As Area:
As Candle:
X/O Column Style: it can show all columns from opening price or only last Xs/Os.
Color Theme: different themes exist => Green/Red, Yellow/Blue, White/Yellow, Orange/Blue, Lime/Red, Blue/Red
Show Breakouts is the option to show Breakouts
This tool detects & shows following Breakouts:
Triple Top/Bottom,
Triple Top Ascending,
Triple Bottom Descending,
Simple Buy/Sell (Double Top/Bottom),
Simple Buy With Rising Bottom,
Simple Sell With Declining Top
Catapult bullish/bearish
Show Horizontal Count Targets: Finds the congestion or consolidation pattern and if there is breakout then it calculates the Target by using Horizontal Count method (based on the width of congestion pattern). It shows how many column exist on congestion area. There is no guarantee that prices will reach the target.
Show Vertical Count Targets: When Triple Top/Bottom Breakouts occured the script calculates the target by using Vertical Count Method (based on the length of the column). There is no guarantee that prices will reach the target.
For both methods there is auto target cancellation if price goes below congestion bottom or above congestion top.
trend is calculated by EMA of closing price of the P&F
Whipsaw protection:
Last options are “Show info panel” and Labeling Offset. Script shows current box size, reversal, and recommanded minimum and maximum box size. And also it shows the price level to reverse the column (Xs <-> Os) and the price level to add at least 1 more box to column. This is the option to put these labels 10, 20, 30, 50 or 100 bars away from the last bar. Labeling content and color change according to X/O column.
do not hesitate to comment.

Efficient Trend Step ChannelIntroduction
The efficient trend-step indicator is a trend indicator that make use of the efficiency ratio in order to adapt to the market trend strength, this indicator originally aimed to remain static during ranging states while fitting the price only when large variations occur. The trend step indicator family unlike most moving averages has a boxy appearance and could therefore not be classified as smooth, this makes it an indicator relatively uninteresting to use as input for other non-trending indicators such as oscillators.
Today a channel indicator making use of the efficient trend-step is proposed, the indicator has an upper and a lower extremity who can be used for breakout or support and resistance methodologies, however we will see that the indicator is sometimes able to return accurate support and resistance levels.
The Indicator
The indicator has the same settings has the efficient trend step indicator, length control the period of the efficiency ratio, fast control the period of the rolling standard deviation used for trending states, slow control the period of the rolling standard deviation used for ranging states, fast should be lower than slow , if both are equal then the indicator is equal to the classical trend step indicator and length does no longer affect the indicator output. Lower values of fast/slow will make the indicator more reactive to small variations thus changing direction more often.
The color changes you can see on the indicator are changed depending on the prior direction took by the indicator output, if the indicator where higher than its precedent value, then the color will be blue until the indicator is lower than its precedent value. Those colors help you have an estimate of the current trend direction.
Channel Calculation And Role
The extremities made from the efficient trend step allow for more advanced trading rules, they can act as stop/target level and can also give a rough estimate of the current market volatility, with wider extremities indicating a more volatile market.
The extremities are made directly from the dev element used by the efficient trend-step, the upper extremity is made by summing the efficient trend step with the value of dev when the efficient trend step change, the lower extremity is made the same way but the value is subtracted instead.
Is it a weird choice ? It sure is strange to see such approach, the absolute rolling average error between the price and the efficient trend step could have been a logical measure but using dev instead is more efficient and also allow for a more adaptive approach which can benefit the support and resistance methodology, the last reason is because i didn't wanted to "denature" the trend-step signature of the indicator.
The figure above represent the measurement used for making the extremities (in green).
Since the previously described measure change only when the efficient trend step change, we can conclude that such measure is representative of a relatively large variation, since the efficient trend step aim to only change when a large variations appear.
We can see that the upper extremity acted as an accurate resistance in this upper variation of AMD,
Here as well, however like other bands indicators it is safer to take into account the current trend direction, a strong uptrend will have less difficulties crossing the upper extremity, therefore it might be better to rely on the support (lower extremity) on an up-trending market (indicator in blue), and on the resistance (upper extremity) on an down-trending market (indicator in orange).
The figure above show support and resistances signals, a cross represent a false signal, while green arrows represent correct ones with their respective direction.
Conclusion
The presented indicator add more possibilities to the interpretation of the efficient trend step, the extremities can act as stop/target level, however this use has to be controlled, and the level should be in accordance to your risk/reward ratio.
Showcasing another trend-step indicator was a real pleasure. Thanks for reading :)

Whale Trading SystemThis script is an advanced version of the distributional blocks script.
In distributional buys and sells:
I used a high - low cloud filter, which makes it more prudent to sell the next sell higher for sells and to buy the next purchase lower for buys.
I also used the Stochastic Money Flow Index function because it also uses volume to separate regions.
The long period is 52 weeks, which is equal to one year,
The short period is one-fourth of its value, which is equal to a financial quarter.
Then the values calculated with these periods are calculated by stochastic - rsi logic within the function, giving us two averages and separating the regions according to crossovers and crossunders .
In buys and sales, the higher your next distributional position size makes your profit more .
In the old system, there was a confusion as it was not divided into zones.
Because we divide into zones here, zone changes are the last stop to free up existing positions, and you must reopen each time you change zones.
And I changed standard distribution days, depending on the price change and the histogram, as StochMFI also took into account the volume.
In this way, there is sustainability.
I am also sharing my educational idea that explains the logic of this system in more detail :
Now that we have been divided into regions, a maximum of 10 pieces will suffice us.
And the regional shifts will allow us to sell and buy all of our position size, and now we will feel much more comfortable.
The most timeframe I find most accurate are the weekly bars.
Even in the example, we see how we have benefited from the sharp drop in bitcoin, while the price is falling, and we have lowered the average with higher-weight purchases than the previous one.
In both buys and sales here, both the histogram intensities and the average of the purchases you have reduced with the transactions, or the earnings you have increased with the sales, guide you.
In areas with high volatility ,if we adjust our positions properly, even if we follow the changes in the region, we will get rid of those situations with few wounds and we will surely catch the trend!
NOTE : Crossover/crossunder and distributional buy/sell alerts added.
Best regards , Noldo.

Volume Flow v3DepthHouse Volume Flow indicator is used to help determine trend direction strictly based on Negative and Positive volume data.
How to Read:
- Moving Average crossovers are used to help determine a possible trend change or retracement.
- The area cloud on the bottom is calculated by the difference of the moving averages. This could be used to help determine the trending volume strength.
- Bright colored volume bars are large volume spikes calculated by the x factor in the options.
Other changes:
- DepthHouse is going open source with numerous of its indicators. This is only one of many!
- Volume is now displayed without being altered for calculations.

Absolute Strength Histogram | jhOriginal ASH code from alexgrover
Some changes:
- Change the price to SMA with Period of 1 with reference to the original MT4 code
- Added a few more MAs

Cronos Trend Aroon by Zekis"The Aroon indicator is a technical indicator that is used to identify when trends are likely to change direction. In essence, the indicator measures the time it takes for the price to reach the highest and lowest points over a given timeframe as a percentage of total time. The indicator consists of the "Aroon up" line, which measures the strength of the uptrend, and the "Aroon down" line, which measures the strength of the downtrend."
Classic Aroon indicator with few changes:
1. Colors for trends: red line and red background = downtrend
green line and green background = uptrend
2. Crossover is signaled with an yellow stripe
3. Alerts are enabled for longs/entries and shorts/exits
Enjoy!
@ Zekis

2xIchimoku Cloud + 4xMA + Williams FractalUpdated version of the previously published multi-indicator which includes
4x Moving Averages
2x Ichimoku Clouds
Bill Williams Fractals
Changes:
-Toggle switches for each indicator on input tab for easy on/off
-MA Type Selector (EMA/SMA/WMA/VWMA)
-Various default style change
Many thanks to both redwraith and jedireza for helping me work out the MA section
www.tradingview.com
www.tradingview.com
Next improvements: Ichimoku settings