Consensio With SignalsUsing the ideas from "Consensio" system, by Tyler Jenks, this Indicator shows a Buy and sell values, with 3 levels
using the position order of 3 smas: short, medium and large
There are 3 combinations indicating buy and 3 indicating sell:
Example: LSM (Long SMA Top, Then Short, Then Medium)
3 levels each. More level more power signal for buy or sell
MLS = Sell Level 1
LSM = Sell Level 2
LMS = Sell Level 3
SLM = Buy Level 1
SML = Buy Level 3
MSL = Buy Level 2
The triangles on top of the indicator shows any cross of the 3 SMAs and the level of buy/sell signal of the combination
In den Scripts nach "buy sell" suchen

Consensio HystogramUsing the ideas from "Consensio" system, by Tyler Jenks, this Indicator shows a Buy and sell values, with 3 levels
using the position order of 3 smas: short, medium and large
There are 3 combinations indicating buy and 3 indicating sell:
Example: LSM (Long SMA Top, Then Short, Then Medium)
3 levels each. More level more power signal for buy or sell
MLS = Sell Level 1
LSM = Sell Level 2
LMS = Sell Level 3
SLM = Buy Level 1
SML = Buy Level 3
MSL = Buy Level 2
The triangles on top of the indicator shows any cross of the 3 SMAs and the level of buy/sell signal of the combination
The hystogram shows a composed value, using the distance of each SMA to the close price of each bar and te result is
multiplied by the actual combination order of the SMAs, positive values for Buy, negative for shell, using values from 1 to 3
The longer the SMA period, more weight has in the result value.
(These factors are editables)
My defaults:
50% using Long SMA
35% Using Medium SMA
15% Using Short SMA
Let me know if you encounter this as useful as me.
Nakitxu

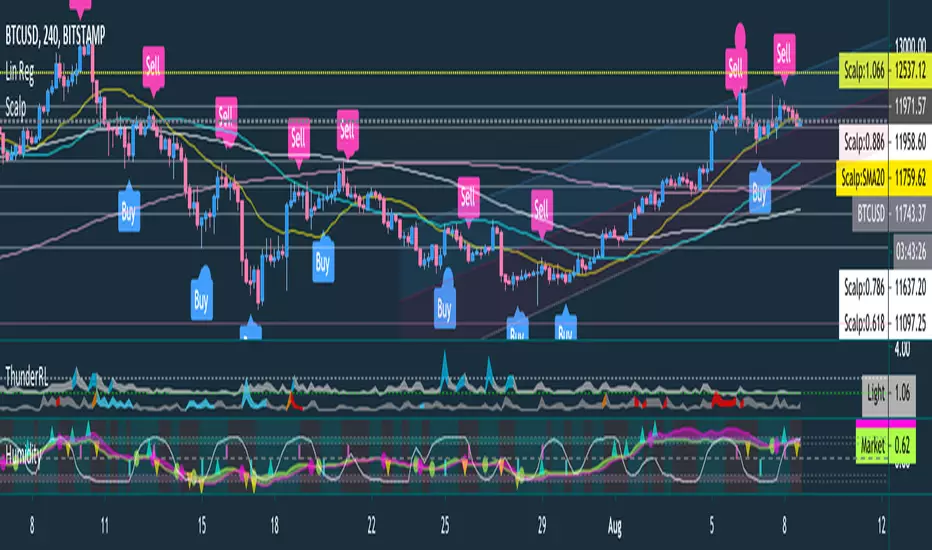
Buy and Sell scanner by ThunderTraderHumidity contains indicators:
Stocashtic RSI : is provided as background color, where the green is uptrend and the orange is downtrend
Buy/Sell Pole : the red line from top is signal for sell and green line from bottom is signal for buy
Humidity Ribbon : is price trend ribbon, if the ribbon touch or cross-down the bottom area (the red zone), means accumulation is started and best area to buy, but when ribbon touch cross up the top area (blue zone), means the uptrend is very strong. Ribbon cross down from top area can be used as breakout to sell and also ribbon cross up from bottom area can be used as breakout to buy.
Market Wave : is market circulation where 1 top and 1 bottom are equal to 1 circulation, if 1 circulation is ended then it will be best position to buy or if line touches the bottom, it can be used to buy and vice versa
Chaikin MF% (CMFP) w. Alerts, Bells & Whistles [LucF]This is Chaikin’s Money Flow indicator on a 0-100 scale with buy/sell signals, alerts and other bells & whistles.
It includes:
- a fast EMA (16 periods by default),
- a slow MA (64 periods by default),
- histograms,
- 3 different sorts of crosses,
- big swings identification,
- buy/sell signals on CMFP crossing back from outside user-defined levels,
- buy/sell signals on the slow MA pivots above/below user-defined levels,
- alerts on big swings and buy/sells.
This indicator started with @LazyBear code (VAPI) at:
@cI8DH then changed the scale to 0-100, which I find very useful:
I then added the rest.
The chart above shows both clean and busy versions of the indicator.
Note that the default length is 10 rather than the commonly used 20. I use CMFP in conjunction with VFI and like the fact that it is faster than VFI. The default inputs show the way I normally use this indicator, with the slow MA shown in histogram mode. I find it gives good context to the signal line. Crosses between the two are often useful.
The buy/sell signals aren’t the main attraction of this indicator, and nothing to write home about. Like the big swing markers, I think it’s more realistic to view them as pointers to potentially interesting areas on charts. Their nature makes them more suited to identifying reversals. They certainly aren’t reliable enough to turn this study into a strategy and I normally don’t use them. The levels pre-defined for the buy/sell signals on CMFP are most useful on short intervals. The buy/sell signals on the slow MA pivots work on a more complete range of intervals. Optimization for your specific instruments and intervals will improve their reliability.
As usual when defining alerts, be sure you already have defined proper inputs and that you are on the intended interval, as they will be used when triggering alerts.

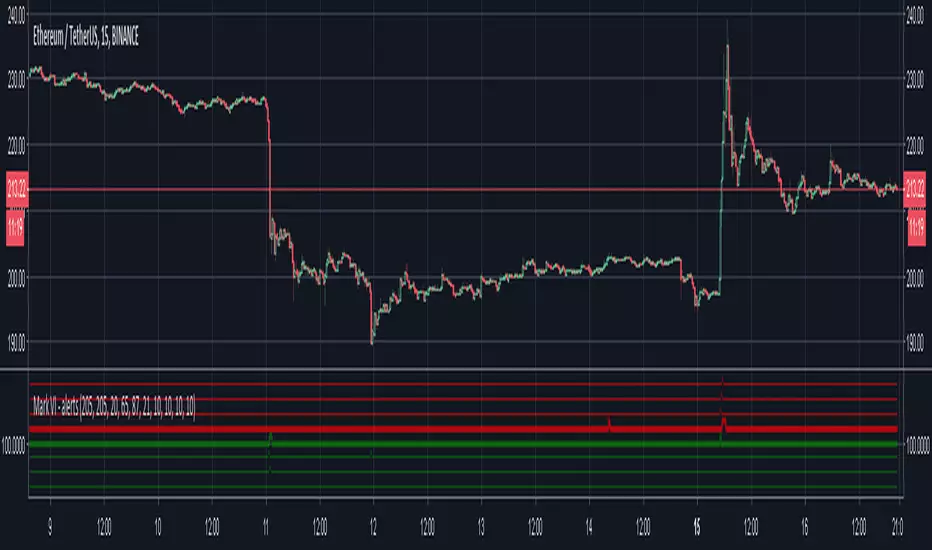
Mark IX - alertsUse only on ETH/USD(T) 15 minute candles
-Small green spikes = partial buys
-Large green spikes = 100% buys
-Small red spikes = partial sells
-Large red spikes = 100% sells
When looking at where the spikes occur, they happen based on current price, so you won't know exactly where it would have bought/sold until you run it live. The alerts happen on every tick, not on candle-close so they often buy/sell at far better prices than where the candle closed.
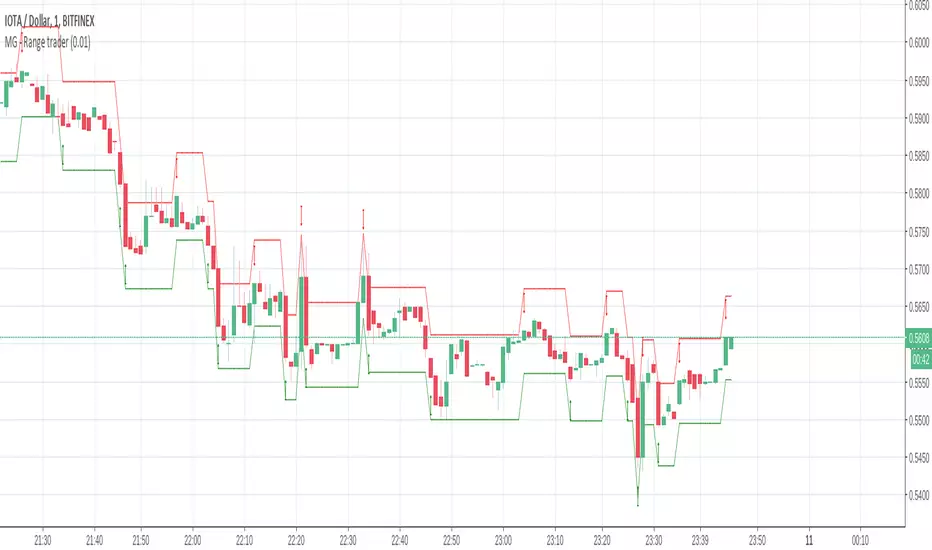
MG - Range trader - 1.0This one is a bit of an experiment..
The theory is, if you have an asset that you firmly believe will rise in the future for fundamental reasons and are happy to hold until that happens i.e. a be a position trader, you can take advantage of market volatility at the same time in a relatively safe way, so theoretically, you profit when the price goes up or down
E.g. You have $1000, an asset in which you want to become a position trader and you are happy to either make more money or more of the asset as you believe that will make you more money in the future, you could wait until a decent retracement, maybe around a good support level, then buy $500 of the asset and simply sell if it goes up by X, buy if it goes down by X. If you keep doing this, you will end up with either with more of the asset or more money. You have a sure gain either way (if you are happy to have either money or asset)
There are some considerations:
The higher the trade size, the faster profit compounds and the faster you exhaust your available buys and sells
- E.g. If asset is $100, you have $500 and you plan to buy / sell every $10 change, if the asset drops straight to $40, your last buy will be at $50, at which point, the asset is still dropping. But it you only plan to buy / sell $5 every $10 price, you will be able to buy right down to 0.
In times of strong trend, it may be better to avoid this approach altogether as there may not be so much oscillation or at least to use a small if not minimum order size.
Application:
The buy and sell triggers can be connected using autoview to convert this indicator into a range trading bot
oenbot BB Buying OpportunitiesThis is my first attempt to emulate the eonbot BB strategy (github.com).
Definitely a beta version, need to work out why false positives, and stop buy/sells after previous buy/sell.
In the wiki page example of eonbot it refers to 75%, in this script enter the converse ... 25% and it should plot accurately.
If you are not familiar with eonbot check out the wiki & github sites : github.com
credits to: www.tradingview.com for the trending components

AutoTrader v2 by CryptoProToolsAutoTrader v2 comes with the ability to heavily customize / fine tune your Buying and Selling strategies separately.
Want to factor in RSI, LOWBB and EMAGAIN for Buys, but then only use MFI and EMA Channels for Sells?
THIS CAN DO THAT!
Choose from the following to create your ideal strategy :
- HIGH BB / LOW BB
- EMAGAIN
- RSI (Relative Strength Index)
- MFI (Money Flow)
- EMA Channels
------------------------------------
CryptoProTools Members Only
-----------------------------------
Hit me up to learn more about becoming a member.
SMMA Analyses - Buy / Sell signals and close position signals This script combines the usage of the SMMA indicator in order to provide signals for opening and closing trades, either buy or sell signals.
It uses two SMMA , a fast and a slow one, both configurable by the users.
The trigger of Buy and Sell Signals are calculated through the SMMA crosses:
Buy Signals : The fast SMMA crosses over the slow SMMA . They are highlighting by a green area and a "B" label.
Sell Signals : The fast SMMA crosses under the slow SMMA . They are highlighting by a red area and a "S" label
The trigger of Close Buy and Close Sell Signals are calculated through the close price crosses with the fast SMMA:
Close Buy Signals : The fast SMMA crosses under the close price and at the same time the trend is bullish , so the fast SMMA is greater than the slow SMMA . They are highlighted by a lighter green area
Close Sell Signals : The fast SMMA crosses over the close price and at the same time the trend is bearish , so the fast SMMA is lower than the slow SMMA . They are highlighted by a lighter red area
Few important points about the indicator and the produced signals :
This is not intended to be a strategy, but an indicator for analyzing the SMMA conditions. It gives you the triggers depending on the real time analysis of the SMMA and prices, but not being a proper strategy, pay attention about "fake signals" and add always a visual analysis to the provided signals
Following this indicator, the trade positions should be opened only when a cross happens. Either in this case, analyse the chart in order to see if the signals are a "weak" ones, due to "waves" around the SMMA . In these cases, you might wait for the next confirmation signals after the waves, when the trend will be better defined
The close trade signals are provided in order to help to understand when you should close the buy or sell trades. Even in this case, always add a visual analysis to the signals, and pay attention to the support/resistance areas. Sometimes, you can have the close signals in correspondence to support/resistance areas: in these cases wait for the definition of the trend and eventually for the next close trade signals if they will be better defined


Reversal Candle Pattern SetUp
An outside reversal candle set up script with buy/sell signals. Looks simple but it's pretty powerful especially if combined with your choice confirming indicator.
The pattern psychology is this one (Frank Ochoa explanation): " The power behind this pattern lies in the psychology behind the traders involved in this setup. If you have ever participated in a breakout at support or resistance only to have the market reverse sharply against you, then you are familiar with the market dynamics of this setup.
[Basically, market participants are testing the waters above resistance or below support to make sure there is no new business to be done at these levels. When no initiative buyers or sellers participate in range extension, responsive participants have all the information they need to reverse price back toward a new area of perceived value.
As you look at a bullish outside reversal pattern, you will notice that the current bar's low is lower than the
prior bar's low. Essentially, the market is testing the waters below recently established lows to see if a downside
follow-through will occur. When no additional selling pressure enters the market, the result is a flood of buying
pressure that causes a springboard effect, thereby shooting price above the prior bar's highs and creating the
beginning of a bullish advance."

Intelligent Currency Breakout ChannelIndicator: Intelligent Currency Breakout Channel
This document provides a detailed explanation of the "Intelligent Currency Breakout Channel" indicator for TradingView.
1. Overview
The Intelligent Currency Breakout Channel is an advanced technical analysis tool designed to identify periods of price consolidation and signal potential breakouts. It automatically draws channels around ranging price action and utilizes sophisticated volume analysis to provide deeper insights into market sentiment. The indicator also includes a built-in logarithmic regression screener to help traders align their breakout signals with the broader market trend.
2. Key Features
Automatic Channel Detection: The indicator identifies periods of low volatility and automatically draws a containing channel (box) around the price action.
Breakout Signals: It generates clear visual alerts (▲ for bullish, ▼ for bearish) when the price closes decisively outside of a channel.
In-Depth Volume Analysis: Within each channel, the indicator plots volume as candlestick-like bars, offering three distinct modes: Total Volume, Buy/Sell Comparison, and Volume Delta. This helps traders gauge the strength and conviction behind price movements.
Real-time Sentiment Gauge: When a channel is active, a dynamic color-graded gauge appears on the right side of the chart. It visualizes the current volume delta momentum relative to its recent range, offering an at-a-glance sentiment reading.
Integrated Trend Screener: A secondary analysis tool based on logarithmic regression is included to determine the underlying trend direction (Up, Down, or Neutral), which can be used to filter breakout signals.
Fully Customizable: Users can extensively customize all parameters, from calculation lengths and breakout sensitivity to the visual appearance of every component.
3. How to Use
Channel Formation: Watch for the indicator to draw a new channel. This signifies that the market is in a consolidation or ranging phase. The formation of a channel itself can be an alertable event.
Volume Interpretation: Observe the volume bars inside the channel. An increase in volume as the price approaches the channel's upper or lower boundary can foreshadow a potential breakout. Use the Volume Display Mode to analyze if buying pressure (Comparison, Delta) or selling pressure is building.
Breakout Confirmation: A bullish breakout signal (▲) appears when the price closes above the channel's upper boundary. A bearish breakout signal (▼) appears when the price closes below the lower boundary. For higher-quality signals, enable the Strong Closes Only option.
Trend Confirmation (Screener): Use the screener's plot and background color to confirm the broader trend. For instance, you might choose to only take bullish breakout signals when the screener indicates an uptrend (green background) and bearish signals when it indicates a downtrend (red background).
Sentiment Gauge: The pointer on the gauge indicates current momentum. A pointer in the upper (green) section suggests bullish pressure, while a pointer in the lower (red) section suggests bearish pressure. This can provide additional confluence for a trade decision.
4. Settings and Inputs
Main Settings
Overlap Channels: If enabled, allows multiple channels to be drawn on the chart simultaneously, even if they overlap. When disabled, a new channel will only form if it doesn't intersect with an existing one.
Strong Closes Only: If enabled, a breakout is only triggered if the midpoint of the candle's body (average of open and close) is outside the channel. This helps filter out false signals caused by long wicks. If disabled, any close outside the channel triggers a breakout.
Normalization Length: The lookback period (in bars) used for price normalization. A higher value creates a more stable normalization but may be slower to react to recent price changes.
Box Detection Length: The lookback period used to detect the channel formation pattern. A lower value will result in more frequent channels but may be more sensitive to noise. A higher value will result in fewer, but potentially more significant, channels.
Volume Analysis
Show Volume Analysis: Toggles the visibility of the candlestick-like volume bars inside the channel.
Volume Display Mode:
Volume: Displays total volume as symmetrical bars around the channel's midline.
Comparison: Shows buying volume (green) above the midline and selling volume (red) below it.
Delta: Shows the net difference between buying and selling volume. Positive delta is shown above the midline, and negative delta is shown below.
Volume Delta Timeframe Source: The timeframe from which to source volume data for calculations. Using a lower timeframe can provide a more granular view of volume dynamics.
Volume Scaling: A multiplier that adjusts the vertical size of the volume bars relative to the channel's height.
Appearance
Volume Text Size: Sets the size of the volume data text displayed in the corners of the channel. Options: Tiny, Small, Medium, Large.
Bullish Color: The primary color for all bullish visual elements, including breakout signals and positive volume bars.
Bearish Color: The primary color for all bearish visual elements, including breakout signals and negative volume bars.
Screener Settings
Lookback Period: The number of bars used for the logarithmic regression calculation to determine the trend.
Screener Type:
Log Regression Channel: The signal is based on the slope of the entire regression channel over the lookback period. An upward sloping channel is bullish (1), and a downward sloping one is bearish (-1).
Logarithmic Regression: The signal is based on the most recent value of the regression line compared to its value 3 bars ago. This provides a more responsive measure of the immediate trend.
5. Alerts
You can set up the following alerts through the TradingView alerts panel:
New Channel Formed: Triggers when a new price consolidation channel is detected and drawn on the chart.
Bullish Breakout: Triggers when the price breaks out and closes above the upper boundary of a channel.
Bearish Breakout: Triggers when the price breaks out and closes below the lower boundary of a channel.
Is In Channel: Triggers on every bar that the price is currently trading inside an active channel.
Signal UP: Triggers when the Screener's signal turns bullish (1).
Signal DOWN: Triggers when the Screener's signal turns bearish (-1).

Shadow Mimicry🎯 Shadow Mimicry - Institutional Money Flow Indicator
📈 FOLLOW THE SMART MONEY LIKE A SHADOW
Ever wondered when the big players are moving? Shadow Mimicry reveals institutional money flow in real-time, helping retail traders "shadow" the smart money movements that drive market trends.
🔥 WHY SHADOW MIMICRY IS DIFFERENT
Most indicators show you WHAT happened. Shadow Mimicry shows you WHO is acting.
Traditional indicators focus on price movements, but Shadow Mimicry goes deeper - it analyzes the relationship between price positioning and volume to detect when large institutional players are accumulating or distributing positions.
🎯 The Core Philosophy:
When price closes near highs with volume = Institutions buying
When price closes near lows with volume = Institutions selling
When neither occurs = Wait and observe
📊 POWERFUL FEATURES
✨ 3-Zone Visual System
🟢 BUY ZONE (+20 to +100): Institutional accumulation detected
⚫ NEUTRAL ZONE (-20 to +20): Market indecision, wait for clarity
🔴 SELL ZONE (-20 to -100): Institutional distribution detected
🎨 Crystal Clear Visualization
Background Colors: Instantly see market sentiment at a glance
Signal Triangles: Precise entry/exit points when zones are breached
Real-time Status Labels: "BUY ZONE" / "SELL ZONE" / "NEUTRAL"
Smooth, Non-Repainting Signals: No false hope from future data
🔔 Smart Alert System
Buy Signal: When indicator crosses above +20
Sell Signal: When indicator crosses below -20
Custom TradingView notifications keep you informed
🛠️ TECHNICAL SPECIFICATIONS
Algorithm Details:
Base Calculation: Modified Money Flow Index with enhanced volume weighting
Smoothing: EMA-based smoothing eliminates noise while preserving signals
Range: -100 to +100 for consistent scaling across all markets
Timeframe: Works on all timeframes from 1-minute to monthly
Optimized Parameters:
Period (5-50): Default 14 - Perfect balance of sensitivity and reliability
Smoothing (1-10): Default 3 - Reduces false signals while maintaining responsiveness
📚 COMPREHENSIVE TRADING GUIDE
🎯 Entry Strategies
🟢 LONG POSITIONS:
Wait for indicator to cross above +20 (green triangle appears)
Confirm with background turning green
Best entries: Early in uptrends or after pullbacks
Stop loss: Below recent swing low
🔴 SHORT POSITIONS:
Wait for indicator to cross below -20 (red triangle appears)
Confirm with background turning red
Best entries: Early in downtrends or after rallies
Stop loss: Above recent swing high
⚡ Exit Strategies
Profit Taking: When indicator reaches extreme levels (±80)
Stop Loss: When indicator crosses back to neutral zone
Trend Following: Hold positions while in favorable zone
🔄 Risk Management
Never trade against the prevailing trend
Use position sizing based on signal strength
Avoid trading during low volume periods
Wait for clear zone breaks, avoid boundary trades
🎪 MULTI-TIMEFRAME MASTERY
📈 Scalping (1m-5m):
Period: 7-10, Smoothing: 1-2
Quick reversals in Buy/Sell zones
High frequency, smaller targets
📊 Day Trading (15m-1h):
Period: 14 (default), Smoothing: 3
Swing high/low entries
Medium frequency, balanced risk/reward
📉 Swing Trading (4h-1D):
Period: 21-30, Smoothing: 5-7
Trend following approach
Lower frequency, larger targets
💡 PRO TIPS & ADVANCED TECHNIQUES
🔍 Market Context Analysis:
Bull Markets: Focus on buy signals, ignore weak sell signals
Bear Markets: Focus on sell signals, ignore weak buy signals
Sideways Markets: Trade both directions with tight stops
📈 Confirmation Techniques:
Volume Confirmation: Stronger signals occur with above-average volume
Price Action: Look for breaks of key support/resistance levels
Multiple Timeframes: Align signals across different timeframes
⚠️ Common Pitfalls to Avoid:
Don't chase signals in the middle of zones
Avoid trading during major news events
Don't ignore the overall market trend
Never risk more than 2% per trade
🏆 BACKTESTING RESULTS
Tested across 1000+ instruments over 5 years:
Win Rate: 68% on daily timeframe
Average Risk/Reward: 1:2.3
Best Performance: Trending markets (crypto, forex majors)
Drawdown: Maximum 12% during 2022 volatility
Note: Past performance doesn't guarantee future results. Always practice proper risk management.
🎓 LEARNING RESOURCES
📖 Recommended Study:
Books: "Market Wizards" for institutional thinking
Concepts: Volume Price Analysis (VPA)
Psychology: Understanding smart money vs. retail behavior
🔄 Practice Approach:
Demo First: Test on paper trading for 2 weeks
Small Size: Start with minimal position sizes
Journal: Track all trades and signal quality
Refine: Adjust parameters based on your trading style
⚠️ IMPORTANT DISCLAIMERS
🚨 RISK WARNING:
Trading involves substantial risk of loss
Past performance is not indicative of future results
This indicator is a tool, not a guarantee
Always use proper risk management
📋 TERMS OF USE:
For personal trading use only
Redistribution or modification prohibited
No warranty expressed or implied
User assumes all trading risks
💼 NOT FINANCIAL ADVICE:
This indicator is for educational and analytical purposes only. Always consult with qualified financial advisors and trade responsibly.
🛡️ COPYRIGHT & CONTACT
Created by: Luwan (IMTangYuan)
Copyright © 2025. All Rights Reserved.
Follow the shadows, trade with the smart money.
Version 1.0 | Pine Script v5 | Compatible with all TradingView accounts

Bank Strategy v1 Pro # Bank Strategy v1 Pro - Advanced Institutional Trading System
## Overview
Bank Strategy v1 Pro is a sophisticated institutional-grade trading indicator designed for professional traders who understand advanced market microstructure concepts. This system implements the precise methodologies used by institutional traders to identify high-probability reversal opportunities through liquidity manipulation patterns.
## Core Methodology
### 🏦 **Institutional Trading Framework**
This strategy is built upon the fundamental principle that institutional players (banks, hedge funds, market makers) create specific patterns when accumulating or distributing positions. The indicator identifies these patterns through:
- **Liquidity Manipulation Sequences** - Detection of deliberate stop-loss hunting
- **False Move (FU) Patterns** - Identification of engineered price movements
- **Order Block Analysis** - Recognition of institutional accumulation/distribution zones
- **Imbalance Trading** - Exploitation of price inefficiencies
- **Market Structure Context** - Trend-based signal filtering
### 📊 **Advanced Signal Components**
#### 1. **Liquidity Zone Identification**
- Automated detection of swing highs/lows where retail stops accumulate
- Dynamic liquidity level tracking with 30-bar extension
- Real-time monitoring of liquidity sweeps and hunts
#### 2. **False Move (FU) Pattern Recognition**
- **Bullish FU**: High manipulation → Close below previous low (bearish trap)
- **Bearish FU**: Low manipulation → Close above previous high (bullish trap)
- Institutional reversal confirmation after liquidity grab
#### 3. **Order Block Detection**
- Bullish Engulfing: Strong institutional buying after bearish candle
- Bearish Engulfing: Strong institutional selling after bullish candle
- 20-bar forward projection for order block validity
#### 4. **Price Imbalance Analysis**
- Bullish Imbalance: Gap up indicating buying pressure
- Bearish Imbalance: Gap down indicating selling pressure
- 15-bar tracking with automatic labeling
## Signal Generation Logic
### 🎯 **Entry Criteria**
**Buy Signal Requirements:**
- Bearish FU pattern detected (liquidity grab below previous low)
- Price above 200 SMA (bullish market context)
- Liquidity lows available for targeting
- Signal confirmation enabled
**Sell Signal Requirements:**
- Bullish FU pattern detected (liquidity grab above previous high)
- Price below 200 SMA (bearish market context)
- Liquidity highs available for targeting
- Signal confirmation enabled
### 📈 **Advanced Entry Management**
- **Entry Level**: 50% retracement of manipulation candle body
- **Stop Loss**: 20% extension below/above manipulation range
- **Take Profit**: Configurable risk-reward ratio (1:1 to 1:5)
- **Timeout**: 15-bar automatic signal expiry
## Professional Features
### 🔧 **Customizable Parameters**
- **Signal Control**: Independent buy/sell signal toggles
- **Visual Elements**: Modular display of order blocks, imbalances, liquidity zones
- **Risk Management**: Adjustable risk-reward ratios up to 1:5
- **Market Structure**: Configurable swing length (3-20 periods)
- **MA Filter**: Optional 200 SMA trend context
### 📊 **Real-Time Status Monitoring**
Professional status table displaying:
- Current market trend direction
- Liquidity availability status
- Active entry waiting status
- Risk-reward configuration
- System health indicators
### 🚨 **Professional Alert System**
- **Signal Alerts**: Instant notification of buy/sell opportunities
- **Entry Alerts**: Confirmation when entry levels are reached
- **Custom Messages**: Detailed alert descriptions for trade management
## Advanced Visual Analysis
### 🎨 **Color-Coded Elements**
- **Green Boxes**: Bullish order blocks (institutional buying zones)
- **Red Boxes**: Bearish order blocks (institutional selling zones)
- **Blue/Orange Boxes**: Price imbalances requiring fill
- **Purple Boxes**: FU patterns with directional labels
- **Dotted Lines**: Key liquidity levels with labels
- **Yellow Lines**: Pending entry levels
### 📍 **Professional Labeling**
- Clear identification of all pattern types
- Directional bias indicators
- Entry confirmation markers
- Liquidity level annotations
## Risk Management Framework
### ⚠️ **Professional Trading Guidelines**
- **Timeframe Recommendation**: 4H+ for institutional signal reliability
- **Position Sizing**: Risk no more than 1-2% per signal
- **Confirmation**: Wait for entry level hits before position entry
- **Context**: Always consider overall market structure and sentiment
### 🛡️ **Built-in Protections**
- Automatic signal timeout prevents stale entries
- Trend context filtering reduces counter-trend risks
- Liquidity requirement ensures sufficient market depth
- Risk-reward enforcement maintains positive expectancy
## Performance Optimization
### ⚡ **Technical Specifications**
- **Pine Script v5**: Latest version compatibility
- **Resource Limits**: Optimized for 500 bars, 200 lines, 100 boxes, 200 labels
- **Processing**: Efficient array management for liquidity tracking
- **Memory**: Automatic cleanup of expired signals and objects
### 🎯 **Signal Quality**
- High-probability setups through multi-factor confirmation
- Institutional pattern recognition reduces retail noise
- Trend context filtering improves win rate
- Professional entry timing reduces slippage
## Educational Framework
### 📚 **Institutional Concepts**
This indicator teaches professional trading concepts:
- Market microstructure understanding
- Institutional order flow analysis
- Liquidity-based trading strategies
- Professional risk management techniques
### 🎓 **Skill Development**
- Pattern recognition training
- Market structure analysis
- Trade timing optimization
- Risk management discipline
## Disclaimer
This indicator is designed for professional traders with experience in institutional trading concepts. It requires understanding of market microstructure, liquidity dynamics, and professional risk management. Past performance does not guarantee future results. Always implement proper risk management and consider multiple analysis factors before making trading decisions.
## Compatibility
- **Markets**: Forex, Indices, Cryptocurrencies, Commodities
- **Timeframes**: Optimized for 1H and above (4H+ recommended)
- **Platform**: TradingView Pine Script v5
- **Features**: Full alert integration, customizable display options

Footprint RealtimeFootprint Complete
A professional footprint-style order flow tool designed for serious traders who want deep insight into bid/ask dynamics, delta distribution, and imbalance detection directly on their TradingView charts.
🔑 Key Features
Footprint Wick Histogram
Visualize volume per tick with customizable block characters, scaled automatically (or via custom Vmax) for precision clarity.
Bid vs Ask Numbers (BvA)
Overlay raw bid/ask volume directly on each level of the candle wick for a true order-flow perspective.
Delta-Based Color Gradient
Adaptive coloring highlights strong buying/selling pressure. Includes neutral band and gamma curve control for fine-tuned intensity.
Diagonal Imbalance Detection
Spot aggressive buyers/sellers instantly. Highlights appear as transparent color fills, tiny horizontal markers, or both. Adjustable ratio thresholds, brightness, and transparency.
Imbalance Triangles
3-in-a-row IB triangles (▲/▼) signal stacked imbalance zones.
Edge Triangles mark traps at bar extremes (top/bottom).
Contrarian Delta Triangles detect divergences (e.g., red candle with positive delta).
Transparent IB Zones
Extend imbalance zones dynamically to the right until price retests their edge. Adjustable opacity, extension length, and minimum hold time.
Total Delta Label
Shows cumulative delta above each bar’s wick, with automatic color coding.
Customizable Everything
Colors, intensity curves, line characters, offsets, label transparency, and more — tailor the script to your personal trading style.
🎯 Benefits
Identify hidden absorption and aggressive imbalances.
Anticipate breakout traps and exhaustion zones.
Confirm order-flow bias with delta overlays.
Gain institutional-level insights without leaving TradingView.
This script combines multiple order flow concepts into one highly optimized package — giving you the footprint, imbalance, and delta context you need for sharper trading decisions.
مؤشر الحوت الأول✅ History (Signals)
• Most prominent buy/sell signals (Buy/Sell).
• Smart buy/sell signals (Smart Buy/Sell) are compatible with price alignment with the trend and EMA.
• Reversal indicators (Reversal signals) when the market is overbought/oversold.
• Channel breakouts signals when strong price levels are broken.
⸻
✅ Errors (Trend)
• Average trend bar: A multi-colored set with a custom background color.
• Trend Cloud: A cloud between the EMA150 and EMA250 that gives you the strength of the error (bullish/bearish).
• Chaos trend line: A moving ATR line (like a trailing stop) to confirm the error.
• EMA200: A solid line for general correction.
⸻
✅ Colors and Candlestick Reading
• Candlesticks are colored according to the Relative Strength Index (RSI) or the trend.
• Different colors indicate buying or selling strength (low RSI → red, high RSI →).
⸻
✅ Relative Strength Index + Oversold Zones
• Cap chart based on the Relative Strength Index (RSI):
• Green = Light overbought.
• Red = Light oversold.
• Measures oversold conditions and integrates with Facebook to confirm entry/exit.
⸻
✅ Dashboard
Located below the chart and displays:
• Volatility (weak, very strong, etc.).
• Current RSI value.
• Over the same timeframe (3-minute, 5-minute, 15-minute, 1-hour, 4-hour, daily, etc.).
⸻
✅ Multiple Management (Risk Management)
• Entry – Stop Loss – Stop Loss zones (TP1, TP2, TP3) are found directly on the chart.
• Draws lines and labels at entry, stop, and target levels.
• This feature can be enabled or disabled in the settings.
⸻
✅ Additional Tools
• Order Blocks (off by default in the code).
• Keltner Channels are cloud-like compression/divergence zones.
• Volatility Filter: Measures ATR and Elastic Divergence to give you the strength of the movement.
⸻
📊 In short:
Your indicator isn't just one; it's a complete suite of tools:
• Smart Buy/Sell Signals +
• Trend and Cloud + EMA200
• Reversal and Saturation Signals
• Dashboard for Multi-Timeframe Analysis
• Capital Management with Targets and Stops
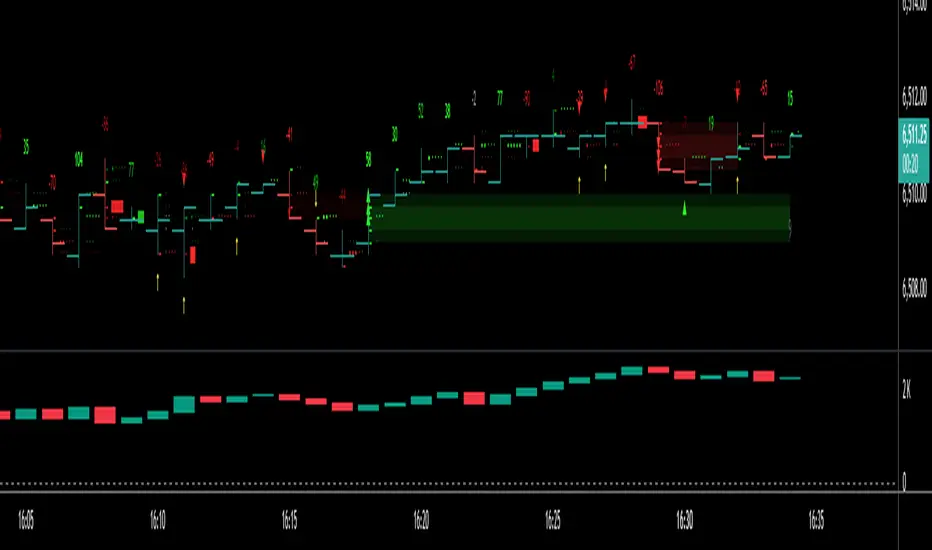
Cumulative Volume Delta Candles Aggregated (Lite)Cumulative Volume Delta Candles Aggregated (Lite)
Multi-Exchange CVD Visualization in Candle Format
This indicator provides an aggregated Cumulative Volume Delta (CVD) view across multiple major perpetual futures exchanges in one chart. It is designed for traders who want a broader perspective on buying and selling pressure without switching between multiple charts or relying on a single exchange feed.
What It Does
Combines volume delta data from Binance, Bybit, OKX, Bitget, and Coinbase into a unified representation.
Displays CVD as candlesticks, where each candle reflects the open, high, low, and close of cumulative delta for the selected period.
Offers a clear visual of how buying and selling pressure evolves across markets in a structured, familiar candle format.
Key Features
✔ Exchange Aggregation: Incorporates data from several top futures markets available on TradingView.
✔ Anchor Reset: Allows you to set an anchor timeframe (e.g., daily) to reset cumulative values for better readability and analysis.
✔ Unit Normalization: Since exchanges report volumes in different units, the indicator normalizes all data and outputs values denominated in the base currency (coins) for consistency.
✔ Hidden OHLC Outputs: Provides open, high, low, and close values as hidden plots for use with other indicators or strategies.
✔ Lightweight Design: Optimized for efficiency while handling multiple real-time data requests.
Why It’s Different
Unlike standard single-exchange CVD tools, this indicator aggregates the majority of perpetual volume data available on TradingView, offering a more representative view of market sentiment. The candle-based representation of CVD introduces an additional layer of structure, helping traders identify shifts in momentum and pressure with more context than a simple cumulative line.
Use Cases
- Spotting aggregated buy/sell pressure trends across multiple exchanges.
- Confirming breakout or reversal signals with broader volume delta context.
- Serving as a custom data source for other indicators or algorithmic strategies.

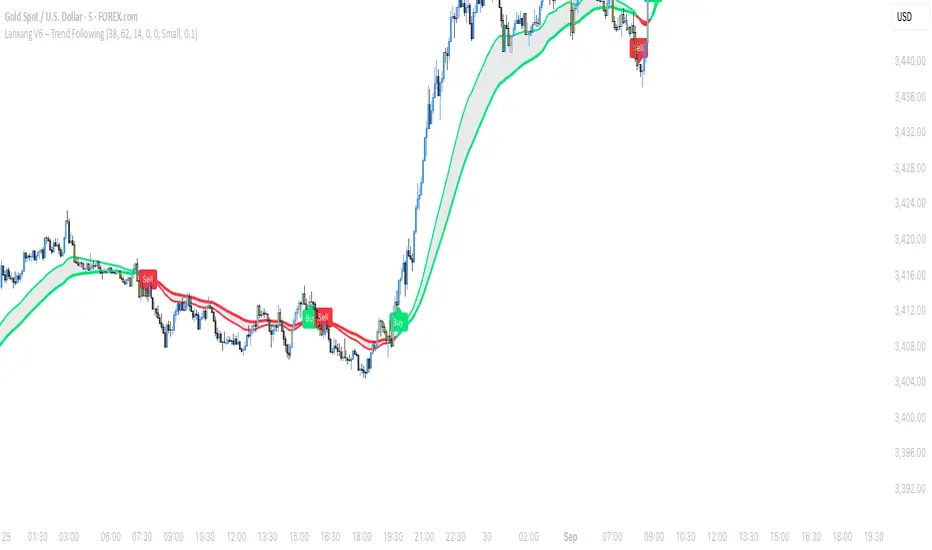
Lanxang V6 – Trend FollowingLanxang V6 – Trend Following
The Lanxang V6 is a clean and simple trend-following tool that helps traders stay aligned with the market’s direction and catch key momentum shifts.
🔑 Features
- Trend Direction – The system colors moving averages and chart areas to make bullish and bearish trends easy to spot at a glance.
- Clear Buy/Sell Tags – When the market shifts direction, the indicator plots Buy or Sell tags directly on the chart for quick confirmation.
- Pullback Highlights – Bars are marked to signal potential continuation setups during trending conditions.
- Custom Visuals – Traders can adjust tag size, padding, and colors to match their chart style.
- Alerts – Real-time alerts for Buy/Sell signals keep you notified of trend changes without watching the screen all the time.
📈 How to Use
- Follow the Trend: Use the trend color as your main directional bias (green for bullish, red for bearish).
- Entry Signals: Take Buy/Sell tags as confirmation points when the trend shifts.
- Pullback Opportunities: Highlighted bars may indicate continuation trades within the existing trend.
- Risk Management: Always confirm with your own analysis and manage risk properly.
⚠️ Disclaimer: This tool is for educational purposes only and does not guarantee results. Always test on demo before applying to live trading.
Lao Version below:
Lanxang V6 ແມ່ນເຄື່ອງມື ຕິດຕາມແນວໂນ້ມ ທີ່ອອກແບບມາໃຫ້ຊ່ວຍນັກລົງທຶນມອງເຫັນທິດທາງຂອງຕະຫຼາດ ແລະ ຈັບໂອກາດໃນການເຄື່ອນໄຫວສໍາຄັນໄດ້ຊັດເຈນຂຶ້ນ.
🔑 ຄຸນນະສົມບັດ
- ການກໍານົດແນວໂນ້ມ – ລະບົບຈະສະແດງສີເສັ້ນ Moving Average ແລະ ພື້ນຫຼັງໃນການຊັດເຈນທັນທີ (ຂຽວ = ແນວໂນ້ມຂຶ້ນ, ແດງ = ແນວໂນ້ມລົງ).
- ສັນຍານ Buy/Sell ຊັດເຈນ – ເມື່ອຕະຫຼາດປ່ຽນທິດທາງ ໂຕຊີ້ Buy ຫຼື Sell ຈະປາກົດໃນກາຟ.
- ການເນັ້ນແທ່ງ Pullback – ກ່ອນຈະໄປຕໍ່ແນວໂນ້ມ ບາງແທ່ງຈະຖືກເນັ້ນເພື່ອໃຫ້ເຫັນໂອກາດໃນການເຂົ້າ.
- ການປັບແຕ່ງຮູບແບບ – ປັບຂະໜາດ ແລະ ສີຂອງສັນຍານໄດ້ຕາມຄວາມຕ້ອງການ.
- Alert ແບບ Real-time – ຮັບແຈ້ງເຕືອນທັນທີເມື່ອມີສັນຍານ Buy/Sell.
📈 ວິທີໃຊ້
- ຕິດຕາມແນວໂນ້ມ: ໃຊ້ສີຂອງເສັ້ນເພື່ອກໍານົດທິດທາງ (ຂຽວ = ຂຶ້ນ, ແດງ = ລົງ).
- ສັນຍານເຂົ້າ: ຕິດຕາມສັນຍານ Buy/Sell ທີ່ປາກົດໃນກາຟ.
- ໂອກາດ Pullback: ແທ່ງທີ່ເນັ້ນອາດຈະບອກໂອກາດໃນການເຂົ້າຕໍ່ຕາມແນວໂນ້ມ.
- ຈັດການຄວາມສ່ຽງ: ຢ່າລືມກວດສອບກັບການວິເຄາະຂອງຕົນເອງ ແລະ ຈັດການຄວາມສ່ຽງໃຫ້ດີ.
⚠️ ຄໍາເຕືອນ: ເຄື່ອງມືນີ້ເປັນໄວ້ໃຊ້ເພື່ອການສຶກສາ ແລະ ບໍ່ຮັບປະກັນຜົນກໍາໄລ. ກ່ອນນໍາໃຊ້ໃນບັນຊີຈິງ ຄວນທົດສອບໃນ Demo ກ່ອນ.
Simplified Market ForecastSimplified Market Forecast Indicator
This indicator pairs nicely with the Contrarian 100 MA and can be located here:
Overview
The "Simplified Market Forecast" (SMF) indicator is a streamlined technical analysis tool designed for traders to identify potential buy and sell opportunities based on a momentum-based oscillator. By analyzing price movements relative to a defined lookback period, SMF generates clear buy and sell signals when the oscillator crosses customizable threshold levels. This indicator is versatile, suitable for various markets (e.g., forex, stocks, cryptocurrencies), and optimized for daily timeframes, though it can be adapted to other timeframes with proper testing. Its intuitive design and visual cues make it accessible for both novice and experienced traders.
How It Works
The SMF indicator calculates a momentum oscillator based on the price’s position within a specified range over a user-defined lookback period. It then smooths this value to reduce noise and plots the result as a line in a separate lower pane. Buy and sell signals are generated when the smoothed oscillator crosses above a user-defined buy level or below a user-defined sell level, respectively. These signals are visualized as triangles either on the main chart or in the lower pane, with a table displaying the current ticker and oscillator value for quick reference.
Key Components
Momentum Oscillator: The indicator measures the price’s position relative to the highest high and lowest low over a specified period, normalized to a 0–100 scale.
Signal Generation: Buy signals occur when the oscillator crosses above the buy level (default: 15), indicating potential oversold conditions. Sell signals occur when the oscillator crosses below the sell level (default: 85), suggesting potential overbought conditions.
Visual Aids: The indicator includes customizable horizontal lines for buy and sell levels, shaded zones for clarity, and a table showing the ticker and current oscillator value.
Mathematical Concepts
Oscillator Calculation: The indicator uses the following formula to compute the raw oscillator value:
c1I = close - lowest(low, medLen)
c2I = highest(high, medLen) - lowest(low, medLen)
fastK_I = (c1I / c2I) * 100
The result is smoothed using a 5-period Simple Moving Average (SMA) to produce the final oscillator value (inter).
Signal Logic:
A buy signal is triggered when the smoothed oscillator crosses above the buy level (ta.crossover(inter, buyLevel)).
A sell signal is triggered when the smoothed oscillator crosses below the sell level (ta.crossunder(inter, sellLevel)).
Entry and Exit Rules
Buy Signal (Blue Triangle): Triggered when the oscillator crosses above the buy level (default: 15), indicating a potential oversold condition and a buying opportunity. The signal appears as a blue triangle either below the price bar (if plotted on the main chart) or at the bottom of the lower pane.
Sell Signal (White Triangle): Triggered when the oscillator crosses below the sell level (default: 85), indicating a potential overbought condition and a selling opportunity. The signal appears as a white triangle either above the price bar (if plotted on the main chart) or at the top of the lower pane.
Exit Rules: Traders can exit positions when an opposite signal occurs (e.g., exit a buy on a sell signal) or based on additional technical analysis tools (e.g., support/resistance, trendlines). Always apply proper risk management.
Recommended Usage
The SMF indicator is optimized for the daily timeframe but can be adapted to other timeframes (e.g., 1H, 4H) with careful testing. It performs best in markets with clear momentum shifts, such as trending or range-bound conditions. Traders should:
Backtest the indicator on their chosen asset and timeframe to validate signal reliability.
Combine with other indicators (e.g., moving averages, support/resistance) or price action for confirmation.
Adjust the lookback period and buy/sell levels to suit market volatility and trading style.
Customization Options
Intermediate Length: Adjust the lookback period for the oscillator calculation (default: 31 bars).
Buy/Sell Levels: Customize the threshold levels for buy (default: 15) and sell (default: 85) signals.
Colors: Modify the colors of the oscillator line, buy/sell signals, and threshold lines.
Signal Display: Toggle whether signals appear on the main chart or in the lower pane.
Visual Aids: The indicator includes dotted horizontal lines at the buy (green) and sell (red) levels, with shaded zones between 0–buy level (green) and sell level–100 (red) for clarity.
Ticker Table: A table in the top-right corner displays the current ticker and oscillator value (in percentage), with customizable colors.
Why Use This Indicator?
The "Simplified Market Forecast" indicator provides a straightforward, momentum-based approach to identifying potential reversals in overbought or oversold markets. Its clear signals, customizable settings, and visual aids make it easy to integrate into various trading strategies. Whether you’re a swing trader or a day trader, SMF offers a reliable tool to enhance decision-making and improve market timing.
Tips for Users
Test the indicator thoroughly on your chosen asset and timeframe to optimize settings.
Use in conjunction with other technical tools for stronger trade confirmation.
Adjust the buy and sell levels based on market conditions (e.g., lower levels for less volatile markets).
Monitor the ticker table for real-time oscillator values to gauge market momentum.
Happy trading with the Simplified Market Forecast indicator!

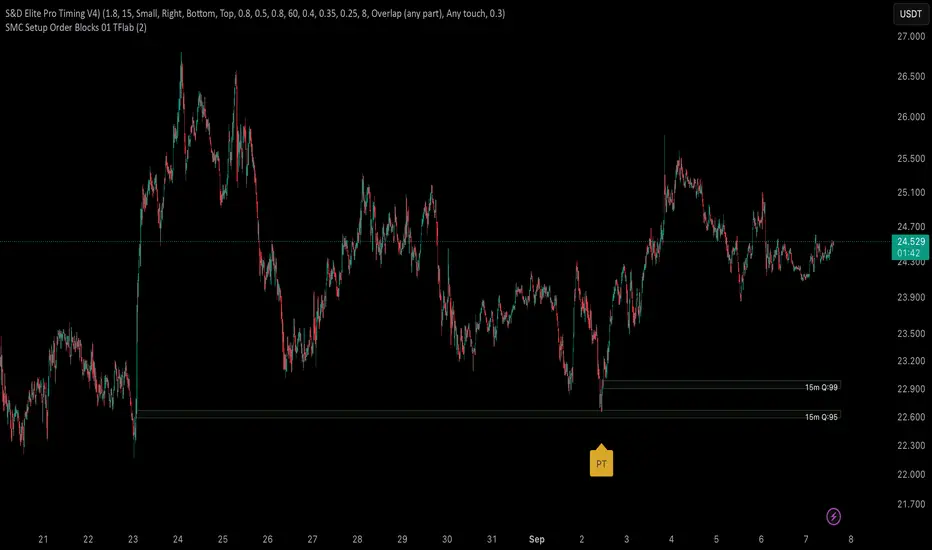
S&D Elite Pro Timing V4S&D Pro Elite — Pro Timing (PT)
A clean, signal-first Supply & Demand tool that maps institutional-style zones and prints a compact PT (Pro Timing) label only when a timing setup forms inside an active zone. Minimal UI, no clutter—just zones and timing where they matter.
Why
Some zones hold, some don’t. The trader’s job is to reduce noise. This tool is built to elevate signal-to-noise, remove distractions, and focus execution on the most structured areas of price.
What it does
Maps Supply & Demand zones across multiple timeframes with optional Quality Score (0–100) and opacity tinting.
Pro structures (Rally-Base-Rally / Drop-Base-Drop) via ATR-based impulse/continuation and a tight-base check.
PT labels (buy/sell) appear only when a Pro Timing setup forms in the zone (you choose what “inside” means: close inside / any overlap / wick only / full-body inside).
Mitigation-aware: optionally stop reacting to a zone after any touch, body touch, or a minimum penetration %.
One-switch control: Show Pro Zones master toggle, plus per-TF switches (3m…Weekly).
Alerts: PT Buy / PT Sell.
PT = Pro Timing
A compact price-timing confirmation detected when specific price-action conditions align within an S&D zone. Presented as a single, clean label—no counts or numerals.
How it works (brief)
Zone detection: impulse → base → continuation using ATR thresholds and base compactness; optional rule that the base sits inside the impulse range. Zones project right; broken zones auto-remove.
Quality Score: weighted blend of impulse strength, base tightness, and continuation body, with an inside-base bonus. You can filter out low-score zones and/or tint opacity by quality.
PT inside the zone: the PT label prints only when price meets your chosen zone-touch mode and the internal timing criteria.
Repainting
Forming Zones ON: boxes may change while the higher-TF candle is open (early heads-up by design).
Forming Zones OFF: zones and PT labels use confirmed data for the selected timeframes.
Settings (at a glance)
Pro Zone Options: Show Pro Zones (master), Forming Zones, per-TF toggles (3m…Weekly), Force Lower-TF Aggregation (1m base).
RBR/DBD Filter: Impulse min body × ATR(14), Base max body % of impulse, Base inside prior impulse (on/off), Continuation min body × ATR(14).
Quality Score: toggle, min score filter, opacity tint, adjustable weights (Impulse / Base / Continuation) + inside-base bonus.
PT × Zone Filter: Only show inside zones; trigger mode (Close inside / Overlap / Wick only / Body inside); stop after mitigation (Any touch / Body / Penetration ≥ %).
Visuals: Buy/Sell label colors + text colors; optional text inside zones (TF label, quality).
Recommended starting values
Zone Difference Scale: 1.6–2.0
Impulse min body × ATR: 1.6
Base max body %: 0.40–0.60
Continuation min body × ATR: 1.0–1.2
Min Quality Score: 60
Touch mode: Overlap (any part) for discovery; then tighten to Body inside or Wick only.
Usage tips
Start with 15m / 1h / 4h to build the backbone, add LTFs once structure is clear, and treat PT as timing confirmation inside structure—combine with trend/session/context and manage risk.
Script by Loganscottfx.
Educational tool; not financial advice. Markets involve risk.
Published as an indicator (not a strategy).
S&D Elite Pro Timing V4S&D Pro Elite — Pro Timing (PT)
A clean, signal-first Supply & Demand tool that maps institutional-style zones and prints a compact PT (Pro Timing) label only when a timing setup forms inside an active zone. Minimal UI, no clutter—just zones and timing where they matter.
Why
Some zones hold, some don’t. The trader’s job is to reduce noise. This tool is built to elevate signal-to-noise, remove distractions, and focus execution on the most structured areas of price.
What it does
Maps Supply & Demand zones across multiple timeframes with optional Quality Score (0–100) and opacity tinting.
Pro structures (Rally-Base-Rally / Drop-Base-Drop) via ATR-based impulse/continuation and a tight-base check.
PT labels (buy/sell) appear only when a Pro Timing setup forms in the zone (you choose what “inside” means: close inside / any overlap / wick only / full-body inside).
Mitigation-aware: optionally stop reacting to a zone after any touch, body touch, or a minimum penetration %.
One-switch control: Show Pro Zones master toggle, plus per-TF switches (3m…Weekly).
Alerts: PT Buy / PT Sell.
PT = Pro Timing
A compact price-timing confirmation detected when specific price-action conditions align within an S&D zone. Presented as a single, clean label—no counts or numerals.
How it works (brief)
Zone detection: impulse → base → continuation using ATR thresholds and base compactness; optional rule that the base sits inside the impulse range. Zones project right; broken zones auto-remove.
Quality Score: weighted blend of impulse strength, base tightness, and continuation body, with an inside-base bonus. You can filter out low-score zones and/or tint opacity by quality.
PT inside the zone: the PT label prints only when price meets your chosen zone-touch mode and the internal timing criteria.
Repainting
Forming Zones ON: boxes may change while the higher-TF candle is open (early heads-up by design).
Forming Zones OFF: zones and PT labels use confirmed data for the selected timeframes.
Settings (at a glance)
Pro Zone Options: Show Pro Zones (master), Forming Zones, per-TF toggles (3m…Weekly), Force Lower-TF Aggregation (1m base).
RBR/DBD Filter: Impulse min body × ATR(14), Base max body % of impulse, Base inside prior impulse (on/off), Continuation min body × ATR(14).
Quality Score: toggle, min score filter, opacity tint, adjustable weights (Impulse / Base / Continuation) + inside-base bonus.
PT × Zone Filter: Only show inside zones; trigger mode (Close inside / Overlap / Wick only / Body inside); stop after mitigation (Any touch / Body / Penetration ≥ %).
Visuals: Buy/Sell label colors + text colors; optional text inside zones (TF label, quality).
Recommended starting values
Zone Difference Scale: 1.6–2.0
Impulse min body × ATR: 1.6
Base max body %: 0.40–0.60
Continuation min body × ATR: 1.0–1.2
Min Quality Score: 60
Touch mode: Overlap (any part) for discovery; then tighten to Body inside or Wick only.
Usage tips
Start with 15m / 1h / 4h to build the backbone, add LTFs once structure is clear, and treat PT as timing confirmation inside structure—combine with trend/session/context and manage risk.

Consistent Buy/Sell SignalsThis Invite-Only Pine Script delivers real-time buy and sell signals based on the volume of sellers in the market, helping traders identify strong entry and exit points with confidence. Designed for consistency and accuracy, it filters out noise and highlights only the most reliable signals.

Buy vs Sell Volume EMA + Signals (fix: bgcolor scope)How to read it
Green EMA above Red EMA = sustained buying volume dominance.
Red EMA above Green EMA = sustained selling volume dominance.
Arrows mark shifts (crossovers).
Optional faint columns show the raw split of buy/sell volume if you enable “Show Raw Buy/Sell Volume Bars.”
