Volume Status by BobRivera990This indicator is a tool that shows a relative view of the trading volume and classifies the volume into 5 different levels and makes it easy to compare it in different periods.
It is also specifically designed for detecting failed (fake) breakouts.
How it works?
This tool uses something similar to Bollinger Bands , but with more bands.
I used two standard deviations (positive and negative) on either side of a simple moving average ( SMA ) of the trading volume .
I also used twice the standard deviation (negative and positive) on either side of the SMA to create more bands.
The classification is made as follows:
Usage:
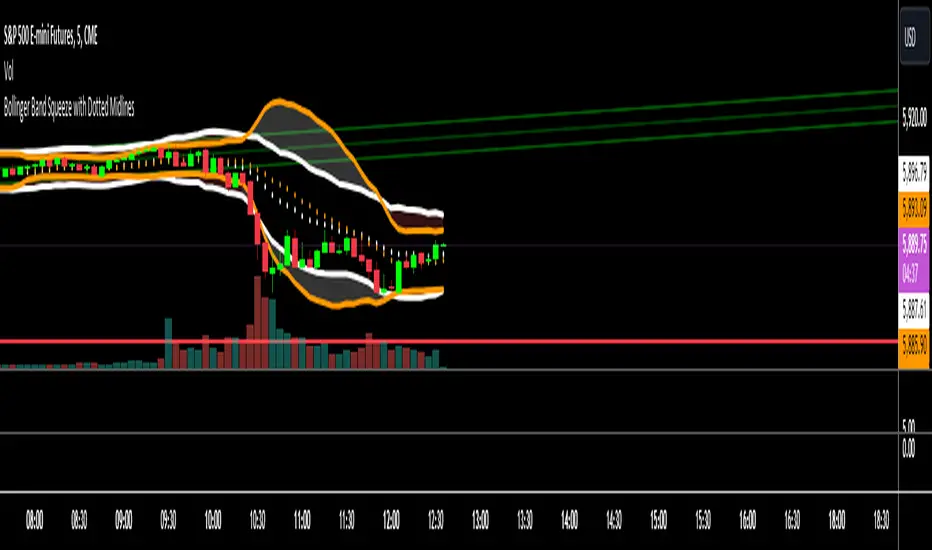
This indicator is a tool to compare the volume , relatively and in different periods. It is also a good tool for detecting failed (fake) breakouts.
Fake Breakouts Occurs when a support or resistance is broken but the market does not accept and support these price changes. This lack of support will cause trading volume to decrease during or after the breakout.
So, if the indicator shows Low-Volume or Minor-Volume status at the time of the breakout or right after that, it may be a fake breakout.
The truth is you cannot avoid false breakouts completely as long as you trade breakouts but you can minimize the risk and the loss.
Thank you all for forming this unique community.
Parameters:
" Volume SMA Length " => The length of the simple moving average of the Volume
Pine Script® Indikator