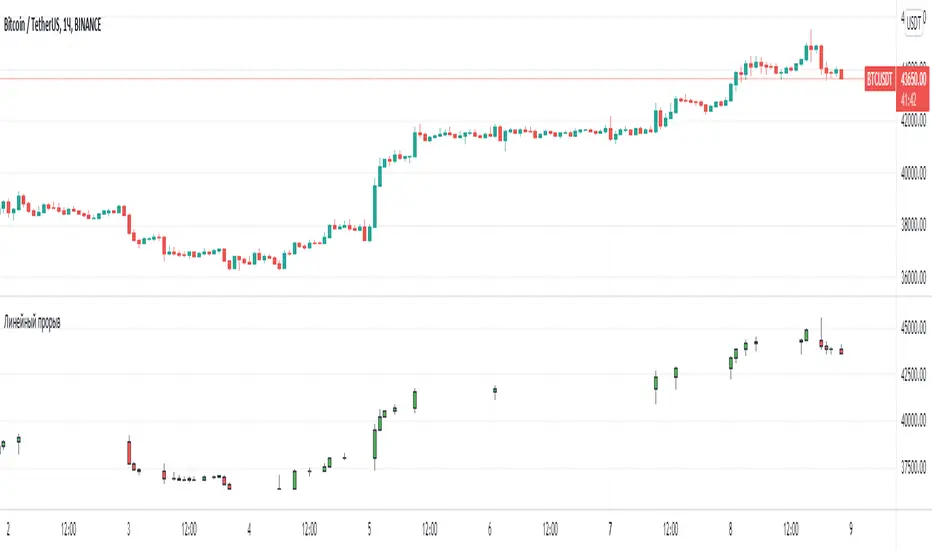
Line breakI decided to help TradingView programmers and wrote code that converts a standard candles / bars to a line break chart. The built-in linebreak() and security() functions for constructing a Linear Break chart are bad, the chart is not built correctly, and does not correspond to the Line Breakout chart built into TradingView. I’m talking about simulating the Linear Break lines using the plotcandle() annotation, because these are the same candles without shadows. When you try to use the market simulator, when the gaps are turned on in the security() function, nothing is added to the chart, and when turned off, a completely different line break chart is drawn. Do not try to write strategies based on the built-in linebreak() function! The developers write in the manual: "Please note that you cannot plot Line Break boxes from Pine script exactly as they look. You can only get a series of numbers similar to OHLC values for Line Break charts and use them in your algorithms." However, it is possible to build a “Linear Breakthrough” chart exactly like the “Linear Breakthrough" chart built into TradingView. Personally, I had enough Pine Script functionality.
For a complete understanding of how such a graph is built, you can refer to Steve Nison's book “BEYOND JAPANESE CANDLES” and see the instructions for creating a “Three-Line Breakthrough” chart (the number of lines for a breakthrough is three):
Rule 1: if today's price is above the base price (closing the first candle), draw a white line from the base price to the new maximum price (before closing).
or Rule 2: if today's price is below the base price, draw a black line from the base price to the new low of prices (before closing).
Rule 3: if today's price is no different from the base, do not draw any line.
Rule 4: if today's price rises above the maximum of the first line, shift to the column to the right and draw a new white line from the previous maximum to the new maximum of prices.
Rule 5: if the price is below the low of the first line, move one column to the right and draw a new black line down from the previous low to the new low of prices.
Rule 6: if the price is kept in the range of the first line, nothing is applied to the chart.
Rule 7: if the market reaches a new maximum, surpassing the maximum of previous lines, move to the column to the right and draw a new white line up to a new maximum.
Rule 8: if today's price is below the low of previous lines (i.e. there is a new low), move to the right column and draw a new black line down to a new low.
Rule 9: if the price is in the range of the first two lines, nothing is applied to the chart.
Rule 10: if there is a series of three white lines, a new white line is drawn when a new maximum is reached (even if it is only one tick higher than the old one). Under the same conditions, for drawing a black reversal line, the price should fall below the minimum of the series of the last three white lines. Such a black line is called a black reversal line. It runs from the base of the highest white line to a new low of price.
Rule 11: if there is a series of three black lines, a new black line is drawn when a new minimum is reached. Under the same conditions, for drawing a white line, called a white reversal line, the price must exceed the maximum of the previous three black lines. This line is drawn from the top of the lowest black line to a new high of the price.
So, the script was not small, but the idea is extremely simple: if you need to break n lines to build a line, then among these n lines (or less, if this is the beginning of the chart), the maximum or minimum of closures and openings will be searched. If the current candles closed above or below these highs or lows, then a new line is added to the chart on the current candles (trend or breakout). According to my observations, this script draws a chart that is completely identical to the Line Breakout chart built into TradingView, but of course with gaps, as there is time in the candles / bar chart. I stuffed all the logic into a wrapper in the form of the get_linebreak() function, which returns a tuple of OHLC values. And these series with the help of the plotcandle() annotation can be converted to the "Linear Breakthrough" chart. I also want to note that with a large number of candles on the chart, outrages about the buffer size uncertainty are heard from the TradingView black box. Because of this, in the annotation study() set the value to the max_bars_back parameter.
In general, use it (for example, to write strategies)!
In den Scripts nach "break" suchen
CME Equity Futures Price Limits
Breakers for CME's futures contracts. Should work on CST/EST/UTC charts.
CME says it uses the last 30 seconds of the session to grab a reference price, so I took the open of the last session's candle because it's easier.
Out of session breakers: +/-5%
Limit downs: -7%/-13%/-20%
There are some minor nuances for the later part of the NY session but I don't really care to add that in right now.
Options:
- Input a manual reference price to override the selected price for accuracy.
- Show only the current/last session's limits. This breaks the in session limit down lines.
Live prices:
www.cmegroup.com
Month codes:
www.cmegroup.com
Reference:
www.cmegroup.com
It's best to check the last updated reference price to ensure it's correct.

Volume w/ Threshold and Editable MA PeriodJust a simple script that tweaks the original Volume one.
The purpose is creating a threshold which we'll use to put an alert on. This way, we can be notified whether Volume pumps.
Useful for spotting breakouts, breakdowns and pumps.
Threshold is simply a coeff * ma(volume,period). Coeff is editable as well.
Hope this helps!

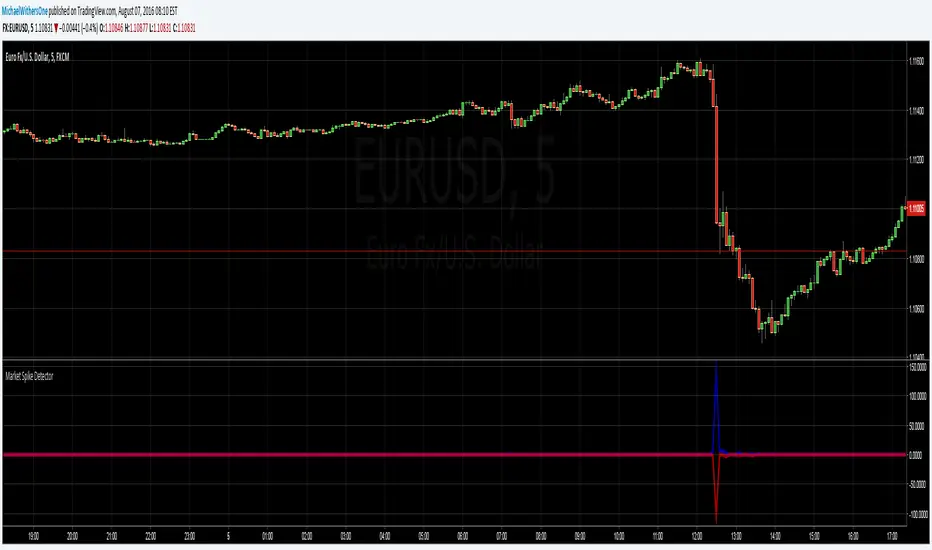
Seismic Market Spike Detector v1.0 Seismic Market Spike Detector v1.0
This indicator helps identify spikes in market activity , typified by bars with extreme open / close or high / low prices.
This indicator plots 2 lines. The Blue line simply depicts extreme price movements with in that bar regardless of the initial opening price of the closing price of the bar. This allows you to get an insight into the current volatility of the price at that time in the market. Quite often big price swings with in bars are missed as people pend to tunnel vision on the open or close price - or other indicators derived from open / close.
The Red line is similar to the blue bar as it depicts extreme price movements with in the bar , but it will show the direction the market moved in by the close of the bar - and relatively how much the market moved. This is helpful for spotting breakout price action or short term spikes. Quite often after a breakout the market will restore itself to an equilibrium in the opposite direction. Sometimes this happens with an opposing aggressive spike , some times it makes a steady return to a known price level. Either way its a great time to place entry orders if you are looking to turn a fast profit or alternatively a good warning of forth coming price volatility.
Here are some tips for analysing the red and blue lines :
1)If the red line is pointing upwards , this indicates a sharp rise in the price.
2)If the red line is pointing downwards , this indicates a sharp fall in the price.
3)If the red line is flat but the blue line is spiked in either direction - this indicates the price was volatile with in the bar , but the price closed relatively near to the surrounding price bars. Perhaps a limit / stop triggered by this kind of activity - this is an easy way to determine why and re-enter.
4)If the red and the blue lines are flat - the price is steadily moving with a trend or trading sideways in a confined range.
ORB Breakout Strategy📊 Overview
📈 Systematic intraday Opening Range Breakout (ORB) strategy
🧭 Designed for index CFDs (e.g. US500)
⏱️ Optimized for 5-minute charts during regular trading hours
🛡️ Strict risk management and position sizing
🚦 Maximum one trade per day
💡 Core Idea
🌅 The market establishes a key price range shortly after the open
🚀 A confirmed breakout from this opening range can signal directional momentum
🎯 The strategy trades only confirmed breakouts with predefined risk
📐 Opening Range Definition
⏰ Opening range is defined between 09:30 and 09:45 (exchange time)
🕯️ Uses the first three 5-minute candles of the session
⬆️ Opening Range High is the highest high of those candles
⬇️ Opening Range Low is the lowest low of those candles
🟢 Long Trade
📊 A 5-minute candle closes above the Opening Range High
🟩 A Fair Value Gap (FVG) exists relative to the candle 10 minutes earlier
🧲 A buy limit order is placed at the Opening Range High
🔴 Short Trade
📉 A 5-minute candle closes below the Opening Range Low
🟥 A Fair Value Gap (FVG) exists relative to the candle 10 minutes earlier
🧲 A sell limit order is placed at the Opening Range Low
🛑 Stop Loss
📉 Long trades use the low of the candle 10 minutes before the breakout
📈 Short trades use the high of the candle 10 minutes before the breakdown
🎯 Take Profit
⚖️ Fixed reward-to-risk ratio of 2:1
📏 Take profit distance equals two times the stop loss distance
💰 Position Sizing
💵 Fixed dollar risk per trade (default: $2,000)
📐 Position size is calculated dynamically based on stop loss distance
🔁 Risk remains consistent across changing volatility conditions
⏳ Trade Management Rules
🚦 Maximum one trade per day, including same-bar entries and exits
🕛 No new entries after 12:00 (exchange time)
⏰ All open positions are closed at 15:50
❌ Pending orders are cancelled after the entry cutoff or at session end
⚙️ Execution & Costs
💸 Commission model can be configured in the strategy settings
🧪 Backtests use TradingView Strategy Tester mechanics
📝 Notes
📚 This is a rules-based trading strategy, not a signal service
🔍 Results depend on instrument, broker feed, spreads, and commissions
🧠 Forward testing is strongly recommended before live trading
⚠️ Disclaimer
📖 This script is provided for educational and research purposes only
🚫 It does not constitute financial advice
🔥 Trading leveraged instruments involves significant risk

Micha Stocks Buyers Breakout RatingMicha Stocks Buyers Breakout Rating (ByBr)
========================================
This indicator is a custom rating system designed to identify high-probability "Buy" setups by analyzing Volume Conviction, Price Action, and Seller Exhaustion. It assigns a rating from 4 to 10 for every valid signal, helping traders filter out weak breakouts and focus on high-conviction moves.
How it Works The script uses a multi-tiered logic system to grade every green candle:
1. Volume Tiers (The Engine)
--Extreme Conviction (Rating 10): Volume is 2.5x higher than the short-term average.
--High Conviction (Rating 7-8): Volume is 1.5x higher than the short-term average.
2. Sustained Accumulation (Rating 5-6) Identifies persistent buying pressure where the last X -----bars (default 5) have all been green/up candles.
--Bonus Points The script awards extra points to the base rating for high-quality candle shapes:
--Strong Close: Price closes in the top 25% of the daily range.
--Hammer Candle: Long lower wick (rejection of lows) with a small body.
3. Seller Exhaustion (The Reversal - Rating 3-4) This logic identifies "dip buys" where sellers have lost control. It requires:
--Downtrend: Price is below the recent high.
--Confirmation: Either a "Volume Washout" (recent panic selling) or a "Supply Dry Up" (volume dropping below average).
How to Use
--------------
Look for Triangles: A triangle appears below the bar when a signal is detected.
Read the Number: The number (4-10) indicates the strength of the signal.
10: Extreme Volume Breakout (highest confidence).
7-8: Strong Volume Breakout.
4: Reversal/Dip Buy opportunity (Seller Exhaustion).
Tooltip: Hover over the label to see exactly which logic triggered the signal (e.g., "Extreme Conviction" vs "Sustained Accumulation").
Settings
----------
Short Lookback: Adjust the sensitivity of the trend detection (Default: 5).
Volume Multipliers: Adjust how strict the volume requirements are for high ratings.

Smart S&D v1.0 [Breaker Blocks]Automatically marks off supply and demand zones based on previous and consequent candles.
Previous and consequent candles can be changed.
Recommend 5:3 for 15m, or 7:5 for 10m
ATR default 1
Volume confirmation off by default but there as an option
The number on bars is the number of times price has bounced off the zone. After 3 bounces (this can be changed/personalized in settings) the zone is exhausted and removed.
If price breaks through a zone, it becomes a breaker zone, flipping supply to demand, or demand to supply. Ideal for a break and retest setup.

Volume Edge Pro[wjdtks255]Volume Edge Pro: Indicator Description
Volume Edge Pro is an advanced volume analysis tool designed to identify institutional accumulation and significant supply levels. Unlike standard volume bars, this indicator categorizes trading volume into four distinct types based on price action and historical comparisons, helping traders spot high-probability breakout opportunities.
Key Components:
Blue Bars (PPV - Pocket Pivot Volume): Indicates institutional accumulation. It appears when up-day volume exceeds the highest down-day volume of the last 10 trading sessions.
Green Bars (RGV - Recent Green Volume): Represents strong buying pressure where up-day volume is higher than the 50-period moving average.
Red Bars (RRV - Recent Red Volume): Signifies heavy supply or selling pressure where down-day volume is higher than the 50-period moving average.
Grey Bars: Represents standard market volume without significant institutional involvement.
Trading Strategy (How to Trade)
1. Identifying Accumulation (The Base)
Look for multiple Blue Bars (PPV) during a consolidation phase or within a "base." This suggests that "Smart Money" is quietly accumulating shares without significantly driving up the price yet.
2. The Buy Signal
The ideal entry point is when the price breaks out of a consolidation resistance level, especially when the breakout is confirmed by a Blue (PPV) or Green (RGV) bar. The presence of PPV signals within the base increases the reliability of the breakout.
3. Overcoming Supply (The RRV Rule)
When a Red Bar (RRV) appears, it marks a level of "unconsumed supply."
Treat the high of the RRV candle as a resistance level.
A bullish reversal or continuation is confirmed only when the price reclaims the high of the RRV day or when subsequent PPVs/RGVs overwhelm the previous selling volume.
4. Risk Management
If a massive Red Bar (RRV) appears after a long uptrend and the price breaks below the prior support, it may indicate institutional distribution (selling), signaling a time to exit or tighten stop-losses.

MTF Candle Body Break WITH 20SMAMTF Candle Body Break WITH 20SMA: Complete Guide
This indicator is a professional-grade market environment analysis tool designed to synchronize "Market Structure" and "Momentum" across multiple timeframes (MTF).
1. Core Logic: Candle Body Break
Unlike traditional high/low breakouts that include wicks, this tool focuses exclusively on "Body Breaks" (Closing prices).
Logical Basis: Wicks often represent temporary noise. A closing price break signifies a genuine shift in market consensus.
Visualization: * Blue Lines: Bullish Structure.
Red Lines: Bearish Structure.
Gray/Black Lines: Historical breakout levels that often act as future Support or Resistance (S/R Flip).
2. Triple 20SMA System
The indicator automatically plots three generations of 20-period SMAs relative to your current chart.
Short-term (Black): 15-Min 20SMA (On a 1H chart). This acts as the "immediate support" for a strong trend.
Mid-term (Blue): Current TF 20SMA. The backbone of the trend.
Long-term (Red): Higher TF 20SMA. The major trend direction.
3. The Dashboard System (Three Components)
The right side of the screen features a three-part visual system to confirm trend alignment:
① Top-Right Panel: Long-Term Signal
Compares Daily (1D) and 4-Hour (4H) structure.
Blue: Both are bullish.
Red: Both are bearish.
② Middle-Right Bar: Momentum Signal (The "Final Filter")
This vertical bar represents the SMA 10/20 Sync.
Blue: The SMA 10 is above the SMA 20 on the 1-Hour chart. This indicates that short-term momentum is accelerating upward.
Red: The SMA 10 is below the SMA 20. This indicates downward acceleration.
Gray: No clear momentum (ranging or indecisive).
③ Bottom-Right Panel: Short-Term Signal
Compares 1-Hour (1H) and 15-Minute (15M) structure.
Blue: Both are bullish.
Red: Both are bearish.
4. Entry Signal: The "●" (Dot)
The "●" signal is the "Perfect Alignment" trigger. It appears when:
Long-term (Daily/4H) is aligned.
Short-term (1H/15M) is aligned.
Momentum (Middle Bar) is aligned.
When all these turn the same color, the "●" appears, signaling a high-probability trade.
日本語解説:完全版
このインジケーターは、**「相場の構造(実体ブレイク)」と「勢い(移動平均線の同期)」**を全時間軸で一致させ、高勝率なポイントを特定する環境認識ツールです。
1. 核心:実体ブレイク(Body Break)
ヒゲではなく、**「終値(実体)」**で高値・安値を更新した時のみをトレンド転換と見なします。
メリット: 突発的なヒゲによるダマシを排除し、真の構造変化を捉えます。
表示: 青ライン(上昇)、赤ライン(下落)。過去のラインはグレー(サポレジ転換の目安)として残ります。
2. 3本の20SMA
チャートの時間足に合わせて、自動で最適な3本のSMAを描画します。
短期(黒): 15分足20MA(1時間足チャート時)。今の勢いを表し、押し目買いの目印になります。
中期(青): 表示中の時間足の20MA。
長期(赤): 上位足の20MA。
3. 3つのダッシュボード(信号機)
右側に表示される3つのパーツが、トレードの「Go/No-Go」を判定します。
① 右上パネル:長期構造シグナル
日足と4時間足の構造を比較します。ここが「青」なら、大きな流れは上向きです。
② 右中央のバー:モーメンタム・シグナル(真ん中のテーブル)
1時間足のSMA10とSMA20の同期を表します。
青: SMA10 > SMA20(上昇加速中)
赤: SMA10 < SMA20(下落加速中)
役割: 構造が良くても、勢いが死んでいる(レンジ)時はエントリーを避けるための「最終フィルター」です。
③ 右下パネル:短期構造シグナル
1時間足と15分足の構造を比較します。ここが「青」に変わる瞬間が、エントリーの準備段階です。
4. エントリーサイン「●」
「長期・中期(真ん中のバー)・短期」すべての色が揃った瞬間にチャートに「●」が出現します。 すべての時間軸の投資家が同じ方向を向いた「完璧な同調」を示しており、最も期待値の高いエントリーポイントとなります。

False Breakdown Long Confirm (dropthoughcashin)// =============================================================================
// EN — Script Introduction
// Name: False Breakdown Long Confirm (dropthoughcashin)
// Timeframe: Designed for 5-minute charts (works on other TFs but tuned for 5m)
//
// What this script does:
// This indicator detects a “false breakdown” (liquidity sweep) below a support
// level, followed by a reclaim and a retest-hold confirmation. When confirmed,
// it prints a label and triggers the alert condition: dropthoughcashin.
//
// Core logic (3 steps):
// 1) Define the support level (Key Level):
// - Pivot mode: uses the latest confirmed pivot low as support.
// - Manual mode: uses your manually entered support level.
// 2) False breakdown + reclaim:
// - Price sweeps below support (low < support),
// - The sweep must be shallow (limited by ATR multiple or fixed points),
// - Then price reclaims: close back above the support.
// 3) Retest-hold confirmation (within N bars after reclaim):
// - Price retests near the support (low <= support + tolerance),
// - And closes at/above the support (hold),
// - If confirmed within the window, signal triggers once.
//
// Key parameters:
// - Max Penetration: filters out “deep breakdowns” you do NOT want.
// - Retest tolerance: how close price must retest the support.
// - Confirm within N bars: time limit to confirm after reclaim.
//
// Notes / Limitations:
// - Pivot support is lagging by design (pivot is confirmed after pLen bars).
// - This is a signal/alert tool, not a full trading strategy.
// =============================================================================
//
// 中文 — 脚本介绍
// 名称:False Breakdown Long Confirm(dropthoughcashin)
// 周期:主要为 5分钟K 设计(其他周期也能用,但默认参数以 5m 优化)
//
// 脚本作用:
// 本指标用于识别“假跌破(扫流动性/扫止损)”形态:价格先刺破支撑位,随后快速收回
// 并在短时间内回踩踩住,形成做多确认。确认后会在图上打标签,并触发提醒条件:
// dropthoughcashin。
//
// 核心逻辑(3步):
// 1) 定义支撑位(Key Level):
// - Pivot 模式:用最近确认的 pivot low(局部低点)作为支撑。
// - Manual 模式:用你手动输入的固定支撑价位。
// 2) 假跌破 + 收回(reclaim):
// - 价格最低点刺破支撑(low < 支撑),
// - 但下穿幅度必须“浅”(用 ATR 倍数或固定点数限制),
// - 随后收盘重新站回支撑上方(close > 支撑)。
// 3) 回踩踩住确认(retest-hold):
// - 在收回之后的 N 根K内,价格回踩到支撑附近(low <= 支撑 + 容忍),
// - 且收盘守住支撑(close >= 支撑),
// - 满足则触发一次信号与提醒。
//
// 关键参数说明:
// - Max Penetration(最大下穿深度):过滤掉“下穿太深”的破位,避免误触发。
// - Retest tolerance(回踩容忍范围):定义回踩要贴近支撑到什么程度。
// - Confirm within N bars(确认窗口):收回后限定多少根K内必须完成回踩确认。
//
// 注意事项:
// - Pivot 支撑位天然滞后(需要 pLen 根K确认后才成立),属于“稳但晚”的设计。
// - 该脚本是信号/提醒工具,不是完整的交易策略(不包含止损止盈与仓位管理)。

Order Blocks & Breaker BlocksOrder Blocks & Breaker Blocks
Enhance your trading with this advanced indicator that highlights Bullish and Bearish Order Blocks (OBs) and Breaker Blocks on any chart. It is designed to help traders quickly identify key supply and demand zones and potential reversal points with clear visual cues.
Key Features
Automatically highlights Bullish and Bearish OBs.
Detects Breaker Blocks when OB levels are violated, signaling potential trend shifts.
Fully customizable visuals:
Box and Breaker Box transparency
Line transparency, width, and style (Solid, Dashed, Dotted)
Option to calculate OBs using candle body or high/low.
Adjustable number of recent OBs displayed.
Recommended Settings by Timeframe
Timeframe Swing Lookback Show OBs Notes
5 min 10 3 For fast intraday trading and scalping.
15 min 12 3 For intraday trend analysis
1H 15 3 Ideal for intraday support/resistance and breakout detection.
4H 22 3 Captures stronger OBs for swing trades.
Daily 22 3 Highlights major supply and demand zones for trend trading.
Weekly 30 2 Focuses on long-term OBs for strategic analysis.
These values provide a good balance of accuracy and chart clarity across all timeframes.
Why Use This Indicator
Quickly visualize key supply and demand zones.
Identify potential reversals and breakout points.
Improve trade timing and risk management with enhanced visual clarity.
Works across all major timeframes, making it suitable for intraday, swing, and long-term traders.

Momentum & Breakout Confirmationwatch momentum build in real time on the current candle so you can confirm weather a breakout is indeed a breakout or will be a fake out. This is what it does
This is a Momentum & Breakout Confirmation (MBC) indicator that analyzes the current candle in real-time to determine if it's a strong continuation move or possible reversal. Here's the breakdown:
What It Measures:
Momentum Strength - How much % the candle moved:
STRONG = >0.5% move
MEDIUM = 0.2-0.5%
WEAK = <0.2%
Direction - Simply bullish (green candle) or bearish (red candle)
Four Confirmation Factors:
Volume Surge - Is volume 1.5x above the 20-period average?
Move Size - Is the candle body larger than 0.5x ATR (significant)?
Body Strength - Is the body >60% of total candle range (strong conviction, minimal wicks)?
Trend Aligned - Does it align with 9/21 MA trend direction?
The Scoring System:
Adds 1 point for each confirmation factor met (max 4 points)
3-4 points = "STRONG CONTINUATION" 🚀
2 points = "LIKELY CONTINUATION"
1 point = "WEAK SIGNAL"
0 points = "POSSIBLE REVERSAL" ⚠️
Key Difference from TPC:
TPC uses multi-timeframe SuperTrend for strategic entries
MBC focuses on the current candle only - it's asking "Is THIS candle showing real momentum or is it weak/fake?"
Practical Use:
Great for confirming if a breakout or move is "real" with strong conviction behind it, or if it's low-volume/weak-bodied and likely to fail. The table updates live so you can watch momentum build during the candle formation.
Hope it helps. if you guys have any ideas for any indicators you want made please feel free to dm me as i like a good challenge lol ill sit here and try to code anything now im not saying i will be 100 percent successful but i will try for you, thanks for all the support from all you guys i def do appreciate it.

Trinity Bollinger Bands Pro with BreakoutsTrinity Bollinger Bands Pro Indicator
The **Trinity Bollinger Bands Pro + Triple Bands & Expansion** is a highly customized, advanced volatility and breakout indicator built on the classic Bollinger Bands framework. It expands the standard single-pair bands into **three independent deviation levels** (typically 1σ, 2σ, and 3σ) around a user-selectable moving average basis (default EMA 20). This creates clear "zones" of volatility, with dynamic trend-based coloring, layered fills, fixed-style labels, and a statistical volatility expansion detector shown as a directional background highlight in a separate pane. The result is a visually intuitive tool that helps traders identify consolidation, building momentum, confirmed trends, and rare explosive moves with high-probability filtering.
### Why It's Good and Different from Standard Indicators
This indicator stands out by addressing common limitations of traditional Bollinger Bands and multi-deviation scripts:
- **Layered statistical significance**: Unlike single (2σ) or basic double-band setups, it provides three distinct levels—early momentum (1σ), standard confirmation (2σ), and extreme/rare breakouts (3σ)—making it easier to stage trades progressively rather than relying on one ambiguous cross.
- **Trend-aware visuals**: Bands, basis, and fills change color based on price position relative to a separate trend MA, giving immediate bullish/bearish bias without needing additional indicators.
- **Clean, fixed labels**: Tiny, arrow-pointing labels ("1/2/3 SD Above/Below", "BB Basis") with consistent colors (purple upper, blue lower, yellow basis) provide instant identification
- **Statistical expansion detection**: Uses percentile ranking of band width "bell curve" concept" to identify abnormally high volatility, triggering directional background highlights (green bullish, red bearish) earlier than raw width spikes.
- **Reduced noise and fakeouts**: Tiered breakouts + expansion filter focus alerts on high-probability moves, unlike most BB scripts that flood signals on every touch.
Compared to popular public scripts (e.g., standard Bollinger Bands, Triple BB variants, or separate BBW Percentile tools), this combines everything into one cohesive indicator with superior visual clarity and statistical rigor.
### Key Features
- **Triple customizable bands**: Enable/disable and adjust multipliers for 1σ (early), 2σ (confirmed), 3σ (extreme) deviations.
- **Trend-based dynamic coloring**: Separate editable colors for each band set (bullish/bearish).
- **Layered zone fills**: Colored between bands with transparency, reflecting current trend.
- **Fixed tiny labels**: All left-pointing arrows with purple (upper), blue (lower), yellow (basis) backgrounds for quick reference.
- **Statistical expansion overlay**: with directional background (green/red) during extreme volatility expansions (earlier trigger using 2σ width).
- **Tiered alerts**: Early (Band 1), Confirmed (Band 2), Extreme (Band 3), High-Probability (Extreme + expansion), and general expansion alerts.
- **Fully configurable basis**: Length, type (SMA/EMA/WMA/RMA), and thin fixed lines for minimal clutter.
### How Traders Can Use It
- **Spot squeezes and breakouts**: Watch for tight bands (low width) → expansion background → price closing outside Band 1 (early entry), Band 2 (add/confirm), Band 3 (strong trend conviction).
- **Filter fakeouts**: Only act on crosses accompanied by expansion background color matching trend direction—dramatically reduces whipsaws.
- **Trend riding**: Price "walking" colored bands (e.g., hugging upper purple-label bands in green background = strong bullish momentum).
- **Scalping/intraday**: On lower timeframes (e.g., 10min), use early Band 1 signals with expansion for quick moves.
- **Swing/position trading**: Wait for Band 3 extreme breakout + colored background for higher-probability, larger moves.
- **Risk management**: Place stops near basis or inner band; trail using outer bands during expansions.
Overall, this indicator excels at turning volatility into actionable, staged signals with visual simplicity—ideal for traders seeking an edge in identifying real explosive trends over noise. It's particularly powerful on volatile stocks like AMD/INTC or indices during news/events.

Opening Range Breakout with VWAP & RSI ConfirmationThis indicator identifies breakout trading opportunities based on the Opening Range Breakout (ORB) strategy combined with intraday VWAP and higher timeframe RSI confirmation.
Opening Range: Calculates the high, low, and midpoint of the first 15 or 30 minutes (configurable) after your specified market open time.
Intraday VWAP: A volume-weighted average price calculated manually and reset daily, tracking price action throughout the trading day.
RSI Confirmation: Uses RSI from a user-selected higher timeframe (1H, 4H, or Daily) to confirm signals.
Buy Signal: Triggered when VWAP breaks above the Opening Range High AND the RSI is below or equal to the buy threshold (default 30).
Sell Signal: Triggered when VWAP breaks below the Opening Range Low AND the RSI is above or equal to the sell threshold (default 70).
Visuals: Plots Opening Range levels and VWAP on the chart with clear buy/sell markers and optional labels showing RSI values.
Alerts: Provides alert conditions for buy and sell signals to facilitate timely trading decisions.
This tool helps traders capture momentum breakouts while filtering trades based on momentum strength indicated by RSI.

Previous Day Week Month Highs & Lows [MHA Finverse]Previous Day Week Month Highs & Lows is a comprehensive multi-timeframe indicator that automatically plots previous period highs and lows across Daily, Weekly, Monthly, 4-Hour, and 8-Hour timeframes. Perfect for identifying key support and resistance levels that often act as magnets for price action.
How It Works
The indicator retrieves the highest high and lowest low from the previous completed period for each selected timeframe. Lines extend forward into current price action, allowing you to see when price approaches or breaks these critical levels in real-time. The indicator tracks the exact bar where each high and low occurred, ensuring accurate historical placement.
---
Key Features
Multi-Timeframe Levels:
• Current Daily, Previous Daily, 4H, 8H, Weekly, and Monthly highs/lows
• Fully customizable colors and line styles (Solid, Dashed, Dotted)
• Adjustable line width and extension length
Visual Enhancements:
• Price labels showing exact level values
• Range position percentage (distance from high/low)
• Optional period boxes highlighting timeframe ranges
• Day and date labels for reference
Trading Tools:
• Breakout markers when price crosses key levels
• Touch count tracking (how many times price tested each level)
• Time at level display (consolidation detection)
• Customizable thresholds for touch and time analysis
Alert System:
• Individual alerts for each timeframe: Daily High/Low Break, 4H High/Low Break, 8H High/Low Break, Weekly High/Low Break, Monthly High/Low Break
• Toggle switches to enable/disable alerts per timeframe
• Clear messages showing which level was broken and at what price
---
How to Use
Setup:
1. Enable your preferred timeframes in "Highs & Lows MTF" settings
2. Customize colors and styles to match your chart
3. Turn on visual features like price labels and range percentages
4. Set up alerts by creating specific alert conditions or using toggle switches
Trading Applications:
Breakout Trading: Watch for strong momentum when price breaks above previous highs or below previous lows
Support/Resistance: Use these levels as potential reversal points for entry/exit signals
Range Trading: Trade between previous highs and lows using the range position indicator
Stop Loss Placement: Place stops just beyond previous highs (shorts) or lows (longs)
Multiple Timeframe Confirmation: Combine timeframes for stronger signals (e.g., Daily near Weekly support)
---
Best Practices
• Use Weekly/Monthly for swing trading, Daily/4H/8H for day trading
• Combine with volume or momentum indicators for confirmation
• Multiple timeframe levels clustering together create high-probability zones
• The more touches a level has, the more significant it becomes
---
Disclaimer
This indicator is a technical analysis tool for identifying price levels based on historical data. It does not guarantee profits or predict future movements. Trading involves substantial risk. Always use proper risk management and never risk more than you can afford to lose.

specific breakout FiFTOStrategy Description: 10:14 Breakout Only
Overview This is a time-based intraday trading strategy designed to capture momentum bursts that occur specifically after the 10:14 AM candle closes. It operates on the logic that if price breaks the high of this specific candle within a short window, a trend continuation is likely.
Core Logic & Rules
The Setup Candle (10:14 AM)
The strategy waits specifically for the minute candle at 10:14 to complete.
Once this candle closes, the strategy records its High price.
Defining the Entry Level
It calculates a trigger price by taking the 10:14 High and adding a user-defined Buffer (e.g., +1 point).
Formula: Entry Level = 10:14 High + Buffer
The "Active Window" (Expiry)
The trade setup does not remain open all day. It has a strict time limit.
By default, the setup is valid from 10:15 to 10:20.
If the price does not break the Entry Level by the expiry time (default 10:20), the setup is cancelled and no trade is taken for the day.
Entry Trigger
If a candle closes above the Entry Level while the window is open, a Long (Buy) position is opened immediately.
Exits (Risk Management)
Stop Loss: A fixed number of points below the entry price.
Target: A fixed number of points above the entry price.
Visual & Automation Features
Visual Boxes: Upon entry, the strategy draws a "Long Position" style visual on the chart. A green box highlights the profit zone, and a red box highlights the loss zone. These boxes extend automatically until the trade closes.
JSON Alerts: The strategy is pre-configured to send data-rich alerts for automation (e.g., Telegram bots).
Entry Alert: Includes Symbol, Entry Price, SL, and TP.
Exit Alerts: Specific messages for "Target Hit" or "SL Hit".
Summary of User Inputs
Entry Buffer: Extra points added to the high to filter false breaks.
Fixed Stop Loss: Risk per trade in points.
Fixed Target: Reward per trade in points.
Expiry Minute: The minute (10:xx) at which the setup becomes invalid if not triggered.

CODY BOT – Breakout SignalsCODY BOT is a minimalist, high-probability breakout indicator designed to keep your chart clean while highlighting actionable trading opportunities.
Unlike traditional indicators that generate too many signals, CODY BOT only alerts you to strong directional moves following consolidation, helping you focus on high-quality entries.
Key Features:
Detects breakouts above recent highs and below recent lows.
Filters weak moves using minimum candle body size.
Includes a cooldown period to prevent signal spam.
Clean and intuitive visual signals with large arrows for easy interpretation.
Optional customization for consolidation lookback bars, minimum candle size, and arrow visibility.
Alerts built-in for server-side and mobile notifications.
How to Use:
Look for BUY arrows when price breaks above consolidation highs.
Look for SELL arrows when price breaks below consolidation lows.
Combine with your preferred risk management and trend confirmation strategies.

Baba-pro EMA Break Sniper This indicator is designed to provide high-precision entries based on the interaction between EMAs, momentum, and clean price breaks.
Instead of relying on traditional EMA crossovers — which are often too slow — this tool focuses on direct EMA breakouts, allowing you to catch moves before most traders even react.

Low Volatility Breakout + TP/SL Levels█ OVERVIEW
"Low Volatility Breakout + TP/SL Levels" is a breakout indicator designed to detect and trade breakouts from periods of low volatility (consolidation). Unlike classic strategies based on fixed support/resistance levels, this indicator dynamically identifies consolidations characterized by small candle bodies and only generates a signal when the breakout occurs with a large, decisive candle. It also automatically plots 3 Take Profit levels and a Stop Loss (with two calculation modes), making it a complete breakout trading tool.
█ CONCEPTS
The strongest market moves most often start after a prolonged period of very low volatility — when candles become small and the market "falls asleep". The indicator first detects such consolidations (small bodies for at least X bars), draws a box around them, and then waits for a breakout with a candle significantly larger than the average. Additional filters (e.g., the box height cannot exceed the average candle body by too much) eliminate false consolidations and volatility traps. Immediately after the breakout, TP1, TP2, TP3, and SL levels are plotted.
█ FEATURES
Dynamic detection of low-volatility consolidations
- candles with small bodies (< average body × consolidationMultiplier)
- minimum number of bars in consolidation: confirmBars (default 5)
Automatic drawing of consolidation boxes
- green (bullish) or red (bearish) with transparent background (85)
- adjustable border thickness (border_width 1–5)
- box height filter (boxHeightMultiplier, default 6.0 × average body) – removes overly stretched/false consolidations
Breakout conditions
- current candle must be larger than average body × threshold (default 1.5)
- must be the largest candle in the entire consolidation
- must close above the highest high (long) or below the lowest low (short)
Breakout signals
- small green triangles below the bar (long)
- small red triangles above the bar (short)
Automatic Take Profit and Stop Loss levels (drawn 5 bars forward)
- two calculation modes:
• Candle Multiplier – based on average true range (high-low) over tp_sl_length period
• Percentage – fixed percentage from breakout close price (percentages must be manually adjusted to the asset and timeframe)
- 3 TP levels (default 2×, 3×, 4× or 2%, 3%, 4%)
- 1 SL level (default 2× or 1.5%)
Live TP/SL price table (top-right corner)
- displays exact current values of SL, TP1, TP2, TP3 immediately after each new signal
- colors identical to drawn lines (red background for SL, green for TP levels)
- updates automatically with every new breakout
Built-in alerts
- “Bullish Breakout Alert” and “Bearish Breakout Alert”
█ HOW TO USE
Add the indicator to your TradingView chart → Indicators → search “Low Volatility Breakout + TP/SL Levels”.
After each valid breakout you will immediately see:
- the colored box
- signal triangle
- horizontal TP/SL lines
- updated table in the top-right corner showing precise price levels for the current trade
Key settings to adjust:
Consolidation Settings
- Volatility Window (length) – period for average body calculation (default 20)
- Consolidation Multiplier – how small bodies must be to count as consolidation (default 2.0)
- Breakout Multiplier – minimum size of breakout candle (default 1.5)
- Box Height Multiplier – maximum allowed box height (default 6.0)
- Min Consolidation Bars – minimum bars required (default 5)
Risk Management Settings
- Choose TP/SL mode: Candle Multiplier or Percentage
- Adjust TP1–3 and SL multipliers/percentages to match your risk management style
Signal interpretation:
- Green triangle below bar + green box + green TP levels in table = long signal
- Red triangle above bar + red box + red SL level in table = short signal
- Boxes remain on chart until broken — they highlight accumulation/distribution zones
█ APPLICATIONS
- Trading breakouts from consolidation on all markets and timeframes
- Recommended to trade in the direction of the higher-timeframe trend or with additional confirmations (e.g., key level breaks). Aggressive mode (trading both directions) is also possible — provided box and TP/SL settings are properly optimized
- Experiment with different TP/SL ratios — higher reward-to-risk setups (e.g., SL 1×, TP3 6–8×) with lower win rate are often more profitable in the long run
- Strongly encourage testing various box parameters (consolidationMultiplier, boxHeightMultiplier, confirmBars) — small changes can dramatically affect signal frequency and quality
█ NOTES
Always test and optimize parameters for the specific instrument and timeframe.

MTF Checklist DashboardMTF Checklist Dashboard
Overview
The MTF Checklist Dashboard is an advanced multi-timeframe analysis tool that provides traders with a comprehensive visual dashboard to analyze market conditions across six customizable timeframes simultaneously. This indicator combines multiple technical analysis methods, including Opening Range Breakouts (ORB), VWAP, EMAs, and daily price levels, to generate high-probability confluence-based trading signals.
Unlike traditional single-timeframe indicators, this dashboard displays all critical information in one organized table, allowing traders to instantly identify when multiple timeframes align for optimal entry and exit opportunities.
Key Features
Multi-Timeframe Analysis
Analyzes up to 6 timeframes simultaneously (default: 1m, 5m, 15m, 30m, 1h, 4h)
Fully customizable timeframe selection via comma-separated input
Color-coded cells for instant visual recognition (green=bullish, red=bearish, yellow=neutral)
Technical Indicators Tracked
Current and previous candle direction
Opening Range Breakout (ORB) positioning with custom period
VWAP relationship (above/below)
200 EMA positioning
Daily and previous day high/low proximity
EMA crossovers (9 vs 21, both vs 200)
Advanced Signal Filtering System
Confluence scoring: Requires multiple timeframes to align (3-6 timeframes)
Higher timeframe confirmation: Ensures 30m/1h/4h agreement
Volume filter: Confirms signals with above-average volume (1.5x default)
ATR volatility filter: Validates sufficient market movement
Session timing: Restricts signals to optimal trading hours (EST)
Momentum confirmation: Requires recent directional strength
Range positioning: Blocks signals near daily extremes
Candle strength: Validates strong directional candles (60%+ body ratio)
Visual Signals
Optional entry arrows (above/below bars)
Background color highlighting
Organized dashboard with real-time price levels
ORB range, current day, and previous day summary rows
Alert Conditions
JSON-formatted alerts for automated trading integration
Separate alerts for long entry, short entry, long exit, and short exit
Compatible with webhook automation systems
How To Use
Dashboard Interpretation
The dashboard displays a color-coded table with the following columns:
TF: Timeframe being analyzed
C: Current candle (Green=bullish, Red=bearish)
P: Previous candle (Green=bullish, Red=bearish)
ORB: Opening Range Breakout position (A=Above, B=Below, W=Within)
VWAP: Price vs VWAP (A=Above, B=Below)
E200: Price vs 200 EMA (A=Above, B=Below)
D Hi/Lo: Proximity to current day high/low (Hi/Lo/Mid)
PD Hi/Lo: Proximity to previous day high/low (Hi/Lo/Mid)
9 vs 21: EMA 9 vs EMA 21 relationship (A=9 above 21, B=9 below 21)
9&21 v200: Both EMAs vs 200 EMA (>>=both above, <<=both below, <>=mixed)
Signal Generation
Long Entry Signal triggers when:
Minimum number of timeframes show bullish alignment (default: 5 of 6)
Higher timeframes (30m/1h/4h) confirm direction (default: 2 of 3)
Price breaks above ORB high with sufficient distance
Volume exceeds average by specified multiplier
ATR shows adequate volatility
Trade occurs during optimal session hours
Recent momentum is upward
Price not too close to daily high
Strong bullish candle forms
Short Entry Signal uses opposite conditions
Exit Signals trigger when opposing timeframe confluence reaches threshold (default: 3 timeframes)
Recommended Workflow
Select your asset and primary trading timeframe
Observe the dashboard - Look for rows showing mostly green (bullish) or red (bearish)
Wait for alignment - The indicator will show arrows when confluence requirements are met
Check the bottom rows - Review ORB levels and daily ranges for context
Set alerts - Enable TradingView alerts using the built-in alert conditions
Manage risk - Use appropriate position sizing and stop losses based on ORB range or daily ATR
Settings Guide
Basic Settings
Timeframes: Enter comma-separated values (e.g., "1,5,15,30,60,240")
Show Header: Toggle column headers on/off
ORB Minutes: Set opening range period (default: 15 minutes)
Near % for daily highs/lows: Define proximity threshold (default: 0.20%)
Use close for comparisons: Compare using close vs current price
Dashboard Position: Choose from 9 screen positions
Confluence Filters
Minimum Timeframes Aligned: Set required confluence (3-6, default: 5)
Require Higher Timeframe Confirmation: Toggle HTF requirement on/off
Min Higher Timeframes: Specify HTF agreement needed (1-3, default: 2)
Volume Filter
Volume Confirmation: Enable/disable volume filtering
Volume vs Average: Set multiplier threshold (default: 1.5x)
Volume Average Length: Period for volume average (default: 20 bars)
Volatility Filter (ATR)
Volatility Filter: Enable/disable ATR confirmation
ATR Length: Calculation period (default: 14)
Min ATR vs Average: Required ATR level (default: 0.5x = 50%)
ORB Filters
ORB Breakout Distance Required: Toggle distance requirement
Min Breakout % Beyond ORB: Additional breakout threshold (default: 0.10%)
Session Filter
Trade Only During Best Hours: Enable time-based filtering
Session 1: First trading window (default: 0930-1130 EST)
Session 2: Second trading window (default: 1400-1530 EST)
Momentum Filter
Recent Momentum Required: Enable directional momentum check
Lookback Bars: Period for momentum comparison (default: 3 bars)
Daily Range Filter
Block Signals Near Daily Extremes: Prevent entries at extremes
Distance from High/Low %: Minimum distance required (default: 2.0%)
Candle Filter
Strong Directional Candle: Require candle strength
Min Candle Body %: Body-to-range ratio threshold (default: 60%)
Visual Signals
Show Entry Signals: Master toggle for visual signals
Show Arrows: Display entry arrows on chart
Background Color: Enable background highlighting
Best Practices
Start with default settings and adjust based on your trading style and asset volatility
Higher confluence requirements (5-6 timeframes) produce fewer but higher-quality signals
Enable all filters for conservative trading; disable some for more frequent signals
Use the dashboard as confirmation alongside your existing trading strategy
Backtest on your specific instruments before live trading
Consider market conditions—trending vs ranging markets may require different settings
Alerts
This indicator includes four alert conditions with JSON formatting for webhook integration:
Long Entry Signal: Triggers when all long conditions are met
Short Entry Signal: Triggers when all short conditions are met
Long Exit Signal: Triggers when opposing confluence reaches exit threshold
Short Exit Signal: Triggers when opposing confluence reaches exit threshold
Alert messages include ticker symbol, action (buy/sell), price, and quantity for automated trading systems.
Important Notes
This indicator works best on liquid instruments with clear price action
Highly volatile markets may require adjusted ATR and ORB distance settings
Session times are in EST timezone—adjust if trading non-US markets
The ORB calculation requires sufficient price history for the day
Signals are generated in real-time but should be confirmed at candle close
Limitations
Maximum of 6 timeframes can be analyzed due to TradingView's security call limits
ORB calculations may not work correctly on instruments with gaps or irregular sessions
The indicator is most effective during regular market hours when volume and volatility are adequate
Lower timeframes (1m, 5m) may produce more false signals in choppy conditions
License
Mozilla Public License 2.0 (MPL-2.0)
This indicator is licensed under the Mozilla Public License 2.0. You are free to use, modify, and distribute this code under the terms of the MPL-2.0. The full license text is available at mozilla.org
Key license provisions:
You may use this code commercially
You may modify and distribute modified versions
Modified versions must be released under the same license
You must include the original license notice in any distributions
No trademark rights are granted
Disclaimer
This indicator is provided for educational and informational purposes only. It is not financial advice, and past performance does not guarantee future results. Trading involves substantial risk of loss. Always:
Practice proper risk management
Test thoroughly on paper/demo accounts before live trading
Use appropriate position sizing
Never risk more than you can afford to lose
Consult with a financial advisor for personalized advice
The creator assumes no liability for trading losses incurred using this indicator.
Version: 2.0
Pine Script Version: v6
Author: © EliasVictor

MOMO – Imbalance Trend (SIMPLE BUY/SELL)MOMO – Imbalance Trend (SIMPLE BUY/SELL)
This strategy combines trend breaks, imbalance detection, and first-tap supply/demand entries to create a clean and disciplined trading model.
It automatically highlights imbalance candles, draws fresh zones, and waits for the first retest to deliver precise BUY and SELL signals.
Performance
On optimized settings, this strategy shows an estimated 57%–70% win-rate, depending on the asset and timeframe.
Actual performance may vary, but the model is built for consistency, discipline, and improved decision-making.
How it works
Detects trend structure shifts (BOS / Break of Trend)
Identifies displacement (imbalance) candles
Creates supply and demand zones from imbalance origin
Waits for first tap only (no second chances)
Confirms direction using trend logic
Generates clean BUY/SELL arrows
Automatic SL/TP based on user settings
Features
Clean BUY/SELL markers
Auto-drawn supply & demand zones
Trend break markers
Imbalance tags
Smart first-tap confirmation
Customizable stop loss & take profit
Works on crypto, gold, forex, indices
Best on M5–H1 for day trading
Note
This strategy is designed for day traders who want clarity, structure, and zero emotional trading.
Use it with discipline — and it will serve you well.
Good luck, soldier.

Session Breakout, Retest, Reversal + Large Move Alert## **Session Breakout, Retest, Reversal + Large Move Alert**
### Overview
A powerful multi-functional indicator designed for day traders and futures traders to identify session-based breakout opportunities, retest confirmations, and significant price movements across all futures contracts (Gold, E-mini S&P 500, Nasdaq, Crude Oil, and more).
### Key Features
**📊 Pre-Market Session Tracking**
- Automatically calculates pre-market/overnight session highs and lows
- Displays session ranges with customizable colors and styling
- Extends lines through the entire trading session for easy reference
- Supports overnight sessions (e.g., 4 PM – 7:30 AM for Gold futures)
**🚀 Breakout Detection**
- Identifies breakouts above/below pre-market highs and lows
- Uses close-price confirmation to filter false signals from wicks
- Displays "BO ↑" and "BO ↓" labels at breakout points
- Generates instant alerts when breakouts occur
**♻️ Retest Failed Tracking**
- Monitors price retests after breakouts
- Detects when retests fail to reach previous support/resistance
- Labels "RF" (Retest Failed) for high-probability trade setups
- Helps identify reversal opportunities
**📈 First 5-Minute Analysis**
- Captures first 5 minutes of market open (customizable timeframe)
- Tracks first 5-minute highs and lows separately
- Essential for mean-reversion and breakout confirmation strategies
- Blue lines extend through the trading session for easy tracking
**⚡ Large Move Alerts**
- Detects significant price movements based on point thresholds
- Individual thresholds for 5+ different symbols:
- GC (Gold): 15 points
- ES (E-mini S&P 500): 15 points
- NQ (E-mini Nasdaq): 50 points
- CL (Crude Oil): 1.5 points
- Custom: Fully adjustable
- Auto-detects symbol from chart ticker
- Labels show exact point movement and candle direction
### Customization Options
**Symbol Configuration**
- **Auto-Mode**: Automatically detects trading symbol from chart ticker
- **Manual-Mode**: Select specific symbol (GC, ES, NQ, CL, or Custom)
**Session Settings**
- Fully customizable pre-market session time (24-hour format)
- Adjustable market open time for first 5-minute window
- Market close hour and minute configuration
- Support for any timezone
**Point Move Thresholds by Symbol**
- Set independent thresholds for each of your trading symbols
- Quickly adjust settings when switching between different futures
- Includes helpful tooltips for recommended values
**Display & Styling**
- Toggle all visual elements on/off individually
- Customizable colors for all lines and labels:
- Pre-market high/low colors
- Breakout labels (up/down)
- Retest failed labels
- First 5-minute session lines
- Large move indicators
- Text size options: tiny, small, normal, large, huge
### How It Works
1. **Session Tracking**: The indicator identifies your pre-market session and marks the high and low with labeled lines (PH/PL)
2. **Breakout Signal**: Once the market opens, it monitors for close prices above/below the pre-market levels and alerts you with "BO ↑" or "BO ↓"
3. **Retest Confirmation**: After a breakout, it tracks retests and labels "RF" when the retest fails to reach the opposite extreme, confirming trade direction
4. **Large Move Detection**: Simultaneously monitors for significant point moves that exceed your symbol-specific thresholds
5. **Alert Triggers**: Get real-time alerts for:
- Breakout Up/Down
- Any Breakout
- Large Move events
### Alert Conditions
The indicator includes four alert conditions:
- **Breakout Up Alert**: Price closes above pre-market high
- **Breakout Down Alert**: Price closes below pre-market low
- **Any Breakout Alert**: Either breakout condition triggers
- **Large Move Alert**: Point movement exceeds threshold for current symbol
### Ideal For
- ✅ Day traders (breakout/retest strategies)
- ✅ Futures traders (Gold, Oil, Stock Index Contracts)
- ✅ Intraday scalpers (first 5-minute analysis)
- ✅ Swing traders (session-based levels)
- ✅ Multi-symbol traders (independent thresholds per symbol)
### Disclaimer
This indicator is designed for educational and informational purposes. Past performance does not guarantee future results. Always use proper risk management and position sizing. Test thoroughly on historical data before trading live.

Easy [CHE] Easy — Minimalist Pine Script for detecting EMA direction changes to define fixed price zones for simple support and resistance visualization, ideal for manual trading workflows.
Summary
This indicator's programming is kept minimalist and super simple, with core logic in under 20 lines for easy comprehension and modification. It creates fixed price zones based on divergences between a base exponential moving average and its smoother counterpart, helping traders spot potential consolidation or reversal areas without dynamic adjustments. By locking the zone at the high and low of the signal bar, it avoids over-expansion in volatile conditions, offering a stable reference line colored by price position relative to the zone. This approach differs from expanding channels by prioritizing simplicity and persistence until a new qualifying signal, reducing visual clutter while highlighting directional bias through midpoint coloring.
Motivation: Why this design?
Traders often face noisy signals from moving averages that flip frequently in sideways markets or lag during breakouts, leading to premature entries or missed opportunities. This indicator addresses that by focusing on confirmed direction shifts between the base and smoothed averages, then anchoring a non-expanding zone to capture the initial price range of the shift. The result is a cleaner tool for marking equilibrium levels, assuming price respects these bounds in ranging or mildly trending conditions.
What’s different vs. standard approaches?
- Reference baseline: Traditional moving average crossovers or simple channels that update every bar.
- Architecture differences:
- Zones are set only on new divergence signals and remain fixed until reset by a gap from the prior zone.
- No ongoing high-low expansion; relies on persistent variables to hold bounds across bars.
- Midpoint plotting with conditional coloring based on close position, plus a highlight for zone initiations.
- Practical effect: Charts show persistent horizontal references instead of drifting lines, making it easier to gauge if price is rejecting or embracing the zone—useful for avoiding false breaks in low-volatility setups.
How it works (technical)
The indicator first computes a base exponential moving average of closing prices over a user-defined length, then applies a second exponential moving average to smooth that base. It checks if both the base and smoothed values are increasing or decreasing compared to their prior values, indicating aligned direction. A signal triggers when this alignment breaks, marking a potential shift.
On a new signal, if the current bar's high and low fall outside any existing zone (or none exists), the zone bounds update to those extremes and persist via dedicated variables. The midpoint of these bounds becomes the primary plot line, colored green if below the close (bullish lean), red if above (bearish lean), or gray otherwise. A secondary thick line highlights the midpoint briefly when a zone first sets, aiding visual confirmation. No higher timeframe data or external fetches are used, so updates occur on each bar close without lookahead.
Parameter Guide
EMA Length — Sets the period for the base moving average; longer values smooth more, reducing signal frequency but increasing lag. Default: 50. Trade-offs/Tips: Shorter for faster response in intraday charts (risks noise); longer for daily trends (may miss early shifts).
Smoother Length — Defines the period for the secondary smoothing on the base average; higher values dampen minor wiggles for stabler direction checks. Default: 3. Trade-offs/Tips: Keep low (2–5) for sensitivity; increase to 7+ if zones trigger too often in choppy markets, at cost of delayed signals.
Reading & Interpretation
The main circle plot at the zone midpoint serves as a dynamic equilibrium line: green suggests price is above the zone (potential strength), red indicates below (potential weakness), and gray shows containment within bounds (neutral consolidation). A sudden thick foreground line at the midpoint flags a fresh zone start, prompting review of the prior bar's context. Absence of a plot means no active zone, implying reliance on price action alone until the next signal.
Practical Workflows & Combinations
- Trend following: Enter long on green midpoint after a higher low touches the zone lower bound, confirmed by structure like higher highs; filter shorts similarly on red with lower highs.
- Exits/Stops: Use the opposite zone bound as a conservative stop (e.g., below lower for longs); trail aggressively to midpoint on strong moves, tightening near gray neutrality.
- Multi-asset/Multi-TF: Defaults work across forex and stocks on 1H–Daily; for crypto volatility, shorten EMA Length to 20–30. Pair with volume oscillators for confirmation, avoiding isolated use.
Behavior, Constraints & Performance
- Repaint/confirmation: Plots update on bar close using historical closes, so confirmed signals hold; live bars may shift until close but without future references.
- security()/HTF: Not used, eliminating related repaint risks.
- Resources: Minimal overhead—no loops, arrays, or bar limits exceeded; suitable for real-time on any timeframe.
- Known limits: Fixed zones may lag in strong trends (price drifts away without reset); signals skip if no gap from prior zone, potentially missing clustered shifts. Assumes standard OHLC data; untested on non-equity assets.
Sensible Defaults & Quick Tuning
Start with EMA Length at 50 and Smoother Length at 3 for balanced daily charts. If signals fire too frequently (e.g., in ranges), extend EMA Length to 100 for fewer but stabler zones. For sluggish response in trends, drop Smoother Length to 2 and EMA Length to 30, monitoring for added noise. In high-vol setups, widen both to 75/5 to filter extremes, trading speed for reliability.
What this indicator is—and isn’t
This is a lightweight visualization layer for EMA-driven zones, aiding manual chart reading and basic signal spotting. It is not a standalone system, predictive model, or automated alert generator—integrate with broader analysis like market structure and risk rules. (Unknown/Optional: No built-in alerts or multi-timeframe scaling.)
Disclaimer
The content provided, including all code and materials, is strictly for educational and informational purposes only. It is not intended as, and should not be interpreted as, financial advice, a recommendation to buy or sell any financial instrument, or an offer of any financial product or service. All strategies, tools, and examples discussed are provided for illustrative purposes to demonstrate coding techniques and the functionality of Pine Script within a trading context.
Any results from strategies or tools provided are hypothetical, and past performance is not indicative of future results. Trading and investing involve high risk, including the potential loss of principal, and may not be suitable for all individuals. Before making any trading decisions, please consult with a qualified financial professional to understand the risks involved.
By using this script, you acknowledge and agree that any trading decisions are made solely at your discretion and risk.
Do not use this indicator on Heikin-Ashi, Renko, Kagi, Point-and-Figure, or Range charts, as these chart types can produce unrealistic results for signal markers and alerts.
Best regards and happy trading
Chervolino
