OB EmaCross + BBThis is my setup and the way I like to trade.
It is based in an EMA cross ( 9 x 21) and the Bollinger Bands without the central Moving Average.
I prefer to use the EMA cross in the middle of the bands.
It is also possible to activate "Colored Bars" to paint the candles according to the EMA cross: green if the candles are above both EMAs, white when at least one of them are in between EMAs and red if they are both below EMAs.
My operational works like this:
- Buy when price is above EMAs
- Sell when price is belos EMAs
Of course, I use BB to give me the direction of the trend and I only enter in a trade when the price is in the same trend of the BB.
I avoid trades when the bands are getting narrowed.
I hope you enjoy my indicator and let me know if you have any suggestion! ;)
In den Scripts nach "bollingerband" suchen

K's Reversal Indicator IK's reversal indicator I is a special combination between Bollinger bands and the MACD oscillator. It is a contrarian indicator that depends on the following conditions:
• A buy signal is generated whenever the current market price is below the 100-period lower Bollinger band while simultaneously, the MACD value must be above its signal line. At the same time, the previous MACD value must be below its previous signal line.
• A sell (short) signal is generated whenever the current market price is above the 100-period upper Bollinger band while simultaneously, the MACD value must be below its signal line. At the same time, the previous MACD value must be above its previous signal line.
The way to use K's reversal indicator is to combine it with your already long/short bias in a sideways/range market in order to maximize the probability of success.
Limitations of the indicator include the following:
• There are no clear exit rules that work well on average across the markets. Even though K’s reversal indicator gives contrarian signals, it does not show when to exit the positions.
• As with other indicators, it underperforms on some markets and is not to be used everywhere.
• False signals tend to occur during trending markets but there is no proven way to detect a false signal.

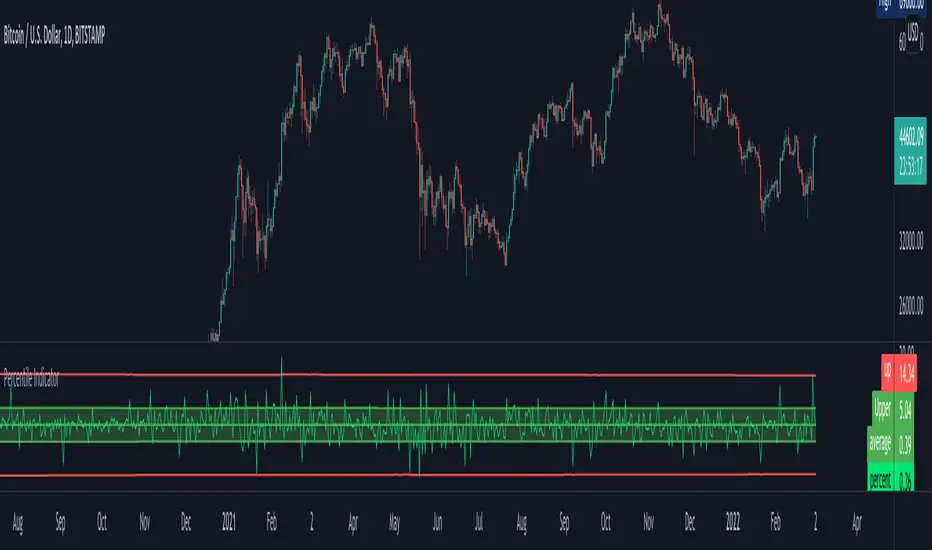
Percentile Major Move Indicator This indicator is a powerful tool for understanding how big of a move a product, crypto, or currency has recently had.
Anything inside of the green bars is a standard move with a 68% chance of happening based on your chart timeframe.
Any move that touches the red lines to the upside or downside has a 2%+ chance of happening in either direction.
This is a powerful indicator but just one point of data and should be used as such.
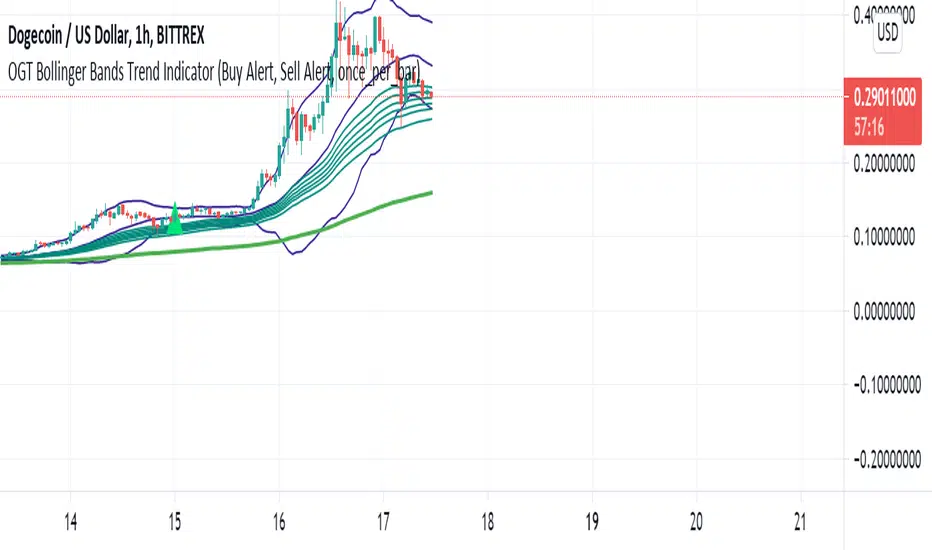
OGT Bollinger Bands Trend IndicatorWhat Is The OGT Bollinger Bands Trend Indicator?
This indicator is a pullback trend trading indicator which uses the following indicators:
- 200 EMA - Long Term Trend Direction
- 30, 35, 40, 45, 50, 60 EMAs - Shorter Term Trend Direction
- Bollinger Bands - Pullback / Entry Signal
How Are Signals Generated?
Buy
- Price above the 200 EMA
- Price touches lower BB with shorter term EMAs all aligned (not crossed)
- Indicator waits for price to close above midpoint BB with shorter term EMAs all still aligned (not crossed)
Sell
- Price below the 200 EMA
- Price touches upper BB with shorter term EMAs all aligned (not crossed)
- Indicator waits for price to close above midpoint BB with shorter term EMAs all still aligned (not crossed)
Alerts function built in, input settings customisable to show/not show indicators and change colours.
Beacon - Anthony Crudele's IndicatorBeacon uses the current volatility of the market based on your trading time frame to determine support and resistance levels, whether a trend is intact or ready to revert back in the range. One of the most difficult things I went through as a trader was determining whether we are in a trend day or if we are in grind up or grind down mode. I created Beacon to give me a simple look at the market to determine what type of environment we are in. I use Bollinger Bands (3 standard deviation) to determine the volatility cycle. Once the BB make peaks I took my Fibonacci Retracement tool and did a retracement from the peak high of the BB to the peak low. I use 70%, 50% and 30% for my support and resistance levels. I use those levels because I tested pretty much every percent level and those percentages averaged the highest performance on all tick charts and time charts. You can use Beacon on whatever time frame or tick chart you are trading on and it will determine that specific volatility cycle.

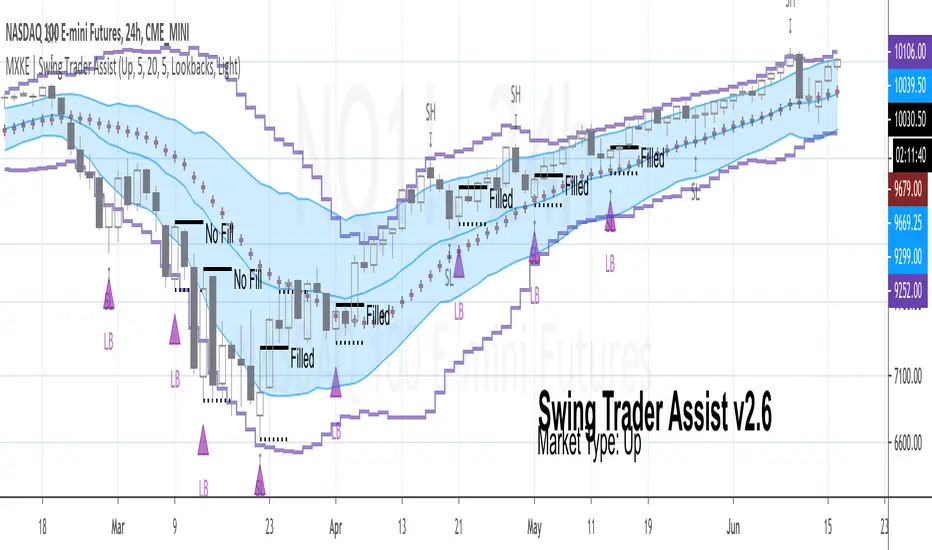
MXKE | Swing Trader AssistIntroduction
Swing Trader Assist indicator is designed to assist in the systematic identification of Hammers & Lookback signals within Uptrending markets, Stars & Lookback signals within Downtrending markets, and Mean Reversion signals within Sideways markets. The trader must first identify a strong market trend, then apply the indicator. Application of the indicator to weak trends will render equally weak signals. Application of the indicator to strong trends will render equally strong signals. Identification of strong trends is the responsibility of the individual trader and is instrumental to the successful deployment of this indicator and accompanying trading plan.
*Please comment below to request access*
*Please share with me on Twitter your usage and/or ideas for improvement so that I may improve this indicator in the future*
Market Types
Uptrend: Higher highs + Higher lows
Downtrend: Lower highs + Lower lows
Sideways: Higher highs + Lower lows (Expanding Range) or Lower highs + Higher lows (Narrowing Range)
Position Sizing
1R = .25%-2% of total nominal capital dependent upon timeframe and risk appetite
Order Types
Entry: Buy Stop 1 tick above High of “Up” Signal Bars; Sell Stop 1 tick below Low of “Down” Signal Bars
Stop: Bar Close <= 1 tick below Low of “Up” Signal Bar; Bar Close >= 1 tick above High of “Down” Signal Bar
Profit Target: 1.5R distance from “Up” or “Down” fill level with the option to trail stop on each new swing high/low; Bollinger Band Midline minimum 1.5R distance from “Sideways” fill level with option to trail stop on continuation to the opposite end of the range (opposite Bollinger Band)
Trading Plan
❑ Market Type is clearly identifiable as Up, Down or Sideways
❑ Swing Trader Assist indicator is set to the corresponding Market Type: Up, Down or Sideways
❑ Position size is no more than .25%-2% of total nominal capital (based on distance from Signal Bar fill level to Signal Bar stop level as 1R)
❑ Distance from Signal Bar fill level to potential Profit Target is minimum 1.5R
❑ On Hammer or Star fill: close position into trend extension at 1.5R+ or adjust trailing stop on each new swing high/low
❑ On Mean Reversion fill: close position at midline or adjust trailing stop on each continuation to opposite end of range
Usage Notes
The indicator will display developing signals intrabar and it is therefore suggested to wait until bar close to act on any signals. “Autodetect” setting under “Market Type” is currently in beta mode. While it is designed to reveal only relevant signals within strong trends based on a series of EMAs, this setting has not been extensively tested. Use with caution.
The indicator is not meant to be a mechanical trading system. It is designed to assist the trader in objectively and systematically identifying signal bars during the execution of the below swing trading plan. It is up to the trader to determine if overall price action warrants acting upon the signal bars or not.
Case Studies


Calendar's Bollinger BandsHI guys, I'm Calendar
I made my 2nd indicator for my followers.
This indicator made by merging 2 Bollinger Bands.(SDV =1, 2)

Bollinger Band Open Gap Alert V1This is the bare bones of what I'm trying to achieve through pine script. The purpose of the script is to:
1. On a 15m chart, calculate and plot upper & lower Bollinger bands and simple moving average of 20 periods. (DONE)
2. On a new day, when the first 15m candle of a session forms, I want to check if a) the low of the new candle is outside the upper Bollinger band (also known as an open gap up) or b) if the high of the candle is the outside the lower Bollinger band (also known as open gap down). In other words, I want to know if the Bollinger Bands are not touching the new candle's wicks/shadows. (DONE)
3. Alert me if the above happens. (DONE)
4. Run the indicator through an entire watch list. I'm not sure if that's possible, yet. (HELP)
For the above job, this is what I could come up with. I need guidance for the last step . And any suggestions for corrections or improvements would be greatly appreciated!
BBMA Signal ProBBMA Signal Pro
BBMA Signal Pro is a professional BBMA (Bollinger Band + Moving Average) cycle indicator designed to identify structure, momentum, and continuation — not random signals.
This script strictly enforces the BBMA trading cycle and only allows continuation and re-entry signals when the market context is valid.
Core Components
Bollinger Bands (20 SMA, configurable)
WMA 5 & WMA 10 (High / Low)
EMA 50 for trend confirmation
BBMA Cycle Logic (Strict Flow)
All continuation setups require the full BBMA sequence to complete:
EXT (Extreme)
TPW (TP Wajib)
MHV (Market Hilang Volume)
Only after this sequence is completed will continuation setups be allowed.
This prevents early, unstructured, and low-quality signals.
Signals Included
EXT – MA pushes outside Bollinger Band
TPW – price reacts to opposite MA5 after EXT
MHV – price fails to break Bollinger Band
CSAK – continuation candle inside BB zone
CSM – strong momentum candle closing fully outside BB
Re-Entry – controlled pullback after CSAK or CSM
Each CSAK / CSM setup:
Appears only once
Waits for re-entry or invalidation
Is canceled immediately by an opposite CSAK or CSM
Re-Entry Conditions
Pullback to MA5 High (Sell) or MA5 Low (Buy)
Default Trend Confirmation (IMPORTANT)
By default, Re-Entry uses the CURRENT timeframe trend as confirmation:
Sell Re-Entry → Mid BB below EMA50
Buy Re-Entry → Mid BB above EMA50
This prevents:
Counter-trend re-entries
Late or forced continuation trades
Chasing exhausted moves
Optional entry confirmation:
-Touch MA5 only
-Touch MA5 + close inside MA5 band
Valid within 10 candles after the setup
Must match the last active setup (CSAK or CSM)
Dynamic Multi-Timeframe Trend Confirmation
Trend confirmation adapts automatically to the chart timeframe:
Chart TF | Trend Confirmation
5m | M15 + H1
15m | H1 + H4
1H | H4
4H | Daily
Daily | Current TF
Used for:
Filtering CSAK / CSM setups
Optional Re-Entry confirmation
Visual trend tables
Alerts
Trend Filter Modes
You control how strict the trend filtering is:
-No Filter
-Higher TF Only
-Current TF Only
-Higher TF + Current TF
A Skip Current TF Check option is available for advanced users who want earlier signals before full confirmation.
Invalidation Rules
Any opposite CSAK or CSM immediately cancels all pending setups and re-entries
Prevents holding bias when market structure flips
Visual & UX Features
Clean BB + MA layout (matches BBMA Signal Pro reference)
No duplicate labels
Clear setup → continuation → re-entry flow
Dynamic trend tables
-Higher timeframe trend table
-Current timeframe trend (Mid BB vs EMA50)
Alerts (Production-Ready)
Matches visual logic exactly
Supports webhook automation
Re-Entry alerts respect:
-Trend confirmation
-Re-Entry mode timing (touch vs close)
JSON payload includes:
Price
SL / TP reference
Trend context
Chart link
Who This Script Is For
✔ BBMA traders who follow structure
✔ Traders who respect trend alignment
✔ Traders who want re-entries done properly
✖ Not for scalping noise
✖ Not for counter-trend gambling
Final Note
This is not a signal spam indicator.
It is a decision-filtering system .
If you understand BBMA, this script enforces discipline.
If you don’t, it will expose impatience very quickly.
Trade the cycle. Follow the trend. Re-enter with confirmation.

ADX Volatility Waves [BOSWaves]ADX Volatility Waves - Trend-Weighted Volatility Mapping with State-Based Wave Transitions
Overview
ADX Volatility Waves is a regime-aware volatility framework designed to map statistically significant price extremes through adaptive wave structures driven by trend strength.
Rather than treating volatility as a static dispersion metric, this indicator conditions all volatility expansion, contraction, and zone placement on ADX-derived trend intensity. Price behavior is interpreted through wave-like transitions between balance, expansion, and exhaustion states rather than isolated band interactions.
The result is a dynamic, gradient-based wave system that visually encodes volatility cycles and regime shifts in real time, allowing traders to contextualize price movement within trend-weighted volatility waves.
Price is evaluated not by static thresholds, but by its position and progression within adaptive volatility waves shaped by directional strength.
Conceptual Framework
ADX Volatility Waves is built on the premise that volatility unfolds in waves, not straight lines.
Traditional volatility tools identify dispersion but fail to account for how volatility behaves differently across trend regimes. By embedding ADX directly into volatility construction, this indicator ensures that volatility waves expand during strong directional phases and compress during weak or transitioning regimes.
Three guiding principles define the framework:
Volatility must be conditioned on trend strength
Extremes occur within zones, not at lines
Signals should emerge from completed wave transitions, not instantaneous touches
This reframes analysis from reactive mean-reversion toward regime-aware wave interpretation.
Theoretical Foundation
The indicator fuses directional movement theory with statistical volatility modeling.
Bollinger-derived dispersion provides the structural base, while ADX normalization controls the amplitude of volatility waves. As ADX increases, volatility waves widen and deepen; as ADX weakens, waves compress and tighten around equilibrium.
From this foundation, extended upper and lower wave zones are constructed and smoothed to represent statistically significant expansion and contraction phases.
At its core are three interacting systems:
ADX-Controlled Volatility Engine : Standard deviation is dynamically scaled using normalized ADX values, producing trend-weighted volatility waves.
Wave Zone Construction : Smoothed volatility boundaries are offset and expanded to form upper and lower wave zones, defining overextension and compression regions.
State-Based Wave Transition Logic : Signals occur only after price completes a full wave cycle: expansion into an extreme wave zone followed by a confirmed return to equilibrium.
This structure ensures that signals reflect completed volatility waves, not transient noise.
How It Works
ADX Volatility Waves processes price action through layered wave mechanics:
Trend-Weighted Volatility Calculation : Volatility boundaries are dynamically adjusted using ADX influence, allowing wave amplitude to scale with trend strength.
Structural Smoothing : Volatility boundaries are smoothed to stabilize wave geometry and reduce short-term distortions.
Wave Offset & Expansion : Upper and lower wave zones are positioned beyond equilibrium and expanded proportionally to volatility range, forming clearly defined expansion waves.
Gradient Wave Depth Mapping : Each wave zone is subdivided into multiple gradient layers, visually encoding increasing extremity as price moves deeper into a wave.
Wave State Tracking & Cooldown Control : The system tracks prior wave occupancy, enforces neutral stabilization periods, and applies cooldowns to prevent overlapping wave signals.
Compression Detection : Volatility width monitoring identifies compression phases, highlighting conditions where new volatility waves are likely to form.
Together, these processes create a continuous, adaptive wave map of volatility behavior.
Interpretation
ADX Volatility Waves reframes market reading around volatility cycles:
Upper Volatility Waves (Red Gradient) : Represent upside expansion phases. Deeper wave penetration indicates increased overextension relative to trend-adjusted volatility.
Lower Volatility Waves (Green Gradient) : Represent downside expansion phases. Sustained presence signals pressure, while exits toward balance suggest wave completion.
Equilibrium Zone : The neutral region between volatility waves. Confirmed re-entry into this zone marks the completion of a wave cycle and forms the basis for BUY and SELL signals.
Regime Context via ADX : Strong ADX regimes widen waves, reducing premature reversal signals. Weak ADX regimes compress waves, increasing sensitivity to reversion.
Wave progression and completion matter more than single-bar interactions.
Signal Logic & Visual Cues
ADX Volatility Waves produces single-entry BUY and SELL labels as its visual cues, plotted only when price first enters a volatility wave zone after the defined cooldown period.
Buy Signal (Bottom Zone Entry) : A BUY label appears when price enters the lower volatility wave (oversold zone). This highlights potential expansion into undervalued extremes, providing visual context for trend assessment rather than a guaranteed execution trigger.
Sell Signal (Top Zone Entry) : A SELL label appears when price enters the upper volatility wave (overbought zone). This marks potential overextension into upper volatility extremes, serving as a contextual indicator of trend stress.
All labels respect cooldown tracking to prevent clustering. Alerts are tied directly to these zone-entry signals, and a separate alert monitors volatility squeezes for awareness of compression periods.
Strategy Integration
ADX Volatility Waves integrates cleanly into volatility-aware trading frameworks:
Wave Context Mapping : Use wave depth to assess expansion and exhaustion risk rather than forcing immediate entries.
Transition-Based Execution : Prioritize BUY and SELL signals formed after confirmed wave completion.
Trend-Regime Filtering : In strong ADX regimes, treat waves as continuation pressure. In weak regimes, favor completed wave reversions.
Volatility Cycle Awareness : Monitor compression phases to anticipate the emergence of new volatility waves.
Multi-Timeframe Alignment : Apply higher-timeframe ADX regimes to contextualize lower-timeframe wave behavior.
Technical Implementation Details
Core Engine : ADX-normalized volatility expansion
Wave System : Smoothed, offset, expanded volatility waves
Visualization : Multi-layer gradient wave zones
Signal Logic : State-based wave transitions with cooldown enforcement
Alerts : Wave entry, wave completion, volatility compression
Performance Profile : Lightweight, real-time optimized overlay
Optimal Application Parameters
Timeframe Guidance:
1 - 5 min : Short-term volatility waves and intraday transitions
15 - 60 min : Structured intraday wave cycles
4H - Daily : Macro volatility regimes and expansion phases
Suggested Baseline Configuration:
BB Length : 20
BB StdDev : 1.5
ADX Length : 14
ADX Influence : 0.8
Wave Offset : 1.0
Wave Width : 1.0
Neutral Confirmation : 5 bars
These suggested parameters should be used as a baseline; their effectiveness depends on the asset volatility, liquidity, and preferred entry frequency, so fine-tuning is expected for optimal performance.
Performance Characteristics
High Effectiveness:
Markets exhibiting rhythmic volatility expansion and contraction
Assets with responsive ADX regime behavior
Reduced Effectiveness:
Erratic, news-driven price action
Illiquid markets with distorted volatility metrics
Integration Guidelines
Confluence : Combine with BOSWaves structure or trend tools
Discipline : Respect wave completion and cooldown logic
Risk Framing : Interpret wave depth probabilistically, not predictively
Regime Awareness : Always contextualize waves within ADX strength
Disclaimer
ADX Volatility Waves is a professional-grade volatility and regime-mapping tool. It does not predict price and does not guarantee profitability. Performance depends on market conditions, parameter calibration, and disciplined execution. BOSWaves recommends using this indicator as part of a comprehensive analytical framework incorporating trend, volatility, and structural context.

Swing Trading Indicator: RSI + EMA + MACD + BB Signals**Swing Trading Indicator: Multi-Indicator Confluence Signals**
This indicator identifies high-probability swing trading setups using RSI pullbacks, EMA trend filter, MACD momentum confirmation, and Bollinger Bands for volatility-based entries. Perfect for daily/4H charts on stocks like TSLA or SPY.
**Key Features:**
- **Long Signal (Green ↑ Arrow)**: Uptrend (above 200 EMA) + RSI crosses above oversold (default 30) + MACD bullish crossover + Price at/near BB lower band + Optional squeeze filter.
- **Short Signal (Red ↓ Arrow)**: Mirror for downtrends.
- **Real-Time Dashboard**: Top-right table shows condition status (✓/✗) and "LONG/SHORT READY" alerts.
- **Customizable**: Adjust RSI levels, BB multiplier, enable/disable shorts/squeeze/arrows.
- **Alerts**: Built-in for entry notifications.
**How to Use:**
1. Add to chart (daily timeframe recommended).
2. Watch for arrows + "READY" in dashboard.
3. Manual entry: Risk 1% per trade, target 1:2 reward (e.g., trail stops).
**Backtest Note**: Based on similar setups, ~55-65% win rate in trending markets (test yourself). Not financial advice—trading involves risk. Fork and improve!
#swingtrading #RSI #MACD #BollingerBands #PineScript

Multi Timeframe Signal DashboardShows 10 indicators across 6 timeframes (5M, 15M, 30M, 1H, 4H, 1D):
EMA 50/100 crossover
RSI (with oversold/overbought highlighting)
MACD
DMI (DI+/DI-)
Stochastic (with extremes)
CCI
Bollinger Bands
VWAP
EMA 200 Trend
Momentum
Each cell shows ▲ (bullish/green) or ▼ (bearish/red), with scores per row and column, plus an overall BUY/SELL/HOLD signal.

CODEX OB + BBMA V1CODEX OB + BBMA is a multi-purpose Smart Money Concepts (SMC) indicator that automatically detects and visualizes key institutional trading elements such as Order Blocks, Fair Value Gaps, Rejection Blocks, Break of Structure, Pivots, High Volume Bars, and several qualitative SMC signals.
In addition to SMC tools, this indicator also incorporates multi-timeframe BBMA logic, allowing traders to view higher-timeframe momentum, trend direction, and volatility envelopes directly from the current chart. This makes it easier to align SMC setups—like OB, FVG, and BOS—with BBMA structure such as MA touches, re-entry zones, extreme candles, and volatility expansions.
This combination helps traders identify institutional footprints, multi-timeframe confluence, and displacement-based setups with high clarity.

Bollinger Bands Forecast [QuantAlgo]🟢 Overview
Bollinger Bands are widely recognized for mapping volatility boundaries around price action, but they inherently lag behind market movement since they calculate based on completed bars. The Bollinger Bands Forecast addresses this limitation by adding a predictive layer that attempts to project where the upper band, lower band, and basis line might position in the future. The indicator provides three unique analytical models for generating these projections: one examines swing structure and breakout patterns, another integrates volume flow and accumulation metrics, while the third applies statistical trend fitting. Traders can select whichever methodology aligns with their market view or trading style to gain visibility into potential future volatility zones that could inform position planning, risk management, and timing decisions across various asset classes and timeframes.
🟢 How It Works
The core calculation begins with traditional Bollinger Bands: a moving average basis line (configurable as SMA, EMA, SMMA/RMA, WMA, or VWMA) with upper and lower bands positioned at a specified number of standard deviations away. The forecasting extension works by first generating predicted price values for upcoming bars using the selected method. These projected prices then feed into a rolling calculation that simulates how the basis line would update bar by bar, respecting the mathematical properties of the chosen moving average type. As each new forecasted price enters the calculation window, the oldest historical price drops out, mimicking the natural progression of the moving average. The system recalculates standard deviation across this evolving price window and applies the multiplier to determine where upper and lower bands would theoretically sit. This process repeats for each of the forecasted bars, creating a connected chain of potential future band positions that render as dashed lines on the chart.
🟢 Key Features
1. Market Structure Model
This forecasting approach interprets price through the lens of swing analysis and structural patterns. The algorithm identifies pivot highs and lows across a definable lookback window, then tracks whether price is forming higher highs and higher lows (bullish structure) or lower highs and lower lows (bearish structure). The system looks for break of structure (BOS) when price pushes beyond a previous swing point in the trending direction, or change of character (CHoCH) when price starts creating opposing swing patterns.
When projecting future prices, the model considers current distance from recent swing levels and the strength of the established trend (measured by counting higher highs versus lower lows). If bullish structure dominates and price sits near a swing low, the forecast biases upward. Conversely, bearish structure near a swing high produces downward bias. ATR scaling ensures the projection magnitude relates to actual market volatility.
Practical Implications for Traders:
Useful when you trade based on swing points and structural breaks
The Structure Influence slider (0 to 1) lets you dial in how much weight structure analysis carries versus pure trend
Helps visualize where bands could form around key structural levels you're watching
Works better in trending conditions where structure patterns are clearer
Might be less effective in choppy, sideways markets without defined swings
2. Volume-Weighted Model
This method attempts to incorporate volume flow into the price forecast. It combines three volume-based metrics: On-Balance Volume (OBV) to track cumulative buying/selling pressure, the Accumulation/Distribution Line to measure money flow, and volume-weighted price changes to emphasize moves that occur on high volume. The algorithm calculates the slope of these indicators to determine if volume is confirming price direction or diverging from it.
Volume spikes above a configurable threshold are flagged as potentially significant, with the direction of the spike (whether it occurred on an up bar or down bar) influencing the forecast. When OBV, A/D Line, and volume momentum all align in the same direction, the model projects stronger moves. When they conflict or show weak volume support, the forecast becomes more conservative.
Practical Implications for Traders:
Relevant if you use volume analysis to confirm price moves
More meaningful in markets with reliable volume data
The Volume Influence parameter (0 to 1) controls how much volume factors into the projection
Volume Spike Threshold adjusts sensitivity to what constitutes unusual volume
Helps spot scenarios where volume doesn't support a move, suggesting possible consolidation
Might be less effective in low-liquidity instruments or markets where volume reporting is unreliable
3. Linear Regression Model
The simplest of the three methods, linear regression fits a straight line through recent price data using least-squares mathematics and extends that line forward. This creates a clean trend projection without conditional logic or interpretation of market characteristics. The forecast simply asks: if the recent trend continues at its current rate of change, where would price be in 10 or 20 bars?
Practical Implications for traders:
Provides a neutral, mathematical baseline for comparison
Works well when trends are steady and consistent
Can be useful for backtesting since results are deterministic
Requires minimal configuration beyond lookback period
Might not adapt to changing market conditions as dynamically as the other methods
Best suited for trending markets rather than ranging or volatile conditions
🟢 Universal Applications Across All Models
Regardless of which forecasting method you select, the indicator projects future Bollinger Band positions that may help with:
▶ Pre-planning entries and exits: See where potential support (lower band) or resistance (upper band) might develop before price gets there
▶ Volatility context: Observe whether forecasted bands are widening (suggesting potential volatility expansion) or narrowing (possible compression or squeeze setup)
▶ Target setting: Reference projected band levels when determining profit targets or stop placement
▶ Mean reversion scenarios: Visualize potential paths back toward the basis line when price extends to a band extreme
▶ Breakout anticipation: Consider where upper or lower bands might sit if price begins a strong directional move
▶ Strategy development: Build trading rules around forecasted band interactions, such as entering when price is projected to return to the basis or exit when forecasts show band expansion
▶ Method comparison: Switch between the three forecasting models to see if they agree or diverge, potentially using consensus as a confidence filter
It's critical to understand that these forecasts are projections based on recent market behavior. Markets are complex systems influenced by countless factors that cannot be captured in a technical calculation or predicted perfectly. The forecasted bands represent one possible scenario of how volatility might unfold, so actual price action may still diverge from these projections. Past performance and historical patterns provide no assurance of future results. Use these forecasts as one input within a broader trading framework that includes proper risk management, position sizing, and multiple forms of analysis. The value lies not in prediction accuracy but in helping you think probabilistically about potential market states and plan accordingly.

Fekry BB Entry/Exit with EMA FilterThis indicator is based on Bollinger Bands and exponential moving average strategy by Mr Kekry Zain

8EMA+BB-SubiProvides the facility to display 8 EMAs along with Bollinger Bands in the same indicator.

BB TrendDisclaimer: This Script works on daily chart for stocks. No SELL signal offered.
How to Use:
If BUY signal is shown on the chart, please take entry in the beginning of next candle.
please comment, if you find this useful.

Multi-Asset Option Strike PricesMulti-Asset Option Strike Prices automatically plots dynamic option strike levels for multiple assets on your chart. The indicator detects the active symbol and draws strike ladders above and below the current price using customizable strike increments (FX, indices, commodities, metals, etc.).
It also rounds price to the nearest strike, giving a precise structural reference used by institutional options desks. These strike levels help traders visualize trend direction, trend boundaries, and potential turning points based on how price interacts with known option clusters.
By mapping evenly spaced strike steps, the indicator also highlights natural stop-loss and take-profit zones within a trend, allowing traders to manage risk around predictable option-driven price levels.
Supports up to 10 assets, includes custom line styling, and provides automatic strike labeling.

BB Breakout + EMA Touch (50/100)Shows points only when BOTH happen on the same candle:
1️⃣ Price breaks through Bollinger Bands
2️⃣ Price touches (or crosses) EMA 50 or EMA 100

Bollinger Bands (MTF) + Bandwidth & %BJBB MTF: Bollinger Bands (MTF) + Bandwidth & %B
This Pine v6 indicator overlays multi‑timeframe Bollinger Bands on the price chart and adds a lower panel with normalized Bandwidth (histogram) and %B (line), plus squeeze/bulge markers and alerts for volatility shifts.
Key idea: See higher‑timeframe BB context on your working chart while tracking volatility regimes and price position within bands.
Features
- Multi‑Timeframe BBs: Up to four TFs (TF1–TF4) via request.security, each with visibility, colors, line widths, and optional background fills.
- Configurable Inputs: Length, MA type (SMA/EMA/SMMA/WMA/VWMA), Source, StdDev multiplier, and Offset.
- Lower Panel Metrics: %B (line) shows price position in the band; Bandwidth (histogram) shows width relative to basis, normalized and color‑coded vs its SMA. Reference lines at 0, 0.5, 1.0; raw highest/lowest bandwidth lines for context.
- Squeeze/Bulge Detection: Alerts when bandwidth equals the rolling lowest (Squeeze) or highest (Bulge).
How It Works
- Per timeframe, BBs use the chosen MA basis and standard deviation × multiplier to form upper/lower bands.
- A selectable TF (TF1–TF4) drives %B/Bandwidth calculations, independent of overlay TFs.
Bandwidth is normalized to the rolling min–max window with safeguards against division by zero.
Use Cases
- Visualize higher‑timeframe context directly on your chart.
- Spot volatility squeezes and expansions with objective markers and alerts.
Combine %B momentum with Bandwidth regime changes to refine entries and exits.

XAUUSD Pro Setup Suite manuel_lnt.fx is an advanced Pine Script v6 indicator designed exclusively for XAUUSD, built to automatically detect the 5 highest-probability setups in gold day trading.
It combines institutional price action, volatility patterns, mean reversion logic, and momentum confirmation to generate clean, filtered, and actionable signals.
The indicator automatically detects:
⸻
1️⃣ Break & Retest Premium (BR)
Identifies valid breaks of key levels and signals the retest with rejection wick, EMA20 trend confirmation, and neutral RSI.
→ Excellent for trend continuation.
⸻
2️⃣ Fakeout Liquidity Trap (FO)
Detects liquidity grabs above highs or below lows with an opposite close + engulfing candle confirmation.
→ The strongest setup for fast and explosive reversals on gold.
⸻
3️⃣ MACD Zero-Line Shift (MACD)
Signals when the MACD crosses the zero line while price breaks micro-structure.
→ Perfect for spotting the start of a new trend.
⸻
4️⃣ Bollinger Squeeze → Breakout (BB)
Recognizes volatility compression and signals when a breakout is likely to explode.
→ Ideal for clean breakout trades.
⸻
5️⃣ Mean Reversion on EMA50 (MR)
Highlights price extensions far away from the EMA50 with ATR confirmation and a reversal candle.
→ Great for pullbacks back toward the mean value.
