Total Volume BTC - Dollar [Sobhm]
Do you want an indicator that shows the total volume in Bitcoin vs Dollar?!
The BTCUSD - BTCUSDT - BTCUSDC total volume is covered by the "Total Volume BTC - Dollar " indicator.
You can see the differences between simple volume and the collected volume using "Total Volume BTC - Dollar ".
The volume of the following pairs are collected:
'BITMEX:XBTUSD'
'BINANCE:BTCUSDT'
'BINANCE:BTCUSDTPERP'
'BITSTAMP:BTCUSD'
'COINBASE:BTCUSD'
'BITFINEX:BTCUSD'
'BYBIT:BTCUSD'
'GEMINI:BTCUSD'
'OANDA:BTCUSD'
'FTX:BTCUSD'
'FX:BTCUSD'
'HUOBI:BTCUSDT'
'BYBIT:BTCUSDT'
'COINBASE:BTCUSDC'
'BITSTAMP:BTCUSDC'
'POLONIEX:BTCUSDC'
'KUCOIN:BTCUSDC'
'HITBTC:BTCUSDC'
The timeframe is adjustable based on minutes.
In den Scripts nach "bitcoin" suchen

Bullmarket Support BandThis Indicator displays a Bull Market Support Band for Bitcoin and Ethereum . If the bands cross and the price falls below them it usually means (at least by historical data) that the Bull Market ist coming to an end.
Use in weekly timeframe!

rocketLaunchI wanted to see if I could programmatically identify the conditions I saw just before Bitcoin broke its all-time high end of 2020. The signal picks up several rocket launch moments prior to launching which is quite cool. It also picks up a few false starts, however. In any case, I would have loved to be stopped out on those false starts but been there for all the starts this thing picks up.
It could probably use more confirmatory elements such as trailing conditions and volume perhaps?
BINANCE:BTCUSDTPERP

GBTC premium as a percentage of the bitcoin pricePlots the GBTC premium as a percentage of the bitcoin price at the close. It also includes the annual management fee (2% at the moment). It accrues on a daily, weekly or monthly basis depending on the chart resolution. (intraday not supported) The amount of bitcoin per gbtc share and the annual fee may be changed by Grayscale in the future. Those values can be easily update in the script settings.


BTC CME PremiumThe Chicago Mercantile Exchange bitcoin futures price versus a volume weighted index of bitcoin spot markets.
Positive values (green) means the CME price is higher than the spot index.
Negative values (red) means the CME price is lower than the spot index.
Whether a high CME price is bullish or not is up for debate so make of it what you will.
Weekends are highlighted with soft blue shading because during the weekend CME trading is halted which obviously has a big impact on the premium.
There's an option to turn this shading off.
Markets included for the volume weighted index:
Coinbase USD
Bitstamp USD
Bitfinex USD
Kraken USD
FTX USD
Binance USDT
Huobi USDT
This indicator is free, enjoy.

gold price levels denominated in usd/gramsPlots the gold price (USD) for the quantities (grams) identified as support or resistance in the indicator settings. Default values are:
75 gold grams
300 gold grams
500 gold grams
1000 gold grams
5000 gold grams
More context: The purchasing power of Bitcoin

[MACLEN] HODL ZONE RENKO
PLEASE READ!
Trade at your own risk. Please read about renko charts before using this indicator. This indicator is for educational purposes only.
This Indicator is only valid in renko charts with 1 second timeframe. For BTCUSDT . With the traditional method and the size box of 80.
With this indicator we can detect zones of buy and sell. Even that is not recommended to use leverage, I use it to find an entry and use only small leverages. It could be also used to accumulate and HODL bitcoin .
Please, comment anything.
POR FAVOR LEER!
Tradea bajo tu propio riesgo. Por favor lee sobre las graficas renko antes de usar este indicador. Este indicador es solamente con fines educativos.
Este indicador es válido solamente en graficas renko con un timeframe de 1 segundo. Para BTCUSDT . Con cajas del método tradicional de un tamaño de 80.
Con este indicador podemos detectar zonas de compra y venta. A pesar de que no es recomendable usar apalancamiento, yo lo uso para encontrar entradas y solo uso apalancamientos pequeños. También podría usarse para acumular y holdear bitcoin .
Por favor, escríbeme cualquier duda o comentario.

BTC Aggregated Perps OBVAggregated on balance volume of the most relevant bitcoin perpetual swap contracts.
There's also an option to select which markets you want to include or exclude.
Complete list:
Binance USD
Binance USDT
Okex USD
Okex USDT
Bybit USD
Bybit USDT
Huobi USD
Bitmex XBT
FTX USD
Deribit USD
Kraken XBT

BTC Aggregated Spot OBVAggregated on balance volume of the most relevant bitcoin spot markets.
There's also an option to select which markets you want to include or exclude.
Complete list:
Binance USDT
Huobi USDT
Okex USDT
Poloniex USDT
Coinbase USD
Bitstamp USD
Bitfinex USD
Kraken USD
Gemini USD
FTX USD

BTC Aggregated Perps VolumeAggregated volume for the most relevant bitcoin perpetual swap contracts, denominated in US dollars.
There's also an option to select which markets you want to include or exclude.
Complete list:
Binance USD
Binance USDT
Okex USD
Okex USDT
Bybit USD
Bybit USDT
Huobi USD
Bitmex XBT
FTX USD
Deribit USD
Kraken XBT

BTC Aggregated Spot VolumeAggregated volume of the most relevant bitcoin spot markets.
There's also an option to select which markets you want to include or exclude.
Complete list:
Binance USDT
Binance BUSD
Coinbase USD
Coinbase EUR
Bitstamp USD
Bitstamp EUR
Kraken USD
Kraken EUR
Bitfinex USD
Gemini USD
Huobi USDT
Okex USDT
Bitflyer JPY
Bithumb KRW
FTX USD
CME
Grayscale

BTC Bitmex Index PremiumThe price difference between the last price of the Bitmex XBT/USD perpetual swap contract and the BXBT spot bitcoin dollar index.
Positive values (green) means the BXBT index is trading at a premium, which is considered bullish.
Negative values (red) means the BXBT index is trading at a discount, which is considered bearish.

GBTC & BTCE Premium Indicator- This indicator illustrates the premium of GBTC and the European equivalent, BTCE. Relative to the spot price of Bitcoin
- It represents the premium investors are willing to pay to be able to gain exposure to Bitcoin . Whilst holding them in an investment vehicle such as a 401k or an ISA.
- The premiums can be plotted. GBTC vs BTCUSD and BTCE vs BTCEUR
OR
- The "real price" of BTCUSD , GBTC and BTCE (denominated in USD) can be plotted against each other

S2F Price LevelsThis is the indicator that plots Bitcoin's Stock to Flow model price and its significant levels.
Grey: S2F price
Green: S2F bottom (S2F multiple of 0.5)
Blue: S2F mode (S2F multiple of 0.67)
Red: S2F top

Pixel ArtHaving Fun with Arrays.
I couldn't load all of the images into their respective arrays without getting an "Internal Pine error" So I commented out some of them. You can pop them back in, but make sure to disable another in its place.
Vader
Pine Logo
&hearts
Bitcoin
pAulse

My BTC log curveLogarithmic regression of the USD price of Bitcoin , calculated according to the equation:
y=A*exp(beta*x^lambda + c) + m*x + b
where x is the number of days since the genesis block. All parameters are editable in the script options.

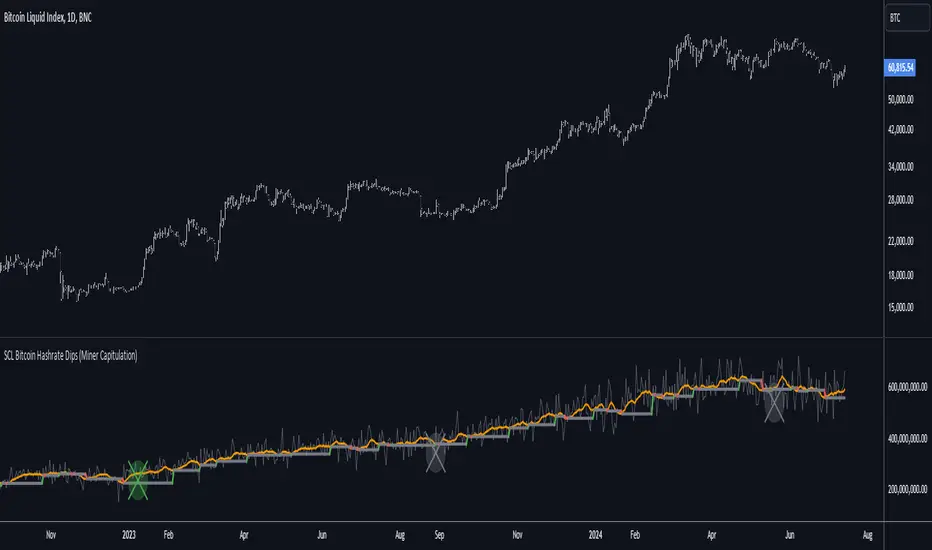
[SCL] Bitcoin Hashrate Dips (Miner Capitulation)Gives long-term buy signals for Bitcoin from dips and recoveries in the hashrate (the "miner capitulation" theory). It has an overlay and a standalone mode and is fully configurable. It uses Williams Lows and ATR instead of moving averages.
Features that might be interesting for Pinescripters:
+ Automatic (as far as is possible currently) adjustment of plots for overlay and standalone display modes.
+ A neat label function for debugging floats
+ Fully commented
+ The debug that I used to overcome problems in developing it is left in
+ Ideas for how to deal with a wildly oscillating and exponentially increasing data source
You need to run this indicator on the Bitcoin daily chart for it to make any sense. The best is a BTC/USD chart with a long history, such as BNC:BLX.
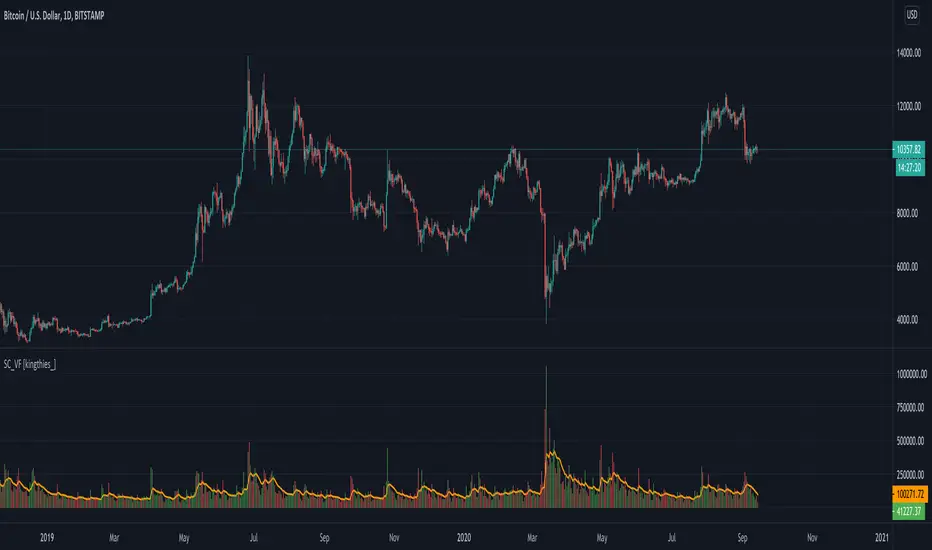
Stablecoin Volume Flow [kingthies_]Stablecoin Volume Flow into BTCUSD/BTC-Stablecoin pairings
Exchanges Used
Coinbase
Kraken
Bittrex
Binance
Huobi
Bitstamp
Gemini
Bitfinex
Our aim here is simple...to combine the overall volume flow from Fiat or stable currencies into the crypto-markets.
This is the first portion of a series I plan to share involving a holistic approach to understanding the overall crypto-ecosystem. I've included several of the highest ranking by volume exchanges and their accompanying older/well known stablecoins.
Also, the historic data for the newer stable coins made the study invalid due to limited sample size. That included coins like USDC, DAI, GUSD, BUSD and more. For this reason, the 10 sources of data here adequately provide the data needed to see a full view of the market volume going in and out of bitcoin at any given moment
Bull Market BarrierThis is a very special band of long-term Bollinger Bands derived from Fib values, and is specifically made for Bitcoin .
It represents one of, if not the strongest dynamic resistance in the BTCUSD market, and divides the market into bull and bear cycles.
The BMB uses the BLX long-term data.

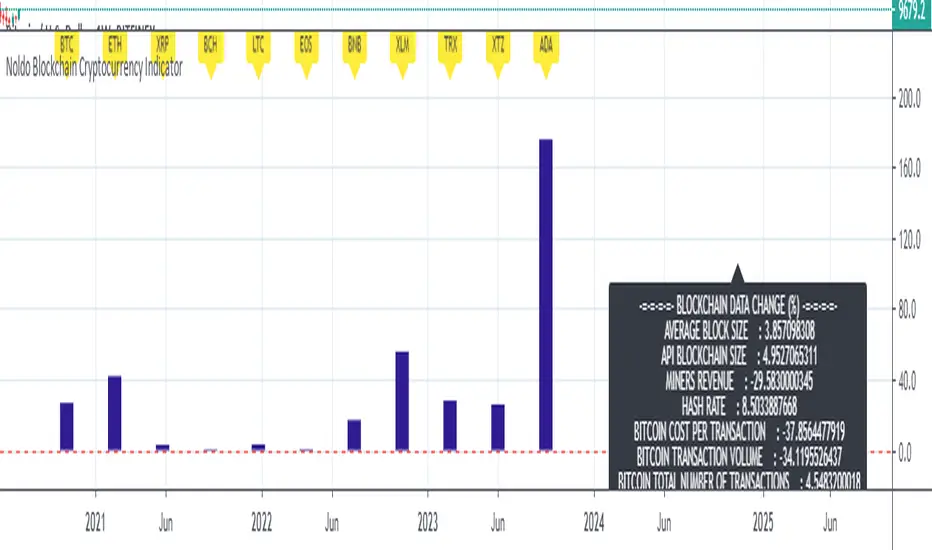
Noldo Blockchain Cryptocurrency Indicator
Hello, this script has the same logic as Noldo CFTC COT Forex Indicator :
And Noldo CFTC COT Commodities Indicator :
*
Script briefly calculates the period length between two signals of Pivot Reversal Strategy when new signal arrives and allows us to see relative Blockchain data and price changes of Major Cryptocurrencies over that automatic length.
This saves us from the hassle and time wasting of searching for a reference point.
Usage
This script works only on all Bitcoin / U.S Dollar pairs and futures.
It only works on 1W graphics.
ICOT data are pulled via Quandl
NOTE :
Since blockchain data is very votalile, 7-day ema values are adjusted to take into account.
Regards.
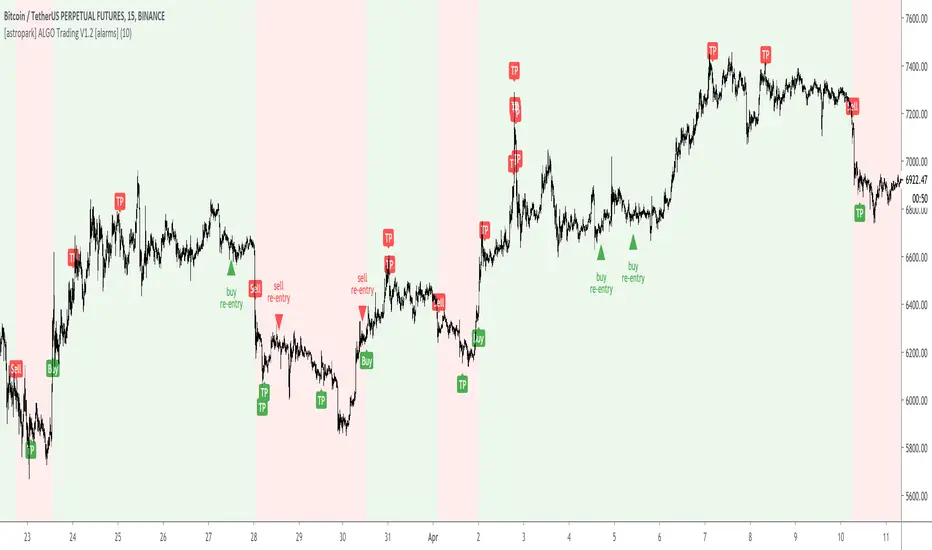
[astropark] ALGO Trading V1.2 [alarms]Dear Followers,
today another awesome Swing and Scalping Trading Strategy indicator : the upgraded version of ALGO Trading V1 for Binance Bitcoin PERP on 15m timeframe!
It is runnable on a bot , just write me in order to help you do it.
If you are a scalper or you are a swing trader, you will love suggested entries for fast and long-lasting profit.
Keep in mind that a proper trailing stop strategy and risk management and money management strategies are very important (DM me if you need any clarification on these points).
This strategy has the following options:
enable/disable signals on chart
enable/disable bars and background coloring based on trend
enable/disable a Filter Noise option, which reduces overtrading
enable/disable a Trailing Stop option
enable/disable/config a Take Profit option, with Re-Entry
enable/disable a secret Smart Close Option which may improve profit on your chart (again, check it on you chart if it helps or not)
This strategy only trigger 1 buy (where to start a long trade) or 1 sell (for short trade). If you enable Take Profit / Stop Loss option, consider that many TP can be triggered before trend reversal, so take partial profit on every TP an eventually buy/sell back lower/higher on RE-ENTRY signal to maximize your profit.
This is not the "Holy Grail", so use proper money and risk management strategies.
This indicator will let you set all alerts you need in order to get notified whenever a new signal is triggered.
To check its backtesting, you should use the strategy version, that you can find by searching for "ALGO Trading V1.2" or here below:
You can check out previous ALGO Trading V1 indicator here below:
This is a premium indicator , so send me a private message in order to get access to this script.