Momentum-Based Fair Value Gaps [BackQuant]Momentum-Based Fair Value Gaps
A precision tool that detects Fair Value Gaps and color-codes each zone by momentum, so you can quickly tell which imbalances matter, which are likely to fill, and which may power continuation.
What is a Fair Value Gap
A Fair Value Gap is a 3-candle price imbalance that forms when the middle candle expands fast enough that it leaves a void between candle 1 and candle 3.
Bullish FVG : low > high . This marks a bullish imbalance left beneath price.
Bearish FVG : high < low . This marks a bearish imbalance left above price.
These zones often act as magnets for mean reversion or as fuel for trend continuation when price respects the gap boundary and runs.
Why add momentum
Not all gaps are equal. This script measures momentum with RSI on your chosen source and paints each FVG with a momentum heatmap. Strong-momentum gaps are more likely to hold or propel continuation. Weak-momentum gaps are more likely to fill.
Core Features
Auto FVG Detection with size filters in percent of price.
Momentum Heatmap per gap using RSI with smoothing. Multiple palettes: Gradient, Discrete, Simple, and scientific schemes like Viridis, Plasma, Inferno, Magma, Cividis, Turbo, Jet, plus Red-Green and Blue-White-Red.
Bull and Bear Modes with independent toggles.
Extend Until Filled : keep drawing live to the right until price fully fills the gap.
Auto Remove Filled for a clean chart.
Optional Labels showing the smoothed RSI value stored at the gap’s birth.
RSI-based Filters : only accept bullish gaps when RSI is oversold and bearish gaps when RSI is overbought.
Performance Controls : cap how many FVGs to keep on chart.
Alerts : new bullish or bearish FVG, filled FVG, and extreme RSI FVGs.
How it works
Source for Momentum : choose Returns, Close, or Volume.
Returns computes percent change over a short lookback to focus on impulse quality.
RSI and Smoothing : RSI length and a small SMA smooth the signal to stabilize the color coding.
Gap Scan : each bar checks for a 3-candle bullish or bearish imbalance that also clears your minimum size filter in percent of price.
Heatmap Color : the gap is painted at creation with a color from your palette based on the smoothed RSI value, preserving the momentum signature that formed it.
Lifecycle : if Extend Unfilled is on, the zone projects forward until price fully trades through the far edge. If Auto Remove is on, a filled gap is deleted immediately.
How to use it
Scan for structure : turn on both bullish and bearish FVGs. Start with a moderate Min FVG Size percent to reduce noise. You will see stacked clusters in trends and scattered singletons in chop.
Read the colors : brighter or stronger palette values imply stronger momentum at gap formation. Weakly colored gaps are lower conviction.
Decide bias : bullish FVGs below price suggest demand footprints. Bearish FVGs above price suggest supply footprints. Use the heatmap and RSI value to rank importance.
Choose your playbook :
Mean reversion : target partial or full fills of opposing FVGs that were created on weak momentum or that sit against higher timeframe context.
Trend continuation : look for price to respect the near edge of a strong-momentum FVG, then break away in the direction of the original impulse.
Manage risk : in continuation ideas, invalidation often sits beyond the opposite edge of the active FVG. In reversion ideas, invalidation sits beyond the gap that should attract price.
Two trade playbooks
Continuation - Buy the hold of a bullish FVG
Context uptrend.
A bullish FVG prints with strong RSI color.
Price revisits the top of the gap, holds, and rotates up. Enter on hold or first higher low inside or just above the gap.
Invalidation: below the gap bottom. Targets: prior swing, measured move, or next LV area.
Reversion - Fade a weak bearish FVG toward fill
Context range or fading trend.
A bearish FVG prints with weak RSI color near a completed move.
Price fails to accelerate lower and rotates back into the gap.
Enter toward mid-gap with confirmation.
Invalidation: above gap top. Target: opposite edge for a full fill, or the gap midline for partials.
Key settings
Max FVG Display : memory cap to keep charts fast. Try 30 to 60 on intraday.
Min FVG Size % : sets a quality floor. Start near 0.20 to 0.50 on liquid markets.
RSI Length and Smooth : 14 and 3 are balanced. Increase length for higher timeframe stability.
RSI Source :
Returns : most sensitive to true momentum bursts
Close : traditional.
Volume : uses raw volume impulses to judge footprint strength.
Filter by RSI Extremes : tighten rules so only the most stretched gaps print as signals.
Heatmap Style and Palette : pick a palette with good contrast for your background. Gradient for continuous feel, Discrete for quick zoning, Simple for binary, Palette for scientific schemes.
Extend Unfilled - Auto Remove : choose live projection and cleanup behavior to match your workflow.
Reading the chart
Bullish zones sit beneath price. Respect and hold of the upper boundary suggests demand. Strong green or warm palette tones indicate impulse quality.
Bearish zones sit above price. Respect and hold of the lower boundary suggests supply. Strong red or cool palette tones indicate impulse quality.
Stacking : multiple same-direction gaps stacked in a trend create ladders. Ladders often act as stepping stones for continuation.
Overlapping : opposing gaps overlapping in a small region usually mark a battle zone. Expect chop until one side is absorbed.
Workflow tips
Map higher timeframe trend first. Use lower timeframe FVGs for entries aligned with the higher timeframe bias.
Increase Min FVG Size percent and RSI length for noisy symbols.
Use labels when learning to correlate the RSI numbers with your palette colors.
Combine with VWAP or moving averages for confluence at FVG edges.
If you see repeated fills and refills of the same zone, treat that area as fair value and avoid chasing.
Alerts included
New Bullish FVG
New Bearish FVG
Bullish FVG Filled
Bearish FVG Filled
Extreme Oversold FVG - bullish
Extreme Overbought FVG - bearish
Practical defaults
RSI Length 14, Smooth 3, Source Returns.
Min FVG Size 0.25 percent on liquid majors.
Heatmap Style Gradient, Palette Viridis or Turbo for contrast.
Extend Unfilled on, Auto Remove on for a clean live map.
Notes
This tool does not predict the future. It maps imbalances and momentum so you can frame trades with clearer context, cleaner invalidation, and better ranking of which gaps matter. Use it with risk control and in combination with your broader process.
In den Scripts nach "bias" suchen

US30 Quarter Levels (125-point grid) by FxMogul🟦 US30 Quarter Levels — Trade the Index Like the Banks
Discover the Dow’s hidden rhythm.
This indicator reveals the institutional quarter levels that govern US30 — spaced every 125 points, e.g. 45125, 45250, 45375, 45500, 45625, 45750, 45875, 46000, and so on.
These are the liquidity magnets and reaction zones where smart money executes — now visualized directly on your chart.
💼 Why You Need It
See institutional precision: The Dow respects 125-point cycles — this tool exposes them.
Catch reversals before retail sees them: Every impulse and retracement begins at one of these zones.
Build confluence instantly: Perfectly aligns with your FVGs, OBs, and session highs/lows.
Trade like a professional: Turn chaos into structure, and randomness into rhythm.
⚙️ Key Features
Automatically plots US30 quarter levels (…125 / …250 / …375 / …500 / …625 / …750 / …875 / …000).
Color-coded hierarchy:
🟨 xx000 / xx500 → major institutional levels
⚪ xx250 / xx750 → medium-impact levels
⚫ xx125 / xx375 / xx625 / xx875 → intraday liquidity pockets
Customizable window size, label spacing, and line extensions.
Works across all timeframes — from 1-minute scalps to 4-hour macro swings.
Optimized for clean visualization with no clutter.
🎯 How to Use It
Identify liquidity sweeps: Smart money hunts stops at these quarter zones.
Align structure: Combine with session opens, order blocks, or FVGs.
Set precision entries & exits: Trade reaction-to-reaction with tight risk.
Plan daily bias: Watch how New York respects these 125-point increments.
🧭 Designed For
Scalpers, day traders, and swing traders who understand that US30 doesn’t move randomly — it moves rhythmically.
Perfect for traders using ICT, SMC, or liquidity-based frameworks.
⚡ Creator’s Note
“Every 125 points, the Dow breathes. Every 1000, it shifts direction.
Once you see the rhythm, you’ll never unsee it.”
— FxMogul

Mayer Mutiple | QRMayer Multiple | QR — Publication Description
What it does
Mayer Multiple | QR is a cycle/valuation style oscillator that measures how far price sits above or below its longer-term average and normalizes that distance by current volatility. It helps you spot overheated extensions and deep discounts relative to trend, with adaptive bands that expand/contract as conditions change.
How it works (principle)
The script compares price to a long lookback moving average (default uses a 200-period average of ohlc4) and turns that gap into an oscillator.
It then computes a rolling standard deviation of that oscillator to build dynamic upper/lower bands (±1σ, ±2σ, ±3σ).
When the oscillator rises above the upper bands, the move is statistically stretched (potential distribution/risk). When it falls below the lower bands, it’s statistically depressed (potential accumulation/opportunity).
A small baseline band around zero (scaled from volatility) provides a quick trend-bias read without crowding the view.
Why this matters: Classic “Mayer Multiple” tools use a fixed threshold over a single moving average. This version is volatility-aware: its bands adapt to the market’s current dispersion, reducing false signals in quiet regimes and avoiding constant “overheat” flags in high-vol regimes.
What you see on the chart
White oscillator line: volatility-normalized deviation from the long-term average.
Adaptive bands:
Upper 1/2/3σ (shaded blue tones) = progressively more extended.
Lower 1/2/3σ (shaded green tones) = progressively more discounted.
Baseline ribbon: subtle band around zero for quick bias.
Background highlights: optional flashes when the oscillator exceeds the ±3σ extremes.
All visuals are generated by this script alone; no other indicator is required to understand usage.
How to use it
Context: Use on higher timeframes to gauge where price sits versus its long-term “fair value corridor.”
Signal reading:
Above +1σ/+2σ/+3σ: extension → consider de-risking, trailing stops, or waiting for mean reversion.
Below −1σ/−2σ/−3σ: discount → consider scaling in, watching for trend resumption cues.
Confluence: Treat it as a condition, not a trigger. Pair with structure (higher highs/lows), breadth, or momentum for entries/exits.
Regime awareness: As volatility rises, bands widen; prioritize trend context over single print extremes.
Inputs you can tune
Color mode: preset palettes for lines/fills/backgrounds.
Dynamic Threshold Length: lookback for the volatility (σ) calculation driving the adaptive bands.
Source: price input used for the long-term reference.
Band toggles: show/hide ±1σ / ±2σ / ±3σ envelopes to reduce clutter.
Originality & value
Adaptive, volatility-aware implementation of a Mayer-style concept: rather than one fixed threshold, it scales to current regime, keeping readings comparable across cycles.
Clear, clean presentation (oscillator + bands + optional background) designed for publication with a clean chart so the script’s output is immediately identifiable.
Offers actionable context (stretch/discount zones) while leaving trade execution to the user’s process.
Limitations & good practices
Best used for context and risk framing, not stand-alone entries.
Adaptive bands depend on the lookback you choose; very short windows can overfit, very long windows can lag.
Extremes can persist in strong trends—don’t fade momentum blindly.
Disclaimer
This tool is for research and education only and not investment advice. Markets involve risk. Past performance does not predict or guarantee future results. Use prudent risk management and test settings on your instruments/timeframes.

Machine Learning Price Predictor: Ridge AR [Bitwardex]🔹Machine Learning Price Predictor: Ridge AR is a research-oriented indicator demonstrating the use of Regularized AutoRegression (Ridge AR) for short-term price forecasting.
The model combines autoregressive structure with Ridge regularization , providing stability under noisy or volatile market conditions.
The latest version introduces Bull and Bear signals , visually representing the current momentum phase and model direction directly on the chart.
Unlike traditional linear regression, Ridge AR minimizes overfitting, stabilizes coefficient dynamics, and enhances predictive consistency in correlated datasets.
The script plots:
Fit Line — in-sample fitted data;
Forecast Line — out-of-sample projection;
Trend Segments — color-coded bullish/bearish sections;
Bull/Bear Labels 🐂🐻 — dynamic visual signals showing directional bias.
Designed for researchers, students, and developers, this tool helps explore regularized time-series forecasting in Pine Script™.
🧩 Ridge AR Settings
Training Window — number of bars used for model training;
Forecast Horizon — forecast length (bars ahead);
AR Order — number of lags used as features;
Ridge Strength (λ) — regularization coefficient;
Damping Factor — exponential trend decay rate;
Trend Length — period for trend/volatility estimation;
Momentum Weight — strength of the recent move;
Mean Reversion — pullback intensity toward the mean.
🧮 Data Processing
Prefilter:
None — raw close price;
EMA — exponential smoothing;
SuperSmoother — Ehlers filter for noise reduction.
EMA Length, SuperSmoother Length — smoothing parameters.
🖥️ Display Settings
Update Mode:
Lock — static model;
Update Once Reached — rebuild after forecast horizon;
Continuous — update every bar.
Forecast Color — projection line color;
Bullish/Bearish Colors — colors for trend segments.
🐂🐻 Bull/Bear Signal System
The Bull/Bear Signal System adds directional visual cues to highlight local momentum shifts and model-based trend confirmation.
Bull (🐂) — appears when upward momentum is confirmed (momentum > 0) .
Displayed below the bar, colored with Bullish Color.
Bear (🐻) — appears when downward momentum is dominant (momentum < 0) .
Displayed above the bar, colored with Bearish Color.
Signals are generated during model recalculations or when the directional bias changes in Continuous mode.
These visual markers are analytical aids , not trading triggers.
🧠 Core Algorithmic Components
Regularized AutoRegression (Ridge AR):
Solves: (X′X+λI)−1X′y
to derive stable regression coefficients.
Matrix and Pseudoinverse Operations — implemented natively in Pine Script™.
Prefiltering (EMA / Ehlers SuperSmoother) — stabilizes noisy data.
Forecast Dynamics — integrates damping, momentum, and mean reversion.
Trend Visualization — color-coded bullish/bearish line segments.
Bull/Bear Signal Engine — visualizes real-time impulse direction.
📊 Applications
Academic and educational purposes;
Demonstration of Ridge Regression and AR models;
Analysis of bull/bear market phase transitions;
Visualization of time-series dependencies.
⚠️ Disclaimer
This script is provided for educational and research purposes only.
It does not provide trading or investment advice.
The author assumes no liability for financial losses resulting from its use.
Use responsibly and at your own risk.

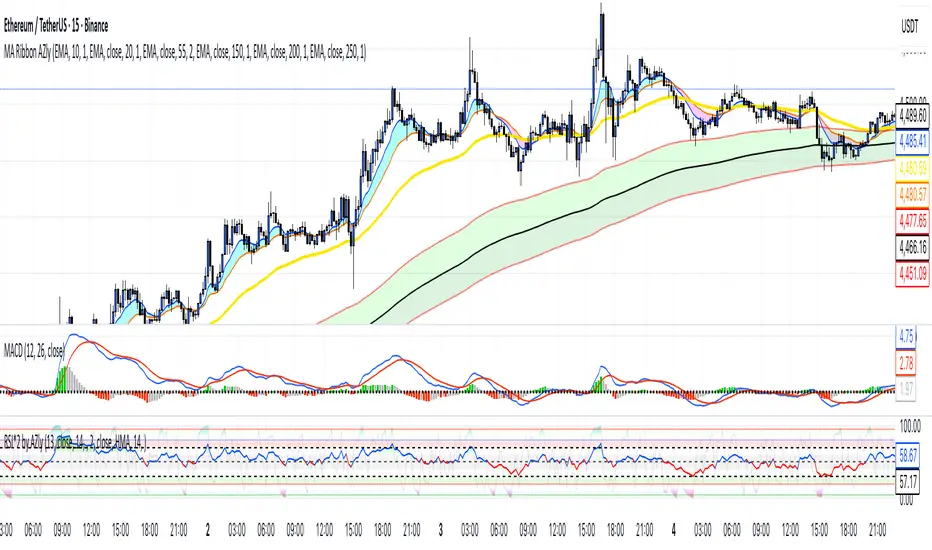
Moving Average Ribbon AZlyMoving Average Ribbon AZly
The Moving Average Ribbon AZly is a flexible trend-following indicator that visualizes market direction, strength, and transition phases using multiple customizable moving averages. It helps traders instantly identify when short-, medium-, and long-term trends align or diverge.
🔧 How it works
Up to six moving averages can be plotted, each with its own:
Type (SMA, EMA, SMMA, WMA, VWMA, or HMA)
Length, color, and width
Custom source input
The script also adds adaptive color fills between key pairs:
MA1–MA2: short-term momentum
MA4–MA5: mid-term bias
MA5–MA6: long-term trend
Bullish alignment paints green or blue ribbons, while bearish alignment turns them red or pink. The wider the ribbon, the stronger the trend separation.
💡 Why it’s better
Unlike typical ribbon indicators, this version offers full per-line customization, adaptive color fills, and a clean, high-contrast design that makes trend shifts instantly recognizable . It’s optimized for clarity, flexibility, and smooth performance on any market or timeframe.
🎯 Trading ideas
Trend confirmation: Trade only in the direction of the ribbon (green for long, red for short).
Early reversals: Watch for the fastest MAs (MA1–MA2) crossing the mid-term pair (MA4–MA5) as early signals of a trend shift.
Momentum compression: When the ribbon narrows or colors alternate rapidly, it signals consolidation or potential breakout zones.
Pullback entries: Enter trades when price bounces off the outer ribbon layer in the direction of the dominant trend.
Multi-timeframe use: Combine with a higher timeframe ribbon to confirm overall market bias.
📊 Recommended use
Works on all markets and timeframes. Ideal for trend-following, swing trading, and visual confirmation of price structure.
Opening Range Gaps [TakingProphets]What is an Opening Range Gap (ORG)?
In ICT, the Opening Range Gap is defined as the price difference between the previous session’s close (e.g., 4:00 PM EST in U.S. indices) and the current day’s open (9:30 AM EST).
That gap is a liquidity void—an area where no trading occurred during regular hours.
Why ICT Traders Care About ORG
Liquidity Void (Gap Fill Logic)
-Because the gap is an untraded area, it naturally acts as a draw on liquidity.
-Price often seeks to rebalance by retracing into or fully filling this void.
Premium/Discount Sensitivity
-Once the ORG is defined, ICT treats it as a mini dealing range.
-Above EQ (Consequent Encroachment) = algorithmic premium (sell-sensitive).
-Below EQ = algorithmic discount (buy-sensitive).
-Price reaction at these levels gives a precise read on institutional intent intraday.
Support/Resistance from ORG
-If the session opens above prior close, the gap often acts as support until violated.
-If the session opens below prior close, the gap often acts as resistance until reclaimed.
Key ICT Concepts Anchored to ORG
Consequent Encroachment (CE): The midpoint of the gap. The algo is highly sensitive to CE as a decision point: reject → continuation; reclaim → reversal.
Draw on Liquidity (DoL): Price is algorithmically “pulled” toward gap fills, CE, or the opposite side of the ORG.
Order Flow Confirmation: If price ignores the gap and runs away from it, this signals strong institutional order flow in that direction.
Confluence with Other Tools: FVGs, OBs, and HTF PD arrays often overlap with ORG levels, strengthening setups.
Practical Application for Traders
Bias Formation:
Use ORG EQ as a line in the sand for intraday bias.
If price trades below ORG EQ after the open → look for short setups into the prior day’s low or external liquidity.
If price trades above ORG EQ → favor longs into highs/liquidity pools.
Execution Framework:
Wait for liquidity raids or market structure shifts at ORG edges (.00, .25, .50, .75).
Target: EQ, opposite quarter, or full gap fill.
Precision Reads:
ORG lines let traders anticipate where algorithms are likely to respond, providing mechanical invalidation and clear targets without clutter.

SuperTrend Optimizer Remastered[CHE] SuperTrend Optimizer Remastered — Grid-ranked SuperTrend with additive or multiplicative scoring
Summary
This indicator evaluates a fixed grid of one hundred and two SuperTrend parameter pairs and ranks them by a simple flip-to-flip return model. It auto-selects the currently best-scoring combination and renders its SuperTrend in real time, with optional gradient coloring for faster visual parsing. The original concept is by KioseffTrading Thanks a lot for it.
For years I wanted to shorten the roughly two thousand three hundred seventy-one lines; I have now reduced the core to about three hundred eighty lines without triggering script errors. The simplification is generalizable to other indicators. A multiplicative return mode was added alongside the existing additive aggregation, enabling different rankings and often more realistic compounding behavior.
Motivation: Why this design?
SuperTrend is sensitive to its factor and period. Picking a single pair statically can underperform across regimes. This design sweeps a compact parameter grid around user-defined lower bounds, measures flip-to-flip outcomes, and promotes the combination with the strongest cumulative return. The approach keeps the visual footprint familiar while removing manual trial-and-error. The multiplicative mode captures compounding effects; the additive mode remains available for linear aggregation.
Originally (by KioseffTrading)
Very long script (~2,371 lines), monolithic structure.
SuperTrend optimization with additive (cumulative percentage-sum) scoring only.
Heavier use of repetitive code; limited modularity and fewer UI conveniences.
No explicit multiplicative compounding option; rankings did not reflect sequence-sensitive equity growth.
Now (remastered by CHE)
Compact core (~380 lines) with the same functional intent, no compile errors.
Adds multiplicative (compounding) scoring alongside additive, changing rankings to reflect real equity paths and penalize drawdown sequences.
Fixed 34×3 grid sweep, live ranking, gradient-based bar/wick/line visuals, top-table display, and an optional override plot.
Cleaner arrays/state handling, last-bar table updates, and reusable simplification pattern that can be applied to other indicators.
What’s different vs. standard approaches?
Baseline: A single SuperTrend with hand-picked inputs.
Architecture differences:
Fixed grid of thirty-four factor offsets across three ATR offsets.
Per-combination flip-to-flip backtest with additive or multiplicative aggregation.
Live ranking with optional “Best” or “Worst” table output.
Gradient bar, wick, and line coloring driven by consecutive trend counts.
Optional override plot to force a specific SuperTrend independent of ranking.
Practical effect: Charts show the currently best-scoring SuperTrend, not a static choice, plus an on-chart table of top performers for transparency.
How it works (technical)
For each parameter pair, the script computes SuperTrend value and direction. It monitors direction transitions and treats a change from up to down as a long entry and the reverse as an exit, measuring the move between entry and exit using close prices. Results are aggregated per pair either by summing percentage changes or by compounding return factors and then converting to percent for comparison. On the last bar, open trades are included as unrealized contributions to ranking. The best combination’s line is plotted, with separate styling for up and down regimes. Consecutive regime counts are normalized within a rolling window and mapped to gradients for bars, wicks, and lines. A two-column table reports the best or worst performers, with an optional row describing the parameter sweep.
Parameter Guide
Factor (Lower Bound) — Starting SuperTrend factor; the grid adds offsets between zero and three point three. Default three point zero. Higher raises distance to price and reduces flips.
ATR Period (Lower Bound) — Starting ATR length; the grid adds zero, one, and two. Default ten. Longer reduces noise at the cost of responsiveness.
Best vs Worst — Ranks by top or bottom cumulative return. Default Best. Use Worst for stress tests.
Calculation Mode — Additive sums percents; Multiplicative compounds returns. Multiplicative is closer to equity growth and can change the leaderboard.
Show in Table — “Top Three” or “All”. Fewer rows keep charts clean.
Show “Parameters Tested” Label — Displays the effective sweep ranges for auditability.
Plot Override SuperTrend — If enabled, the override factor and ATR are plotted instead of the ranked winner.
Override Factor / ATR Period — Values used when override is on.
Light Mode (for Table) — Adjusts table colors for bright charts.
Gradient/Coloring controls — Toggles for gradient bars and wick coloring, window length for normalization, gamma for contrast, and transparency settings. Use these to emphasize or tone down visual intensity.
Table Position and Text Size — Places the table and sets typography.
Reading & Interpretation
The auto SuperTrend plots one line for up regimes and one for down regimes. Color intensity reflects consecutive trend persistence within the chosen window. A small square at the bottom encodes the same gradient as a compact status channel. Optional wick coloring uses the same gradient for maximum contrast. The performance table lists parameter pairs and their cumulative return under the chosen aggregation; positive values are tinted with the up color, negative with the down color. “Long” labels mark flips that open a long in the simplified model.
Practical Workflows & Combinations
Trend following: Use the auto line as your primary bias. Enter on flips aligned with structure such as higher highs and higher lows. Filter with higher-timeframe trend or volatility contraction.
Exits/Stops: Consider conservative exits when color intensity fades or when the opposite line is approached. Aggressive traders can trail near the plotted line.
Override mode: When you want stability across instruments, enable override and standardize factor and ATR; keep the table visible for sanity checks.
Multi-asset/Multi-TF: Defaults travel well on liquid instruments and intraday to daily timeframes. Heavier assets may prefer larger lower bounds or multiplicative mode.
Behavior, Constraints & Performance
Repaint/confirmation: Signals are based on SuperTrend direction; confirmation is best assessed on closed bars to avoid mid-bar oscillation. No higher-timeframe requests are used.
Resources: One hundred and two SuperTrend evaluations per bar, arrays for state, and a last-bar table render. This is efficient for the grid size but avoid stacking many instances.
Known limits: The flip model ignores costs, slippage, and short exposure. Rapid whipsaws can degrade both aggregation modes. Gradients are cosmetic and do not change logic.
Sensible Defaults & Quick Tuning
Start with the provided lower bounds and “Top Three” table.
Too many flips → raise the lower bound factor or period.
Too sluggish → lower the bounds or switch to additive mode.
Rankings feel unstable → prefer multiplicative mode and extend the normalization window.
Visuals too strong → increase gradient transparency or disable wick coloring.
What this indicator is—and isn’t
This is a parameter-sweep and visualization layer for SuperTrend selection. It is not a complete trading system, not predictive, and does not include position sizing, transaction costs, or risk management. Combine with market structure, higher-timeframe context, and explicit risk controls.
Attribution and refactor note: The original work is by KioseffTrading. The script has been refactored from approximately two thousand three hundred seventy-one lines to about three hundred eighty core lines, retaining behavior without compiler errors. The general simplification pattern is reusable for other indicators.
Metadata
Name/Tag: SuperTrend Optimizer Remastered
Pine version: v6
Overlay or separate pane: true (overlay)
Core idea/principle: Grid-based SuperTrend selection by cumulative flip returns with additive or multiplicative aggregation.
Primary outputs/signals: Auto-selected SuperTrend up and down lines, optional override lines, gradient bar and wick colors, “Long” labels, performance table.
Inputs with defaults: See Parameter Guide above.
Metrics/functions used: SuperTrend, ATR, arrays, barstate checks, windowed normalization, gamma-based contrast adjustment, table API, gradient utilities.
Special techniques: Fixed grid sweep, compounding vs linear aggregation, last-bar UI updates, gradient encoding of persistence.
Performance/constraints: One hundred and two SuperTrend calls, arrays of length one hundred and two, label budget, last-bar table updates, no higher-timeframe requests.
Recommended use-cases/workflows: Trend bias selection, quick parameter audits, override standardization across assets.
Compatibility/assets/timeframes: Standard OHLC charts across intraday to daily; liquid instruments recommended.
Limitations/risks: Costs and slippage omitted; mid-bar instability possible; not suitable for synthetic chart types.
Debug/diagnostics: Ranking table, optional tested-range label; internal counters for consecutive trends.
Disclaimer
The content provided, including all code and materials, is strictly for educational and informational purposes only. It is not intended as, and should not be interpreted as, financial advice, a recommendation to buy or sell any financial instrument, or an offer of any financial product or service. All strategies, tools, and examples discussed are provided for illustrative purposes to demonstrate coding techniques and the functionality of Pine Script within a trading context.
Any results from strategies or tools provided are hypothetical, and past performance is not indicative of future results. Trading and investing involve high risk, including the potential loss of principal, and may not be suitable for all individuals. Before making any trading decisions, please consult with a qualified financial professional to understand the risks involved.
By using this script, you acknowledge and agree that any trading decisions are made solely at your discretion and risk.
Do not use this indicator on Heikin-Ashi, Renko, Kagi, Point-and-Figure, or Range charts, as these chart types can produce unrealistic results for signal markers and alerts.
Best regards and happy trading
Chervolino

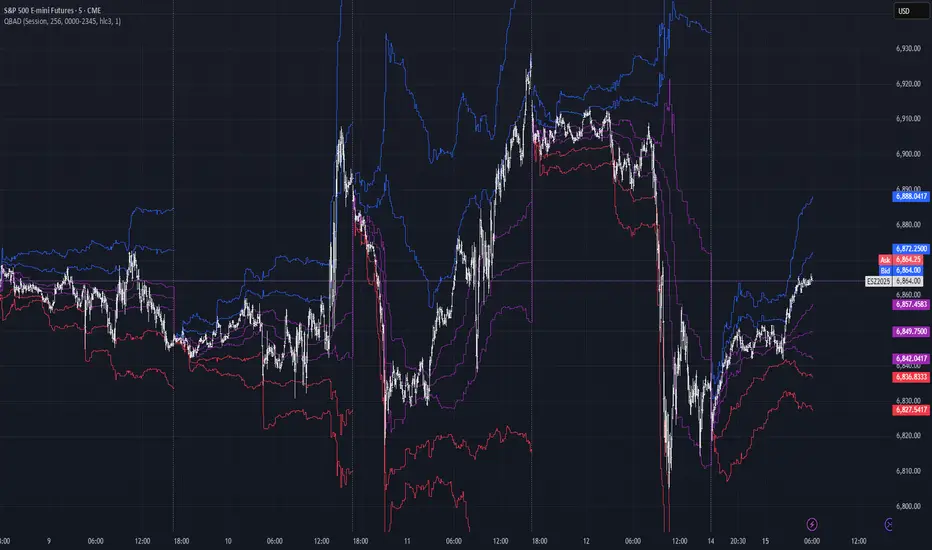
Quantile-Based Adaptive Detection🙏🏻 Dedicated to John Tukey. He invented the boxplot, and I finalized it.
QBAD (Quantile-Based Adaptive Detection) is ‘the’ adaptive (also optionally weighted = ready for timeseries) boxplot with more senseful fences. Instead of hardcoded multipliers for outer fences, I base em on a set of quantile-based asymmetry metrics (you can view it as an ‘algorithmic’ counter part of central & standardized moments). So outer bands are Not hardcoded, not optimized, not cross-validated etc, simply calculated at O(nlogn).
You can use it literally everywhere in any context with any continuous data, in any task that requires statistical control, novelty || outlier detection, without worrying and doubting the sense in arbitrary chosen thresholds. Obviously, given the robust nature of quantiles, it would fit best the cases where data has problems.
The thresholds are:
Basis: the model of the data (median in our case);
Deviations: represent typical spread around basis, together form “value” in general sense;
Extensions: estimate data’s extremums via combination of quantile-based asymmetry metrics without relying on actual blunt min and max, together form “range” / ”frame”. Datapoints outside the frame/range are novelties or outliers;
Limits: based also on quantile asymmetry metrics, estimate the bounds within which values can ‘ever’ emerge given the current data generating process stays the same, together form “field”. Datapoints outside the field are very rare, happen when a significant change/structural break happens in current data-generating process, or when a corrupt datapoint emerges.
…
The first part of the post is for locals xd, the second is for the wanderers/wizards/creators/:
First part:
In terms of markets, mostly u gotta worry about dem instruments that represent crypto & FX assets: it’s either activity hence data sources there are decentralized, or data is fishy.
For a higher algocomplexity cost O(nlong), unlike MBAD that is 0(n), this thing (a control system in fact) works better with ishy data (contaminated with wrong values, incomplete, missing values etc). Read about the “ breakdown point of an estimator ” if you wanna understand it.
Even with good data, in cases when you have multiple instruments that represent the same asset, e.g. CL and BRN futures, and for some reason you wanna skip constructing a proper index of em (while you should), QBAD should be better put on each instrument individually.
Another reason to use this algo-based rather than math-based tool, might be in cases when data quality is all good, but the actual causal processes that generate the data are a bit inconsistent and/or possess ‘increased’ activity in a way. SO in high volatility periods, this tool should provide better.
In terms of built-ins you got 2 weightings: by sequence and by inferred volume delta. The former should be ‘On’ all the time when you work with timeseries, unless for a reason you want to consciously turn it off for a reason. The latter, you gotta keep it ‘On’ unless you apply the tool on another dataset that ain’t got that particular additional dimension.
Ain’t matter the way you gonna use it, moving windows, cumulative windows with or without anchors, that’s your freedom of will, but some stuff stays the same:
Basis and deviations are “value” levels. From process control perspective, if you pls, it makes sense to Not only fade or push based on these levels, but to also do nothing when things are ambiguous and/or don’t require your intervention
Extensions and limits are extreme levels. Here you either push or fade, doing nothing is not an option, these are decisive points in all the meanings
Another important thing, lately I started to see one kind of trend here on tradingview as well and in general in near quant sources, of applying averages, percentiles etc ‘on’ other stationary metrics, so called “indicators”. And I mean not for diagnostic or development reasons, for decision making xd
This is not the evil crime ofc, but hillbilly af, cuz the metrics are stationary it means that you can model em, fit a distribution, like do smth sharper. Worst case you have Bayesian statistics armed with high density intervals and equal tail intervals, and even some others. All this stuff is not hard to do, if u aint’t doing it, it’s on you.
So what I’m saying is it makes sense to apply QBAD on returns ‘of your strategy’, on volume delta, but Not on other metrics that already do calculations over their own moving windows.
...
Second part:
Looks like some finna start to have lil suspicions, that ‘maybe’ after all math entities in reality are more like blueprints, while actual representations are physical/mechanical/algorithmic. Std & centralized moments is a math entity that represents location, scale & asymmetry info, and we can use it no problem, when things are legit and consistent especially. Real world stuff tho sometimes deviates from that ideal, so we need smth more handy and real. Add to the mix the algo counter part of means: quantiles.
Unlike the legacy quantile-based asymmetry metrics from the previous century (check quantile skewness & kurtosis), I don’t use arbitrary sets of quantiles, instead we get a binary pattern that is totally geometric & natural (check the code if interested, I made it very damn explicit). In spirit with math based central & standardized moments, each consequent pair is wider empathizing tail info more and more for each higher order metric.
Unlike the classic box plot, where inner thresholds are quartiles and the rest are based on em, here the basis is median (minimises L1), I base inner thresholds on it, and we continue the pattern by basing the further set of levels on the previous set. So unlike the classic box plot, here we have coherency in construction, symmetry.
Another thing to pay attention to, tho for some reason ain’t many talk about it, it’s not conceptually right to think that “you got data and you apply std moments on it”. No, you apply it to ‘centered around smth’ data. That ‘smth’ should minimize L2 error in case of math, L1 error in case of algo, and L0 error in case of learning/MLish/optimizational/whatever-you-cal-it stuff. So in the case of L0, that’s actually the ‘mode’ of KDE, but that’s for another time. Anyways, in case of L2 it’s mean, so we center data around mean, and apply std moments on residuals. That’s the precise way of framing it. If you understand this, suddenly very interesting details like 0th and 1st central moments start to make sense. In case of quantiles, we center data around the median, and do further processing on residuals, same.
Oth moment (I call it init) is always 1, tho it’s interesting to extrapolate backwards the sequence for higher order moments construction, to understand how we actually end up with this zero.
1st moment (I call it bias) of residuals would be zero if you match centering and residuals analysis methods. But for some reason you didn’t do that (e.g centered data around midhinge or mean and applied QBAD on the centered data), you have to account for that bias.
Realizing stuff > understanding stuff
Learning 2981234 human invented fields < realizing the same unified principles how the Universe works
∞
Hedge Pressure Index (HPI)Hedge Pressure Index (HPI)
Overview
The Hedge Pressure Index (HPI) is a flow-aware indicator that fuses daily options Open Interest (OI) with intraday put/call volume to estimate the directional hedging pressure of market makers and dealers. It helps traders visualize whether options flow is creating mechanical buy/sell pressure in IWM, and when that pressure may be shifting.
What HPI Shows
Daily OI Baseline (white line): Net OI carried forward intraday (Put OI − λ × Call OI). Updated once daily before the open.
Intraday Flow (teal line): Net put minus λ × call volume in real time. Smoothed to show underlying flow.
Spread Histogram (gray): Divergence between intraday flow and daily OI.
HPI Proxy Histogram (blue): Intraday hedge-pressure intensity. Strong extremes indicate heavy one-sided dealer hedging.
Trading Signals
Crossover:
When intraday Volume line crosses above OI, it suggests bullish hedge pressure.
When Volume line crosses below OI, it suggests bearish hedge pressure.
Z-Score Extremes:
HPI ≥ +1.5 → strong mechanical bid.
HPI ≤ −1.5 → strong mechanical offer.
Alerts: Built in for both crossovers and extreme readings.
How to Use HPI
1. Confirmation Tool (recommended for most traders):
Trade your usual price/technical setups.
Use HPI as a confirmation: only take trades that align with the hedge pressure direction.
2. Flow Bias (advanced):
Use HPI direction intraday as a standalone bias.
Fade signals when the histogram mean-reverts or crosses zero.
Best practice: Focus on the open and first 2 hours where hedging flows are most active. Combine with ATR/time-based stops.
Inputs
Demo Mode: If no OI/volume feed is set, the script uses chart volume for layout.
λ (Call Weight): Adjusts how much call volume offsets put volume (default = 1.0).
Smoothing Length: Smooths intraday flow line.
Z-Score Lookback: Sets lookback window for HPI extremes.
Custom Symbols:
Daily Net OI (pre-open OI difference).
Intraday Put Volume.
Intraday Call Volume.
Setup Instructions
Add the indicator to an IWM chart.
In Inputs, either keep Demo Mode ON (for layout) or enter your vendor’s Daily Net OI / Put Volume / Call Volume symbols.
Set alerts for crossovers and strong HPI readings to catch flow shifts in real time.
Optionally tune λ and smoothing to match your feed’s scale.
Notes
This is a proxy for dealer hedge pressure. For highest accuracy, replace the proxy histogram with gamma-weighted flow by strike/DTE when your data feed supports it.
Demo mode is for visualization only; live use requires a valid OI and volume feed.
Disclaimer
This script is for educational and research purposes only. It is not financial advice. Options and derivatives carry significant risk. Always test in a demo environment before using live capital.

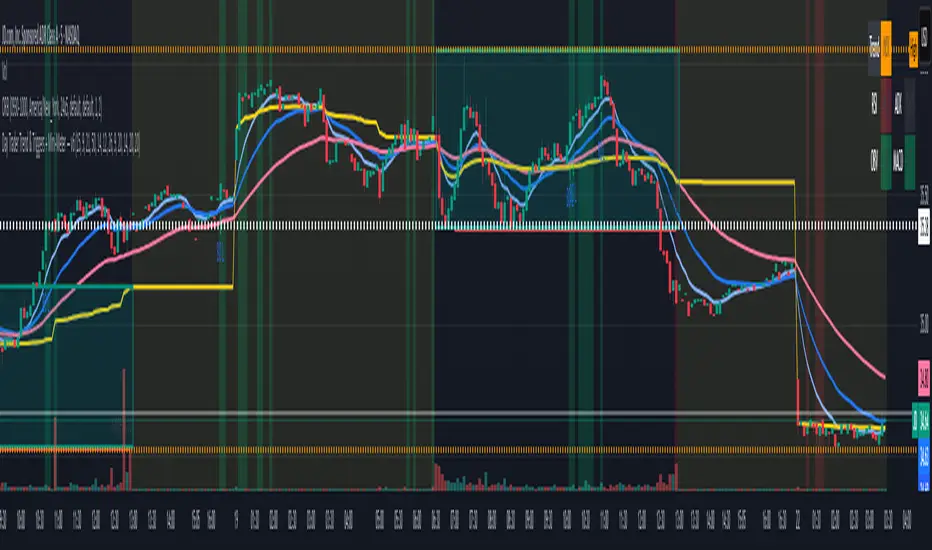
Day Trader Trend & Triggers + Mini-Meter — v6**Day Trader Trend & Triggers — Intraday**
A fast, intraday trend and entry tool designed for **1m–15m charts**. It identifies **strong up/down trends** using:
* **MA ribbon:** EMA9 > EMA21 > EMA50 (or inverse) for directional bias.
* **Momentum:** RSI(50-line) and MACD histogram flips.
* **Volume & VWAP:** only confirms when volume expands above SMA(20) and price is above/below VWAP.
* **Higher-TF bias filter (optional):** e.g., align 1m/5m signals with the 15m trend.
When all align, the background highlights and the mini-meter shows UP/DOWN.
It also plots **entries**:
* **Pullbacks** to EMA21/EMA50 with a MACD re-cross,
* **Breakouts** of recent highs/lows on strong volume.
Built-in **alerts** for trend flips, pullbacks, and breakouts let you trade hands-off.
Best used on **5m for active day trades**, with 1m/3m for scalping and 15m for cleaner intraday swings.
Day Trader Trend & Triggers — v6**Day Trader Trend & Triggers — Intraday**
A fast, intraday trend and entry tool designed for **1m–15m charts**. It identifies **strong up/down trends** using:
* **MA ribbon:** EMA9 > EMA21 > EMA50 (or inverse) for directional bias.
* **Momentum:** RSI(50-line) and MACD histogram flips.
* **Volume & VWAP:** only confirms when volume expands above SMA(20) and price is above/below VWAP.
* **Higher-TF bias filter (optional):** e.g., align 1m/5m signals with the 15m trend.
When all align, the background highlights and the mini-meter shows UP/DOWN.
It also plots **entries**:
* **Pullbacks** to EMA21/EMA50 with a MACD re-cross,
* **Breakouts** of recent highs/lows on strong volume.
Built-in **alerts** for trend flips, pullbacks, and breakouts let you trade hands-off.
Best used on **5m for active day trades**, with 1m/3m for scalping and 15m for cleaner intraday swings.

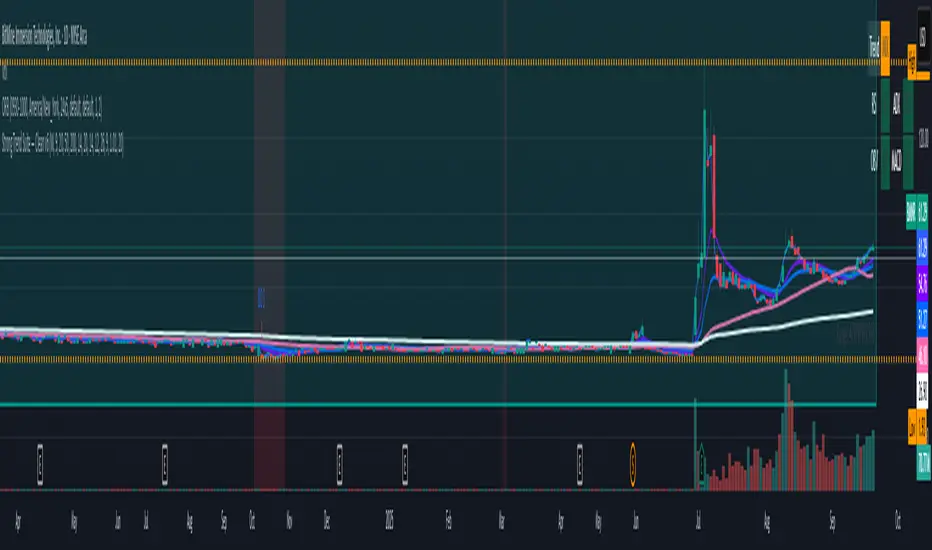
Strong Trend Suite — Clean v6A clean, rules-based trend tool for swing traders. It identifies strong up/down trends by syncing five pillars:
Trend structure: price above/below a MA stack (EMA20 > SMA50 > EMA200 for up; inverse for down).
Momentum: RSI (50 line) and MACD (line > signal and side of zero).
Trend strength: ADX above a threshold and rising.
Volume confirmation: OBV vs its short MA (accumulation/distribution).
Optional higher-TF bias: weekly filter to avoid fighting bigger flows.
When all align, the background tints and the mini-meter flips green/red (UP/DOWN).
It also marks entry cues: pullbacks to EMA20/SMA50 with a MACD re-cross, or breakouts of recent highs/lows on volume.
Built-in alerts for strong trend, pullback, and breakout keep you hands-off; use “Once per bar close” on the Daily chart for best signal quality.
EvoTrend-X Indicator — Evolutionary Trend Learner ExperimentalEvoTrend-X Indicator — Evolutionary Trend Learner
NOTE: This is an experimental Pine Script v6 port of a Python prototype. Pine wasn’t the original research language, so there may be small quirks—your feedback and bug reports are very welcome. The model is non-repainting, MTF-safe (lookahead_off + gaps_on), and features an adaptive (fitness-based) candidate selector, confidence gating, and a volatility filter.
⸻
What it is
EvoTrend-X is adaptive trend indicator that learns which moving-average length best fits the current market. It maintains a small “population” of fast EMA candidates, rewards those that align with price momentum, and continuously selects the best performer. Signals are gated by a multi-factor Confidence score (fitness, strength vs. ATR, MTF agreement) and a volatility filter (ATR%). You get a clean Fast/Slow pair (for the currently best candidate), optional HTF filter, a fitness ribbon for transparency, and a themed info panel with a one-glance STATUS readout.
Core outputs
• Selected Fast/Slow EMAs (auto-chosen from candidates via fitness learning)
• Spread cross (Fast – Slow) → visual BUY/SELL markers + alert hooks
• Confidence % (0–100): Fitness ⊕ Distance vs. ATR ⊕ MTF agreement
• Gates: Trend regime (Kaufman ER), Volatility (ATR%), MTF filter (optional)
• Candidate Fitness Ribbon: shows which lengths the learner currently prefers
• Export plot: hidden series “EvoTrend-X Export (spread)” for downstream use
⸻
Why it’s different
• Evolutionary learning (on-chart): Each candidate EMA length gets rewarded if its slope matches price change and penalized otherwise, with a gentle decay so the model forgets stale regimes. The best fitness wins the right to define the displayed Fast/Slow pair.
• Confidence gate: Signals don’t light up unless multiple conditions concur: learned fitness, spread strength vs. volatility, and (optionally) higher-timeframe trend.
• Volatility awareness: ATR% filter blocks low-energy environments that cause death-by-a-thousand-whipsaws. Your “why no signal?” answer is always visible in the STATUS.
• Preset discipline, Custom freedom: Presets set reasonable baselines for FX, equities, and crypto; Custom exposes all knobs and honors your inputs one-to-one.
• Non-repainting rigor: All MTF calls use lookahead_off + gaps_on. Decisions use confirmed bars. No forward refs. No conditional ta.* pitfalls.
⸻
Presets (and what they do)
• FX 1H (Conservative): Medium candidates, slightly higher MinConf, modest ATR% floor. Good for macro sessions and cleaner swings.
• FX 15m (Active): Shorter candidates, looser MinConf, higher ATR% floor. Designed for intraday velocity and decisive sessions.
• Equities 1D: Longer candidates, gentler volatility floor. Suits index/large-cap trend waves.
• Crypto 1H: Mid-short candidates, higher ATR% floor for 24/7 chop, stronger MinConf to avoid noise.
• Custom: Your inputs are used directly (no override). Ideal for systematic tuning or bespoke assets.
⸻
How the learning works (at a glance)
1. Candidates: A small set of fast EMA lengths (e.g., 8/12/16/20/26/34). Slow = Fast × multiplier (default ×2.0).
2. Reward/decay: If price change and the candidate’s Fast slope agree (both up or both down), its fitness increases; otherwise decreases. A decay constant slowly forgets the distant past.
3. Selection: The candidate with highest fitness defines the displayed Fast/Slow pair.
4. Signal engine: Crosses of the spread (Fast − Slow) across zero mark potential regime shifts. A Confidence score and gates decide whether to surface them.
⸻
Controls & what they mean
Learning / Regime
• Slow length = Fast ×: scales the Slow EMA relative to each Fast candidate. Larger multiplier = smoother regime detection, fewer whipsaws.
• ER length / threshold: Kaufman Efficiency Ratio; above threshold = “Trending” background.
• Learning step, Decay: Larger step reacts faster to new behavior; decay sets how quickly the past is forgotten.
Confidence / Volatility gate
• Min Confidence (%): Minimum score to show signals (and fire alerts). Raising it filters noise; lowering it increases frequency.
• ATR length: The ATR window for both the ATR% filter and strength normalization. Shorter = faster, but choppier.
• Min ATR% (percent): ATR as a percentage of price. If ATR% < Min ATR% → status shows BLOCK: low vola.
MTF Trend Filter
• Use HTF filter / Timeframe / Fast & Slow: HTF Fast>Slow for longs, Fast threshold; exit when spread flips or Confidence decays below your comfort zone.
2) FX index/majors, 15m (active intraday)
• Preset: FX 15m (Active).
• Gate: MinConf 60–70; Min ATR% 0.15–0.30.
• Flow: Focus on session opens (LDN/NY). The ribbon should heat up on shorter candidates before valid crosses appear—good early warning.
3) SPY / Index futures, 1D (positioning)
• Preset: Equities 1D.
• Gate: MinConf 55–65; Min ATR% 0.05–0.12.
• Flow: Use spread crosses as regime flags; add timing from price structure. For adds, wait for ER to remain trending across several bars.
4) BTCUSD, 1H (24/7)
• Preset: Crypto 1H.
• Gate: MinConf 70–80; Min ATR% 0.20–0.35.
• Flow: Crypto chops—volatility filter is your friend. When ribbon and HTF OK agree, favor continuation entries; otherwise stand down.
⸻
Reading the Info Panel (and fixing “no signals”)
The panel is your self-diagnostic:
• HTF OK? False means the higher-timeframe EMAs disagree with your intended side.
• Regime: If “Chop”, ER < threshold. Consider raising the threshold or waiting.
• Confidence: Heat-colored; if below MinConf, the gate blocks signals.
• ATR% vs. Min ATR%: If ATR% < Min ATR%, status shows BLOCK: low vola.
• STATUS (composite):
• BLOCK: low vola → increase Min ATR% down (i.e., allow lower vol) or wait for expansion.
• BLOCK: HTF filter → disable HTF or align with the HTF tide.
• BLOCK: confidence → lower MinConf slightly or wait for stronger alignment.
• OK → you’ll see markers on valid crosses.
⸻
Alerts
Two static alert hooks:
• BUY cross — spread crosses up and all gates (ER, Vol, MTF, Confidence) are open.
• SELL cross — mirror of the above.
Create them once from “Add Alert” → choose the condition by name.
⸻
Exporting to other scripts
In your other Pine indicators/strategies, add an input.source and select EvoTrend-X → “EvoTrend-X Export (spread)”. Common uses:
• Build a rule: only trade when exported spread > 0 (trend filter).
• Combine with your oscillator: oscillator oversold and spread > 0 → buy bias.
⸻
Best practices
• Let it learn: Keep Learning step moderate (0.4–0.6) and Decay close to 1.0 (e.g., 0.99–0.997) for smooth regime memory.
• Respect volatility: Tune Min ATR% by asset and timeframe. FX 1H ≈ 0.10–0.20; crypto 1H ≈ 0.20–0.35; equities 1D ≈ 0.05–0.12.
• MTF discipline: HTF filter removes lots of “almost” trades. If you prefer aggressive entries, turn it off and rely more on Confidence.
• Confidence as throttle:
• 40–60%: exploratory; expect more signals.
• 60–75%: balanced; good daily driver.
• 75–90%: selective; catch the clean stuff.
• 90–100%: only A-setups; patient mode.
• Watch the ribbon: When shorter candidates heat up before a cross, momentum is forming. If long candidates dominate, you’re in a slower trend cycle.
⸻
Non-repainting & safety notes
• All request.security() calls use lookahead=barmerge.lookahead_off, gaps=barmerge.gaps_on.
• No forward references; decisions rely on confirmed bar data.
• EMA lengths are simple ints (no series-length errors).
• Confidence components are computed every bar (no conditional ta.* traps).
⸻
Limitations & tips
• Chop happens: ER helps, but sideways microstructure can still flicker—use Confidence + Vol filter as brakes.
• Presets ≠ oracle: They’re sensible baselines; always tune MinConf and Min ATR% to your venue and session.
• Theme “Auto”: Pine cannot read chart theme; “Auto” defaults to a Dark-friendly palette.
⸻
Publisher’s Screenshots Checklist
1) FX swing — EURUSD 1H
• Preset: FX 1H (Conservative)
• Params: MinConf=70, ATR Len=14, Min ATR%=0.12, MTF ON (TF=4H, 20/50)
• Show: Clear BUY cross, STATUS=OK, green regime background; Fitness Ribbon visible.
2) FX intraday — GBPUSD 15m
• Preset: FX 15m (Active)
• Params: MinConf=60, ATR Len=14, Min ATR%=0.20, MTF ON (TF=60m)
• Show: SELL cross near London session open. HTF lines enabled (translucent).
• Caption: “GBPUSD 15m • Active session sell with MTF alignment.”
3) Indices — SPY 1D
• Preset: Equities 1D
• Params: MinConf=60, ATR Len=14, Min ATR%=0.08, MTF ON (TF=1W, 20/50)
• Show: Longer trend run after BUY cross; regime shading shows persistence.
• Caption: “SPY 1D • Trend run after BUY cross; weekly filter aligned.”
4) Crypto — BINANCE:BTCUSDT 1H
• Preset: Crypto 1H
• Params: MinConf=75, ATR Len=14, Min ATR%=0.25, MTF ON (TF=4H)
• Show: BUY cross + quick follow-through; Ribbon warming (reds/yellows → greens).
• Caption: “BTCUSDT 1H • Momentum break with high confidence and ribbon turning.”

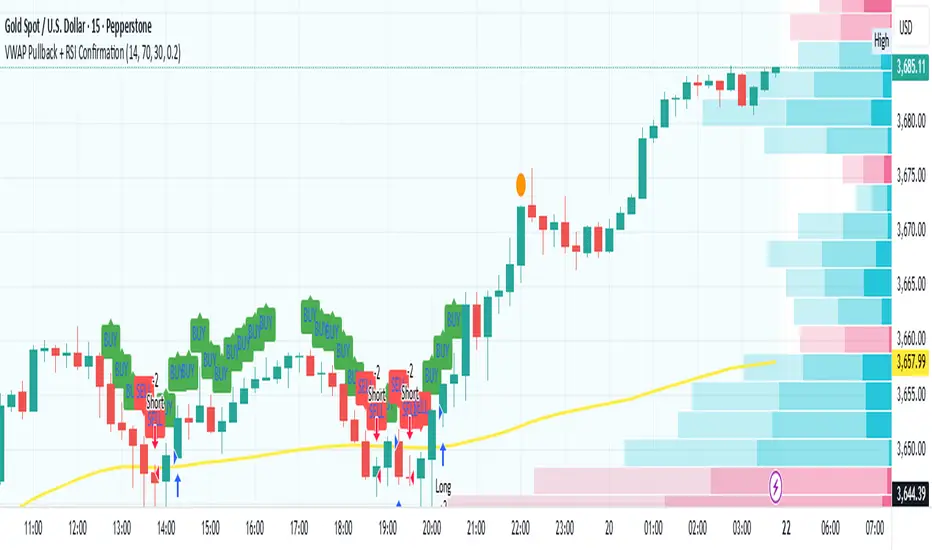
VWAP Pullback + RSI ConfirmationThis strategy focuses on trend continuation entries. Instead of betting on reversions, it looks for opportunities when price pulls back to VWAP but the dominant trend remains intact.
Trend Bias:
Price above VWAP = bullish environment → look for BUY pullbacks.
Price below VWAP = bearish environment → look for SELL pullbacks.
Entry Logic:
BUY: Price pulls back near VWAP, RSI stays above oversold (momentum intact).
SELL: Price pulls back near VWAP, RSI stays below overbought (momentum intact).
Exit Rule:
Stop-loss just below/above VWAP.
Take-profit at 1.5–2x risk (default script uses ~2%).
Best Timeframes:
15m–1H → good for intraday trend-following setups.
Daily → captures stronger, longer trends.
⚡ This strategy is powerful in trending markets because VWAP acts as a "magnet" for pullbacks, while RSI prevents overbought/oversold traps.
Wickless Heikin Ashi B/S [CHE]Wickless Heikin Ashi B/S \
Purpose.
Wickless Heikin Ashi B/S \ is built to surface only the cleanest momentum turns: it prints a Buy (B) when a bullish Heikin-Ashi candle forms with virtually no lower wick, and a Sell (S) when a bearish Heikin-Ashi candle forms with no upper wick. Optional Lock mode turns these into one-shot signals that hold the regime (bull or bear) until the opposite side appears. The tool can also project dashed horizontal lines from each signal’s price level to help you manage entries, stops, and partial take-profits visually.
How it works.
The indicator computes standard Heikin-Ashi values from your chart’s OHLC. A bar qualifies as bullish if its HA close is at or above its HA open; bearish if below. Then the wick on the relevant side is compared to the bar’s HA range. If that wick is smaller than your selected percentage threshold (plus a tiny tick epsilon to avoid rounding noise), the raw condition is considered “wickless.” Only one side can fire; on the rare occasion both raw conditions would overlap, the bar is ignored to prevent false dual triggers. When Lock is enabled, the first valid signal sets the active regime (background shaded light green for bull, light red for bear) and suppresses further same-side triggers until the opposite side appears, which helps reduce overtrading in chop.
Why wickless?
A missing wick on the “wrong” side of a Heikin-Ashi candle is a strong hint of persistent directional pressure. In practice, this filters out hesitation bars and many mid-bar flips. Traders who prefer entering only when momentum is decisive will find wickless bars useful for timing entries within an established bias.
Visuals you get.
When a valid buy appears, a small triangle “B” is plotted below the bar and a green dashed line can extend to the right from the signal’s HA open price. For sells, a triangle “S” above the bar and a red dashed line do the same. These lines act like immediate, price-anchored references for stop placement and profit scaling; you can shift the anchor left by a chosen number of bars if you prefer the line to start a little earlier for visual alignment.
How to trade it
Establish context first.
Pick a timeframe that matches your style: intraday index or crypto traders often use 5–60 minutes; swing traders might prefer 2–4 hours or daily. The tool is agnostic, but the cleanest results occur when the market is already trending or attempting a fresh breakout.
Entry.
When a B prints, the simplest rule is to enter long at or just after bar close. A conservative variation is to require price to take out the high of the signal bar in the next bar(s). For S, invert the logic: enter short on or after close, or only if price breaks the signal bar’s low.
Stop-loss.
Place the stop beyond the opposite extreme of the signal HA bar (for B: under the HA low; for S: above the HA high). If you prefer a static reference, use the dashed line level (signal HA open) or an ATR buffer (e.g., 1.0–1.5× ATR(14)). The goal is to give the trade enough room that normal noise does not immediately knock you out, while staying small enough to keep the risk contained.
Take-profit and management.
Two pragmatic approaches work well:
R-multiple scaling. Define your initial risk (distance from entry to stop). Scale out at 1R, 2R, and let a runner go toward 3R+ if structure holds.
Trailing logic. Trail behind a short moving average (e.g., EMA 20) or progressive swing points. Many traders also exit on the opposite signal when Lock flips, especially on faster timeframes.
Position sizing.
Keep risk per trade modest and consistent (e.g., 0.25–1% of account). The indicator improves timing; it does not replace risk control.
Settings guidance
Max lower wick for Bull (%) / Max upper wick for Bear (%).
These control how strict “wickless” must be. Tighter values (0.3–1.0%) yield fewer but cleaner signals and are great for strong trends or low-noise instruments. Looser values (1.5–3.0%) catch more setups in volatile markets but admit more noise. If you notice too many borderline bars triggering during high-volatility sessions, increase these thresholds slightly.
Lock (one-shot until opposite).
Keep Lock ON when you want one decisive signal per leg, reducing noise and signal clusters. Turn it OFF only if your plan intentionally scales into trends with multiple entries.
Extended lines & anchor offset.
Leave lines ON to maintain a visual memory of the last trigger levels. These often behave like near-term support/resistance. The offset simply lets you start that line one or more bars earlier if you prefer the look; it does not change the math.
Colors.
Use distinct bull/bear line colors you can read easily on your theme. The default lime/red scheme is chosen for clarity.
Practical examples
Momentum continuation (long).
Price is above your baseline (e.g., EMA 200). A B prints with a tight lower wick filter. Enter on close; stop under the signal HA low. Price pushes up in the next bars; you scale at 1R, trail the rest with EMA 20, and finally exit when a distant S appears or your trail is hit.
Breakout confirmation (short).
Following a range, price breaks down and prints an S with no upper wick. Enter short as the bar closes or on a subsequent break of the signal bar’s low. If the next bar immediately rejects and prints a bullish HA bar, your stop above the signal HA high limits damage. Otherwise, ride the move, harvesting partials as the red dashed line remains unviolated.
Alerts and automation
Set alerts to “Once Per Bar Close” for stability.
Bull ONE-SHOT fires when a valid buy prints (and Lock allows it).
Bear ONE-SHOT fires for sells analogously.
With Lock enabled, you avoid multiple pings in the same direction during a single leg—useful for webhooks or mobile notifications.
Reliability and limitations
The script calculates from completed bars and does not use higher-timeframe look-ahead or repainting tricks. Heikin-Ashi smoothing can lag turns slightly, which is expected and part of the design. In narrow ranges or whipsaw conditions, signals naturally thin out; if you must trade ranges, either tighten the wick filters and keep Lock ON, or add a trend/volatility filter (e.g., trade B only above EMA 200; S only below). Remember: this is an indicator, not a strategy. If you want exact statistics, port the triggers into a strategy and backtest with your chosen entry, stop, and exit rules.
Final notes
Wickless Heikin Ashi B/S \ is a precision timing tool: it waits for decisive, wickless HA bars, provides optional regime locking to reduce noise, and leaves clear price anchors on your chart for disciplined management. Use it with a simple framework—trend bias, fixed risk, and a straightforward exit plan—and it will keep your execution consistent without cluttering the screen or your decision-making.
Disclaimer: This indicator is for educational use and trade assistance only. It is not financial advice. You alone are responsible for your risk and results.
Enhance your trading precision and confidence with Wickless Heikin Ashi B/S ! 🚀
Happy trading
Chervolino

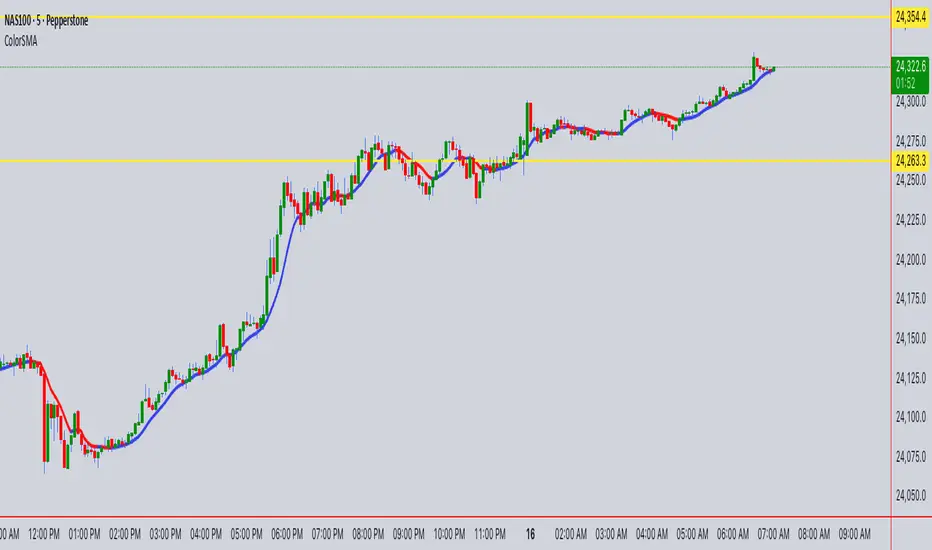
ColorSMAColorSMA Indicator – Description & Usage Guide
Overview
The ColorSMA indicator is a dynamic trend-following moving average designed to adapt to volatility and provide clearer visual cues for traders. Unlike a standard simple moving average (SMA), this tool applies a volatility filter using a standard deviation channel and then smooths the price before calculating the moving average.
The result is a single line on the chart that changes color depending on its trend direction:
Blue (Uptrend) – The moving average is rising compared to the previous bar.
Red (Downtrend) – The moving average is falling compared to the previous bar.
This visual coloring makes it easier to spot the trend direction at a glance.
How It Works
Baseline SMA
The script first calculates a classic SMA based on the selected Length (default = 9).
This baseline acts as the foundation of the indicator.
Volatility Filter (SD Channel)
A standard deviation multiplier is applied to create an upper and lower channel around the SMA.
If price moves outside this channel, it gets “clamped” back within the channel range.
This reduces noise and prevents false signals in highly volatile conditions.
Smoothed Price (Extra Smooth)
The filtered price is then smoothed with another SMA (default = 3).
This step makes the line cleaner and easier to interpret.
Trend Coloring
If the current smoothed SMA is higher than its previous value → the line is Blue.
If it is lower → the line is Red .
This simple but effective color-coding highlights trend shifts without cluttering the chart.
Inputs & Settings
Source: The price source used in the calculation (default = close).
Length: The SMA period length (default = 9).
Extra Smooth : Additional smoothing for the final line (default = 3). Lower values make it more responsive, higher values make it smoother.
Width (Volatility Filter – SD Channel): The multiplier applied to the standard deviation. Controls how wide the channel is (default = 0.3).
Length (Volatility Filter – SD Channel): The period for calculating standard deviation (default = 1).
What You See on the Chart
A single moving average line that changes color:
Blue (Up) = trend strength or bullish direction.
Red (Down) = trend weakness or bearish direction.
The line itself is already filtered through a volatility channel and smoothing, so it reacts to market conditions while reducing noise.
How to Use It
Trend Identification
Use the color changes (Blue/Red) to quickly identify short-term trend shifts.
Blue phases suggest bullish bias, Red phases suggest bearish bias.
Entry/Exit Guidance
Traders can align entries with the trend color (e.g., buy when it turns Blue, sell/short when it turns Red).
Combine with price action or other indicators for confirmation.
Volatility Filtering
Adjust the Width and SD Length parameters to tune how sensitive the indicator is to price fluctuations. Narrower channels give more signals; wider channels filter out more noise.
Smoothing Control
If you prefer faster reactions, lower the smoothing value.
If you want steadier signals, increase smoothing.
Summary
The ColorSMA is a visually enhanced moving average that adapts to volatility and simplifies trend detection. It is especially useful for traders who prefer:
Clean charts with minimal clutter.
Clear, color-coded signals for trend direction.
Flexibility to adjust responsiveness via smoothing and channel width.
This indicator is best used as a trend confirmation tool or combined with other strategies such as support/resistance, candlestick patterns, or oscillators for robust trade setups.
Iani SMC Sniper XAU v2.2 (Long+Short + News Countdown, v6)Iani SMC Sniper v2.6 — Anytime • Auto Pip • FVG 50% • OB • News Panel
Smart-Money Concepts made simple for intraday XAU/USD (works on any symbol).
Finds BOS, 50% FVG “sniper” entries, optional Order Blocks, London H/L, news countdown, and a mini info panel.
What it does
BOS (Break of Structure): detects bullish/bearish BOS after London sweep logic.
FVG 50% entries: plots precise long/short entry dots at the midpoint of the gap.
Auto TP/SL: TP = RR × risk, SL below/above recent swing with a small buffer.
Order Blocks (optional): marks the last opposite candle after BOS and alerts on OB revisit.
London High/Low: tracks session range; session filter is optional.
News countdown: shows next event time and minutes left (user-selectable timezone).
Mini Panel: top-left table with Trend (last BOS), Next news, R:R, Pip size.
Inputs (key)
Auto pip size: uses syminfo.mintick. Manual override available.
Risk:Reward (RR): default 2.0.
Pivot length: swing sensitivity.
Sessions: enable if you want signals only 12:00–20:00 (symbol timezone). Off = anytime.
News timezone: pick your own (e.g., Europe/Brussels, America/New_York).
Absolute & daily times: add your events (strings like 2025-09-17 20:00 or 14:30,16:00…).
Show labels/levels/OBs: toggle on/off.
Alerts included
BOS Bullish / BOS Bearish
BUY Entry / SELL Entry (return to 50% FVG)
Bullish OB revisit / Bearish OB revisit
TP Long/Short reached, SL Long/Short hit
NEWS WARNING (warning window only; does not block signals)
To use: Add Alert → Condition: this indicator → choose any of the alertconditions.
Best use
Bias: H1 for structure.
Execution: M15 (standard) or M5 (aggressive).
Works great on XAUUSD, but is symbol-agnostic (auto pip adapts).
Notes
News times display in the timezone you pick in settings.
OBs are a simple implementation meant for quick visual guidance.
Labels: BUY/SELL near entries, TP/SL on set and when hit, BOS up/down.
Risk disclaimer
This tool is for education only. Not financial advice. Backtest and manage risk.

NDOG & NWOG - Liquidity + Sunday Box rroielDescription:
This script combines NDOG & NWOG liquidity levels with a Sunday Box framework to provide traders with structured levels for weekly bias, liquidity mapping, and potential entry/exit zones.
Features:
• Automatic plotting of NDOG & NWOG liquidity zones.
• Sunday Box (weekly open range) drawn to define structure and bias.
• Highlights liquidity sweeps and retests for trade confirmation.
• Configurable settings for box time, liquidity range, and display options.
• Built to support ROI/EL strategies by aligning liquidity with weekly key levels.
Use Case:
Helps traders identify where price is likely to react by combining liquidity-based zones with the Sunday box framework. Designed for clarity, confluence, and efficiency in execution.

Deadband Hysteresis Supertrend [BackQuant]Deadband Hysteresis Supertrend
A two-stage trend tool that first filters price with a deadband baseline, then runs a Supertrend around that baseline with optional flip hysteresis and ATR-based adverse exits.
What this is
A hybrid of two ideas:
Deadband Hysteresis Baseline that only advances when price pulls far enough from the baseline to matter. This suppresses micro noise and gives you a stable centerline.
Supertrend bands wrapped around that baseline instead of raw price. Flips are further gated by an extra margin so side changes are more deliberate.
The goal is fewer whipsaws in chop and clearer regime identification during trends.
How it works (high level)
Deadband step — compute a per-bar “deadband” size from one of four modes: ATR, Percent of price, Ticks, or Points. If price deviates from the baseline by more than this amount, move the baseline forward by a fraction of the excess. If not, hold the line.
Centered Supertrend — build upper and lower bands around the baseline using ATR and a user factor. Track the usual trailing logic that tightens a band while price moves in its favor.
Flip hysteresis — require price to exceed the active band by an extra flip offset × ATR before switching sides. This adds stickiness at the boundary.
Adverse exit — once a side is taken, trigger an exit if price moves against the entry by K × ATR .
If you would like to check out the filter by itself:
What it plots
DBHF baseline (optional) as a smooth centerline.
DBHF Supertrend as the active trailing band.
Candle coloring by trend side for quick read.
Signal markers 𝕃 and 𝕊 at flips plus ✖ on adverse exits.
Inputs that matter
Price Source — series being filtered. Close is typical. HL2 or HLC3 can be steadier.
Deadband mode — ATR, Percent, Ticks, or Points. This defines the “it’s big enough to matter” zone.
ATR Length / Mult (DBHF) — only used when mode = ATR. Larger values widen the do-nothing zone.
Percent / Ticks / Points — alternatives to ATR; pick what fits your market’s convention.
Enter Mult — scales the deadband you must clear before the baseline moves. Increase to filter more noise.
Response — fraction of the excess applied to baseline movement. Higher responds faster; lower is smoother.
Supertrend ATR Period & Factor — traditional band size controls; higher factor widens and flips less often.
Flip Offset ATR — extra ATR buffer required to flip. Useful in choppy regimes.
Adverse Stop K·ATR — per-trade danger brake that forces an exit if price moves K×ATR against entry.
UI — toggle baseline, supertrend, signals, and bar painting; choose long and short colors.
How to read it
Green regime — candles painted long and the Supertrend running below price. Pullbacks toward the baseline that fail to breach the opposite band often resume higher.
Red regime — candles painted short and the Supertrend running above price. Rallies that cannot reclaim the band may roll over.
Frequent side swaps — reduce sensitivity by increasing Enter Mult, using ATR mode, raising the Supertrend factor, or adding Flip Offset ATR.
Use cases
Bias filter — allow entries only in the direction of the current side. Use your preferred triggers inside that bias.
Trailing logic — treat the active band as a dynamic stop. If the side flips or an adverse K·ATR exit prints, reduce or close exposure.
Regime map — on higher timeframes, the combination baseline + band produces a clean up vs down template for allocation decisions.
Tuning guidance
Fast markets — ATR deadband, modest Enter Mult (0.8–1.2), response 0.2–0.35, Supertrend factor 1.7–2.2, small Flip Offset (0.2–0.5 ATR).
Choppy ranges — widen deadband or raise Enter Mult, lower response, and add more Flip Offset so flips require stronger evidence.
Slow trends — longer ATR periods and higher Supertrend factor to keep you on side longer; use a conservative adverse K.
Included alerts
DBHF ST Long — side flips to long.
DBHF ST Short — side flips to short.
Adverse Exit Long / Short — K·ATR stop triggers against the current side.
Strengths
Deadbanded baseline reduces micro whipsaws before Supertrend logic even begins.
Flip hysteresis adds a second layer of confirmation at the boundary.
Optional adverse ATR stop provides a uniform risk cut across assets and regimes.
Clear visuals and minimal parameters to adjust for symbol behavior.
Putting it together
Think of this tool as two decisions layered into one view. The deadband baseline answers “does this move even count,” then the Supertrend wrapped around that baseline answers “if it counts, which side should I be on and where do I flip.” When both parts agree you tend to stay on the correct side of a trend for longer, and when they disagree you get an early warning that conditions are changing.
When the baseline bends and price cannot reclaim the opposite band , momentum is usually continuing. Pullbacks into the baseline that stall before the far band often resolve in trend.
When the baseline flattens and the bands compress , expect indecision. Use the Flip Offset ATR to avoid reacting to the first feint. Wait for a clean band breach with follow through.
When an adverse K·ATR exit prints while the side has not flipped , treat it as a risk event rather than a full regime change. Many users cut size, re-enter only if the side reasserts, and let the next flip confirm a new trend.
Final thoughts
Deadband Hysteresis Supertrend is best read as a regime lens. The baseline defines your tolerance for noise, the bands define your trailing structure, and the flip offset plus adverse ATR stop define how forgiving or strict you want to be at the boundary. On strong trends it helps you hold through shallow shakeouts. In choppy conditions it encourages patience until price does something meaningful. Start with settings that reflect the cadence of your market, observe how often flips occur, then nudge the deadband and flip offset until the tool spends most of its time describing the move you care about rather than the noise in between.

ICT Sweep + FVG Entry (v6) • Pro Pack 📌 ICT Sweep + FVG Entry Pro Pack
This indicator combines key ICT price action concepts with practical execution tools to help traders spot high-probability setups faster and more objectively. It’s designed for scalpers and intraday traders who want to keep their chart clean but never miss critical market structure events.
🔑 Features
Liquidity Pools (HTF)
• Auto-detects recent swing highs/lows from higher timeframes (5m/15m).
• Draws both lines and optional rectangles/zones for clear liquidity areas.
Liquidity Sweeps (BSL/SSL)
• Identifies when price sweeps above/below liquidity pools and rejects back.
• Optional Grade-A sweep filter (wick size + strong re-entry).
Fair Value Gaps (FVGs)
• Highlights bullish/bearish imbalances.
• Optional midline (50%) entry for precision.
• Auto-invalidation when price fully closes inside the gap.
Killzones (New York)
• Highlights AM (9:30–11:30) and PM (14:00–15:30) killzones.
• Option to block signals outside killzones for higher strike rate.
Bias Badge (DR50)
• Displays if price is trading in a Bull, Bear, or Range context based on displacement range midpoint.
SMT Assist (NQ vs ES)
• Detects simple divergences between indices:
Bearish SMT → NQ makes HH while ES doesn’t.
Bullish SMT → NQ makes LL while ES doesn’t.
SL/TP Helper & R:R Label
• Automatically draws stop loss (at sweep extreme) and target (opposite pool or recent swing).
• Displays expected Risk:Reward ratio and blocks entries if below your chosen minimum.
Filters
• ATR filter ensures signals only appear in sufficient volatility.
• Sweep quality filter avoids weak wicks and fake-outs.
🎯 How to Use
Start on HTF (5m/15m) → Identify liquidity zones and bias.
Drop to LTF (1m) → Wait for a liquidity sweep confirmation.
Check for FVG in the sweep’s direction → Look for retest entry.
Use the SL/TP helper to validate your risk/reward before taking the trade.
Focus entries during NY Killzones for maximum effectiveness.
✅ Why this helps
This tool reduces screen time and hesitation by automating repetitive ICT concepts:
Liquidity pools, sweeps, and FVGs are marked automatically.
Killzone timing and SMT divergence are simplified.
Clear visual signals for entries with built-in RR filter help keep your trading mechanical.
⚠️ Disclaimer: This script is for educational purposes only. It does not provide financial advice or guarantee results. Always use proper risk management.

Money Flow | Lyro RSMoney Flow | Lyro RS
The Money Flow is a momentum and volume-driven oscillator designed to highlight market strength, exhaustion, and potential reversal points. By combining smoothed Money Flow Index readings with volatility, momentum, and RVI-based logic, it offers traders a deeper perspective on money inflow/outflow, divergences, and overbought/oversold dynamics.
Key Features
Smoothed Money Flow Line
EMA-smoothed calculation of the MFI for noise reduction.
Clear thresholds for overbought and oversold zones.
Normalized Histogram
Histogram plots show bullish/bearish money flow pressure.
Color-coded cross logic for quick trend assessment.
Relative Volatility Index (RVI) Signals
Detects overbought and oversold conditions using volatility-adjusted RVI.
Plots ▲ and ▼ markers at exhaustion points.
Momentum Strength Gauge
Calculates normalized momentum strength from ROC and volume activity.
Displays percentage scale of current momentum force.
Divergence Detection
Bullish divergence: Price makes lower lows while money flow makes higher lows.
Bearish divergence: Price makes higher highs while money flow makes lower highs.
Plotted as diamond markers on the oscillator.
Signal Dashboard (Table Overlay)
Displays real-time status of Money Flow signals, volatility, and momentum.
Color-coded readouts for instant clarity (Long/Short/Neutral + Momentum Bias).
How It Works
Money Flow Calculation – Applies EMA smoothing to MFI values.
Normalization – Scales oscillator between relative high/low values.
Trend & Signals – Generates bullish/bearish signals based on midline and histogram cross logic.
RVI Integration – Confirms momentum exhaustion with overbought/oversold markers.
Divergences – Identifies hidden market imbalances between price and money flow.
Practical Use
Trend Confirmation – Use midline crossovers with histogram direction for money flow bias.
Overbought/Oversold Reversals – Watch RVI ▲/▼ markers for exhaustion setups.
Momentum Tracking – Monitor momentum percentage to gauge strength of current trend.
Divergence Alerts – Spot early reversal opportunities when money flow diverges from price action.
Customization
Adjust length, smoothing, and thresholds for different markets.
Enable/disable divergence detection as needed.
Personalize visuals and dashboard display for cleaner charts.
⚠️ Disclaimer
This indicator is a tool for technical analysis and does not provide guaranteed results. It should be used alongside other methods and proper risk management. The creator is not responsible for financial decisions made using this script.
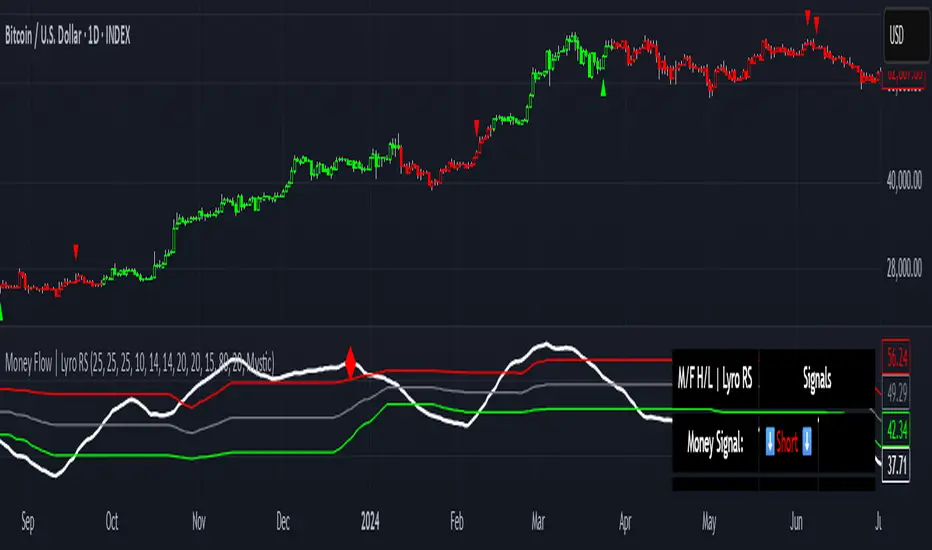
IST 4H Candle Boxes (5m)highlights forex 4h session in IST. Works for scalping with 4h bias.
highlights forex 4h session in IST. Works for scalping with 4h bias.
highlights forex 4h session in IST. Works for scalping with 4h bias.
highlights forex 4h session in IST. Works for scalping with 4h bias.
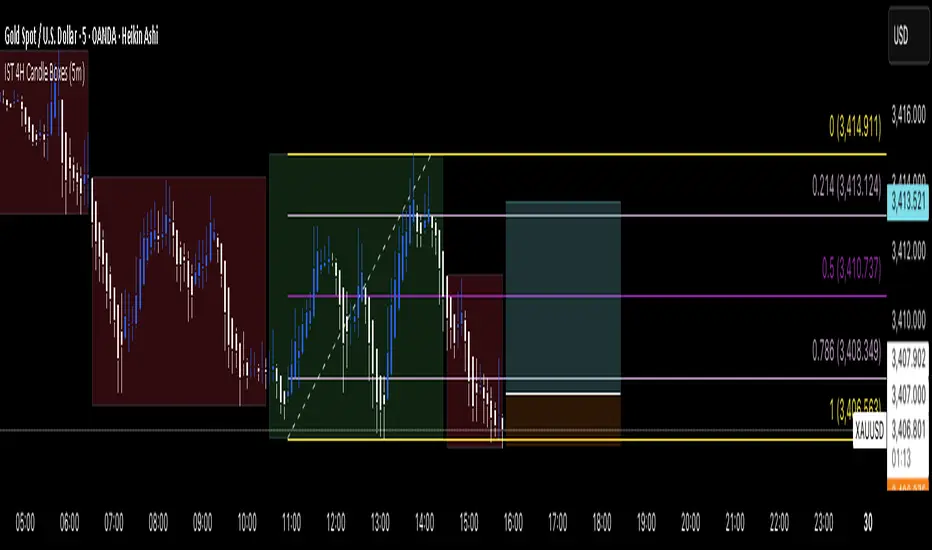
FlowFusion Money Flow — FP + VWAP Drift + PVT (−100..+100)Title (ASCII only)
FlowFusion Money Flow — Flow Pressure + Rolling VWAP Drift + PVT (Normalized −100..+100)
Short Description
Original money-flow oscillator combining Flow Pressure, Rolling VWAP Drift, and PVT Momentum into one normalized score (−100..+100) with a signal line, thresholds, optional component plots, and ready-made alerts.
Full Description (meets “originality & usefulness”)
What’s original
FlowFusion Money Flow is not a generic mashup. It builds a single score from three complementary, volume-aware components that target different facets of order flow:
Flow Pressure (FP) — In-bar directional drive scaled by relative volume.
Drive
=
close
−
open
max
(
high
−
low
,
tick
)
∈
=
max(high−low, tick)
close−open
∈ .
Relative Volume
=
volume
average volume over
𝑓
𝑝
𝐿
𝑒
𝑛
=
average volume over fpLen
volume
.
𝐹
𝑃
𝑟
𝑎
𝑤
=
Drive
×
RelVol
FP
raw
=Drive×RelVol then squashed (softsign) to
.
Why it belongs: distinguishes real pushes (big body and big volume) from noise.
Rolling VWAP Drift — Direction of VWAP itself over a rolling window, normalized by ATR.
𝑉
𝑊
𝐴
𝑃
𝑡
=
∑
(
𝑇
𝑃
×
𝑉
𝑜
𝑙
)
∑
𝑉
𝑜
𝑙
VWAP
t
=
∑Vol
∑(TP×Vol)
over vwapLen.
Drift
=
𝑉
𝑊
𝐴
𝑃
𝑡
−
𝑉
𝑊
𝐴
𝑃
𝑡
−
1
𝐴
𝑇
𝑅
=
ATR
VWAP
t
−VWAP
t−1
→ squashed to
.
Why it belongs: persistent VWAP movement signals sustained accumulation/distribution.
PVT Momentum — Price-Volume Trend standardized (z-score) and squashed.
𝑃
𝑉
𝑇
𝑡
=
𝑃
𝑉
𝑇
𝑡
−
1
+
𝑉
𝑜
𝑙
×
Δ
𝐶
𝑙
𝑜
𝑠
𝑒
𝐶
𝑙
𝑜
𝑠
𝑒
𝑡
−
1
PVT
t
=PVT
t−1
+Vol×
Close
t−1
ΔClose
.
𝑧
=
𝑃
𝑉
𝑇
−
SMA
(
𝑃
𝑉
𝑇
)
StDev
(
𝑃
𝑉
𝑇
)
z=
StDev(PVT)
PVT−SMA(PVT)
→ squashed to
.
Why it belongs: captures volume-weighted trend pressure without relying on price alone.
Composite score:
Score
=
𝑤
𝐹
𝑃
⋅
𝐹
𝑃
+
𝑤
𝑉
𝑊
𝐴
𝑃
⋅
𝑉
𝑊
𝐴
𝑃
_
𝐷
𝑟
𝑖
𝑓
𝑡
+
𝑤
𝑃
𝑉
𝑇
⋅
𝑃
𝑉
𝑇
_
𝑀
𝑜
𝑚
𝑤
𝐹
𝑃
+
𝑤
𝑉
𝑊
𝐴
𝑃
+
𝑤
𝑃
𝑉
𝑇
Score=
w
FP
+w
VWAP
+w
PVT
w
FP
⋅FP+w
VWAP
⋅VWAP_Drift+w
PVT
⋅PVT_Mom
with a Signal = SMA(Score, sigLen). Thresholds mark strong accumulation/distribution zones.
How it works (step-by-step)
Compute FP, VWAP Drift, PVT Momentum.
Normalize each to the same
scale.
Weighted average → FlowFusion Score.
Smooth with a Signal line to reduce whipsaw.
Optional background shading when Score exceeds thresholds.
How to use
Direction filter:
Score > 0 favors longs; Score < 0 favors shorts.
Momentum turns:
Score crosses above Signal → setup for long; below → setup for short.
Strength zones:
Above Upper Threshold (default +40) = strong buy pressure; below Lower (−40) = strong sell pressure.
Confluence:
Best near S/R, trendlines, or HTF bias. For scalping on 1–5m, consider sigLen 9–13 and thresholds ±40 to ±50.
Alerts included: zero cross, zone entries, and Score/Signal crossovers.
Inputs (key)
fpLen (20): relative-volume lookback for Flow Pressure.
vwapLen (34): rolling VWAP window.
pvtLen (50): PVT z-score window.
sigLen (9): Signal smoothing.
Weights: wFP, wVWAP, wPVT to bias the blend.
Thresholds: upperBand / lowerBand (defaults +40/−40).
Display: toggle component plots and background shading.
Best practices
Trending markets: increase wVWAP (VWAP Drift) or widen thresholds.
Ranging markets: increase wFP and wPVT; take quicker profits.
News: wait for bar close confirmation or reduce size.
Data quality: use consistent volume feeds (especially in crypto).
Limitations
Oscillators can stay extreme in strong trends; use structure/trend filters.
Volume anomalies (illiquid pairs, API glitches) can distort signals—sanity-check with another venue when possible.
Disclaimer
This indicator is for educational purposes only and is not financial advice. Trading involves risk; past performance does not guarantee future results. Always paper-trade first and use appropriate risk controls.
