Divergence CCI [mado]Divergence screener for CCI
Regular Bullish: "D" navy label
Hidden Bullish: "H" navy label
Regular Bearish: "D" red label
Hidden Bearish: "H" red label
In den Scripts nach "bear" suchen

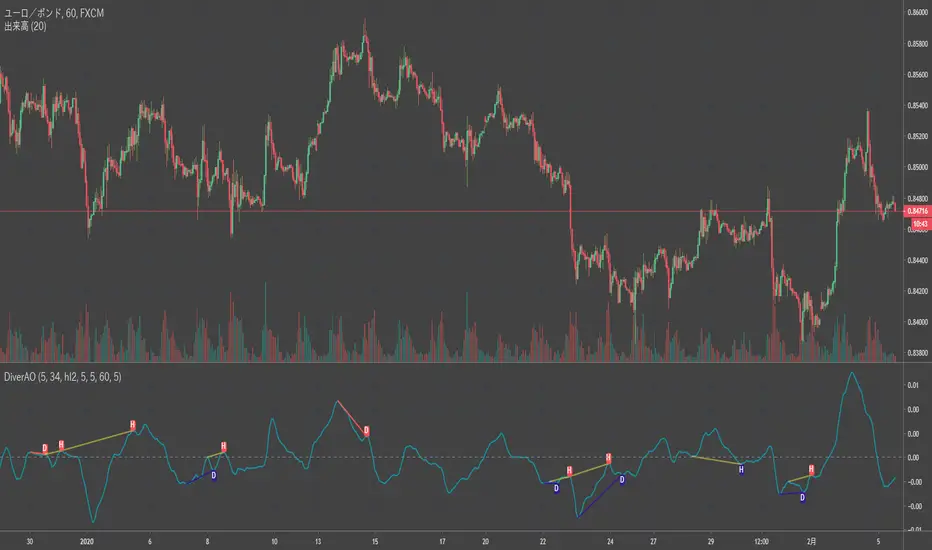
Divergence Awesome Oscillator [mado]Divergence screener for Awesome Oscillator
Regular Bullish: "D" navy label
Hidden Bullish: "H" navy label
Regular Bearish: "D" red label
Hidden Bearish: "H" red label
Elder impulse system with double exponential moving average dema
This version of impulse uses the double exponential moving average instead of the typical ema both to calculate macd and the moving slow and fast moving average that are plotted.
The impulse system :
The Impulse System combines two simple but powerful indicators.
One measures market inertia, the other its momentum. When both
point in the same direction, they identify an impulse worth following.
We get an entry signal when both indicators get in gear.
The Impulse System uses an exponential moving average to find
uptrends and downtrends. When the EMA rises, it shows that inertia
favors the bulls. When EMA falls, inertia works for the bears. The sec-
ond component is MACD-Histogram, an oscillator whose slope reflects
changes of power among bulls or bears. When MACD-Histogram rises,
it shows that bulls are becoming stronger. When it falls, it shows that
bears are growing stronger.
The Impulse System flags those bars where both the inertia and the
momentum point in the same direction. When both the EMA and
MACD-Histogram rise, they show that bulls are roaring and the uptrend
is accelerating.
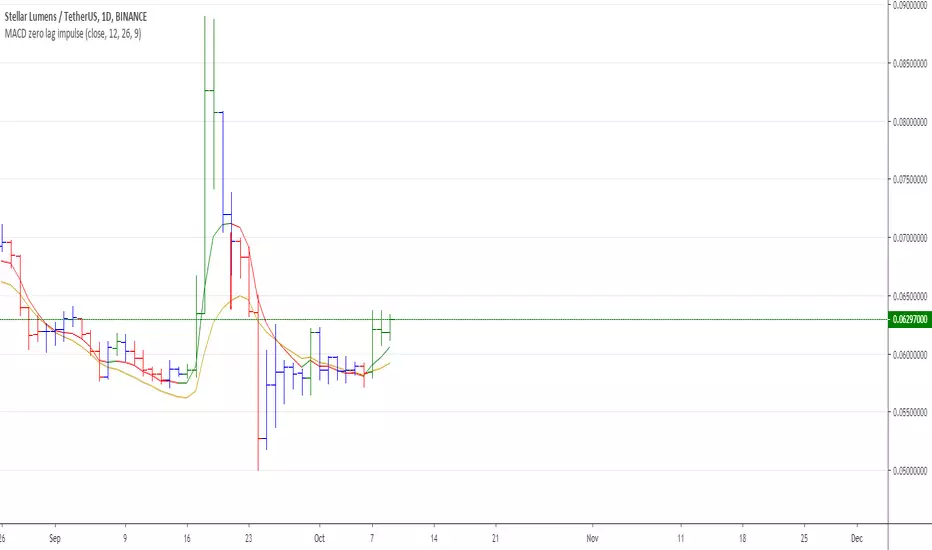
MACD Zero lag impulse systemThis version of impulse uses the double exponential moving average instead of the typical ema.
The impulse system :
The Impulse System combines two simple but powerful indicators.
One measures market inertia, the other its momentum. When both
point in the same direction, they identify an impulse worth following.
We get an entry signal when both indicators get in gear.
The Impulse System uses an exponential moving average to find
uptrends and downtrends. When the EMA rises, it shows that inertia
favors the bulls. When EMA falls, inertia works for the bears. The sec-
ond component is MACD-Histogram, an oscillator whose slope reflects
changes of power among bulls or bears. When MACD-Histogram rises,
it shows that bulls are becoming stronger. When it falls, it shows that
bears are growing stronger.
The Impulse System flags those bars where both the inertia and the
momentum point in the same direction. When both the EMA and
MACD-Histogram rise, they show that bulls are roaring and the uptrend
is accelerating.

Elder impulse system with barcolor + Safezone stops + emasThe impulse system :
The Impulse System combines two simple but powerful indicators.
One measures market inertia, the other its momentum. When both
point in the same direction, they identify an impulse worth following.
We get an entry signal when both indicators get in gear.
The Impulse System uses an exponential moving average to find
uptrends and downtrends. When the EMA rises, it shows that inertia
favors the bulls. When EMA falls, inertia works for the bears. The sec-
ond component is MACD-Histogram, an oscillator whose slope reflects
changes of power among bulls or bears. When MACD-Histogram rises,
it shows that bulls are becoming stronger. When it falls, it shows that
bears are growing stronger.
The Impulse System flags those bars where both the inertia and the
momentum point in the same direction. When both the EMA and
MACD-Histogram rise, they show that bulls are roaring and the uptrend
is accelerating.
The SafeZone Stop :
Once in a trade, where should you put your stop? This is one of the
hardest questions in technical analysis. After answering it, you’ll face
an even harder one—when and where to move that stop with the pas-
sage of time. Put a stop too close and it’ll get whacked by some mean-
ingless intraday swing. Put it too far, and you’ll have very skimpy
protection.
The Parabolic System, described in Trading for a Living, tried to
tackle this problem by moving stops closer to the market each day,
accelerating whenever a stock or a commodity reached a new extreme.
The trouble with Parabolic was that it kept moving even if the market
stayed flat and often got hit by meaningless noise.
SafeZone trails prices with stops tight enough to protect
capital but remote enough to keep clear of most random fluctuations.
Engineers design filters to suppress noise and allow the signal to come
through. If the trend is the signal, then the countertrend motion is the
noise. When the trend is up, we can define noise as that part of each
day’s range that protrudes below the previous day’s low. When the trend
is down, we can define noise as that part of each day’s range that pro-
trudes above the previous day’s high. SafeZone measures market noise
and places stops at a multiple of noise level away from the market.
We can make our lookback period 100 days or so if we want to aver-
age long-term market behavior.
SafeZone offers an original approach to placing stops. It monitors
changes in prices and adapts stops to the current levels of activity. It
places stops at individually tailored distances rather than at obvious
support and resistance levels.

DBT MoMo v.4DBT MOMO
Introduction: The MoMo is a TradingView indicator designed to evaluate momentum and give the user signals according to momentum shifts, strength, extensions, traps, and divergence. It’s an all in one oscillator that will make reading price action near term and long term much easier.
Part One: Strength
The MoMo consist of two major parts. A 3-candle back formula and a 24-candle back formula. The 3-candle back is called the Price Line (the histogram on the MoMo). The 24-candle back is called the Trend Line (the line on the MoMo). Both lines are placed into a range from 20 to -20. It can go higher than 20 or lower than -20, but this is extremely rare and short lived.
A positive number indicates a bullish bias, a negative number indicates a bearish bias. When the Price or Trend line are ascending while below 0 this indicates that the bearish momentum is weakening. When the Price or Trend line are descending while above 0 this indicates that the bullish momentum is weakening.
In a strong trend the Trend Line will likely flatten out around 15 or -15. While the Trend Line is flat the Price Line will likely shift rapidly, this can lead to bull and bear traps, we will discuss this in the Trap section.
A rare, but powerful signal from the MoMo is when the Price and Trend Lines “pinch” and begin to move in the same direction. If this is happening the trader should be looking to follow the direction of these lines.
Part Two: Extensions
When both Price and Trend Lines are above 10 or below -10 this will begin to signal an extension.
Purple: Indicates the bears are extended to the downside and a pullback or trend reversal upward is likely.
Gold: Indicates the bulls are extended to the upside and a pullback or trend reversal downward is likely.
When only the Trend Line is above 10 the MoMo will shade the upper range red. This indicates the Trend is becoming bullish or entering an extension. If the Trend Line cannot maintain above 10 for long and breaks below 10 this indicates it’s an extension and trend will most likely continue downward.
When only the Trend Line is below -10 the MoMo will shade the upper range green. This indicates the Trend is becoming bearish or entering an extension. If the Trend Line cannot maintain below -10 for long and breaks above -10 this indicates it’s an extension and trend will most likely continue upward.
When the green or purple shading have turned off take the lowest point, this is considered a support level or a local bottom.
When the red or gold shading have turned off take the highest point, this is considered a resistance level or a local top.
The trader can preemptively trade the purple or gold warnings but be warned these warnings can go on for a long time if the trend is very strong. It is the same mentality of an overbought or oversold RSI, except the MoMo extensions have a much higher strike rate.
To avoid preemptively trading these extensions the trader should wait for confirmation on the Price Line and on price action. The Price Line (histogram) should be moving upward during a purple extension to begin showing a bottom. The Price Line (histogram) should be moving downward during the gold extension to begin showing a top.
Part Three: Traps
The relation between the Price Line and Trend Line can create trading signals for bull and bear traps. When the Trend Line is flattened out around 15 or -15, indicating a strong trend is in place, and the Price Line is rapidly moving towards the midline this may indicate a trap is forming.
When the Trend Line is flat around 15 and the Price Line begins moving towards 0, if the Price Line reaches 0 or close to 0 and the Trend Line is still flat, a trap has begone. Once the Price Line shifts from decreasing (red) to increasing (green) the trap is playing out. Therefore, the trader should look to exit short positions or enter long positions.
When the Trend Line is flat around -15 and the Price Line begins moving towards 0, if the Price Line reaches 0 or close to 0 and the Trend Line is still flat, a trap has begone. Once the Price Line shifts from increasing (green) to decreasing (red) the trap is playing out. Therefore, the trader should look to exit long positions or enter short positions.
Part Four: Divergences
The MoMo is exceptional at finding divergences with the Price Line and occasionally the Trend Line.
To find a divergence with the MoMo the trader must look for when the histogram is not following price action completely.
Bullish Divergence: Price makes a lower low, MoMo makes a higher low.
Bearish Divergence: Price makes a higher high, MoMo makes a lower high.
Hidden Bull Divergence: Price makes a higher low, MoMo makes a lower low.
Hidden Bear Divergence: Price makes a lower high, MoMo makes a higher high.
For Access or Questions: Private message us. Thank you.

Absolute Strength MTF IndicatorIntroduction
The non-signal version of the absolute strength indicator from fxcodebase.com requested by ernie76 . This indicator originally from mt4 aim to estimate the bullish/bearish force of the market by using various methods.
The Indicator
Two lines are plotted, a bull line (blue) representing the bullish/buying force and a bear one (red) representing the bearish/selling force, when the bull line is greater than the bear line the market is considered to be strongly bullish, else strongly bearish.
The indicator use various method, Rsi, stochastic, adx. The Rsi method is the one by default.
The stochastic method is less reactive but smoother
The Adx method is way different, while the other two methods make the bull and bear lines somewhat uncorrelated, the adx method focus more on the overall market strength than individual buyer/seller strength.
The smoothing method use 3 different filters, SMA, EMA and LSMA, LSMA is more reactive than the two previous one while EMA is just more computer efficient.
It is possible to use price data of different time frames for the calculation of the indicator.
Stochastic method with 4 hour price close as source.
Conclusion
A classic indicator who can be derived into a lot of ways using a more adaptive architecture or recursion. Hope you find it a use :)
A big thanks to ernie76 for the request and the support/testing of the indicator
Feel free to pm me for any request.

fiercebitraderEl indicador fiercebitrader, es un indicador basado en el Índice Medio de Movimiento Direccional (ADX) es una herramienta de análisis técnico usada para medir la fuerza de la tendencia. El indicador direccional positivo ( DI) y el indicador direccional negativo (-DI) acompañan a la línea ADX. realzando la dirección de la tendencia.
Usados en conjunto forman un sistema de trading que es capaz de determinar tanto la dirección como la fuerza de la tendencia. El indicador consiste en tres líneas: la propia ADX (línea azul), una línea DI (línea verde), y una línea -DI (línea roja). El DI mide la fuerza de la tendencia alcista, mientras que el -DI mide la intensidad del movimiento bajista. La línea ADX muestra la fuerza de la tendencia en general creciendo tanto en las tendencias alcistas como bajistas.
Cuando el DI está por encima del -DI, se dice que los alcistas tienen el dominio direccional. De forma alternativa, cuando el -DI es más alto que el DI, el dominio direccional pertenece a los bajistas.
Es importante entender que el ADX (línea azul) muestra solo la fuerza de la tendencia y no la dirección de la tendencia. La dirección de la tendencia puede en cambio determinarse mirando al DI y el -DI (líneas roja y verde).
¿Cómo usarlo en el trading?
Operar con la tendencia reduce los riesgos e incrementa los beneficios potenciales. Es por esto que muchos traders prefieren consultar la fuerza de la tendencia con ayuda del ADX antes de invertir su dinero. Hay dos formas principales de usar el indicador:
El Cruce de DI
Cuando las líneas direccionales del positivo y negativo se cruzan, normalmente significa que la tendencia está cambiando. Esta información puede usarse para determinar puntos de entrada óptimos. Para los inversores que utilicen este sistema de trading, las señales son las siguientes:
(Compra) cuando el DI cruce el -DI , es mas efectivo, mas fuerte cuando toca o cruza la linea amarilla solida en el nivel de 27 y la tendencia general sea alcista.
El disparo se da en la linea de 20 punteada.
(Venta) cuando el -DI cruce el DI , es mas efectivo, más fuerte cuando toca o cruza la linea amarilla solida en el nivel de 27 y la tendencia sea bajista general sea bajista.
Valor de Fuerza Tendencia ADX
0-20 Tendencia Ausente o Débil
21-26 Disparo
27-50 Tendencia Fuerte
50-75 Tendencia muy Fuerte
75-100 Tendencia Extremadamente Fuerte
El fiercebitrader es un indicador de análisis técnico verdaderamente único, que combinado con otros indicadores, puede convertirse en la estrategia de trading definitiva en manos de un trader.
Recomendado para scalping en temporalidad de 5 min
swing day 1hora. Esta configurado para una operacion optima.
Acompañelo con el indicador bitradertracker.
Con mucho cariño Bitrader4.0
_________________________________
The fiercebitrader indicator, is an indicator based on the Mean Directional Movement Index (ADX) is a technical analysis tool used to measure the strength of the trend. The positive directional indicator (DI) and the negative directional indicator (-DI) accompany the ADX line. enhancing the direction of the trend.
Used together they form a trading system that is able to determine both the direction and strength of the trend. The indicator consists of three lines: the ADX itself (blue line), a DI line (green line), and a -DI line (red line). The DI measures the strength of the uptrend, while the -DI measures the intensity of the bearish movement. The ADX line shows the strength of the overall trend growing in both bullish and bearish trends.
When the DI is above the -DI, it is said that the bulls have the directional domain. Alternatively, when the -DI is higher than the DI, the directional domain belongs to the bears.
It is important to understand that the ADX (blue line) shows only the strength of the trend and not the direction of the trend. The direction of the trend can instead be determined by looking at the DI and the -DI (red and green lines).
How to use it in trading?
Operating with the trend reduces the risks and increases the potential benefits. This is why many traders prefer to consult the strength of the trend with the help of the ADX before investing their money. There are two main ways to use the indicator:
1) The Cross of DI
When the directional lines of the positive and negative intersect, it usually means that the trend is changing. This information can be used to determine optimal entry points. For investors who use this trading system, the signals are the following:
(Buy) when the DI crosses the -DI, it is more effective, stronger when it touches or crosses the solid yellow line at the level of 27 and the general trend is bullish.
The shot is given in the line of 20 dashed.
(Sale) when the -DI crosses the DI, it is more effective, stronger when it touches or crosses the solid yellow line at the level of 27 and the general bearish trend is bearish.
Strength Value ADX Trend
0-20 Absent or Weak Trend
21-26 Shot
27-50 Strong Trend
50-75 Very Strong Trend
75-100 Extremely Strong Trend
The fiercebitrader is a truly unique indicator of technical analysis, which combined with other indicators, can become the definitive trading strategy in the hands of a trader.
Recommended for scalping 5-minute and 1 hour.
It is configured for an optimal operation.
Accompany it with the bitradertracker indicator.
With love Bitrader4.0

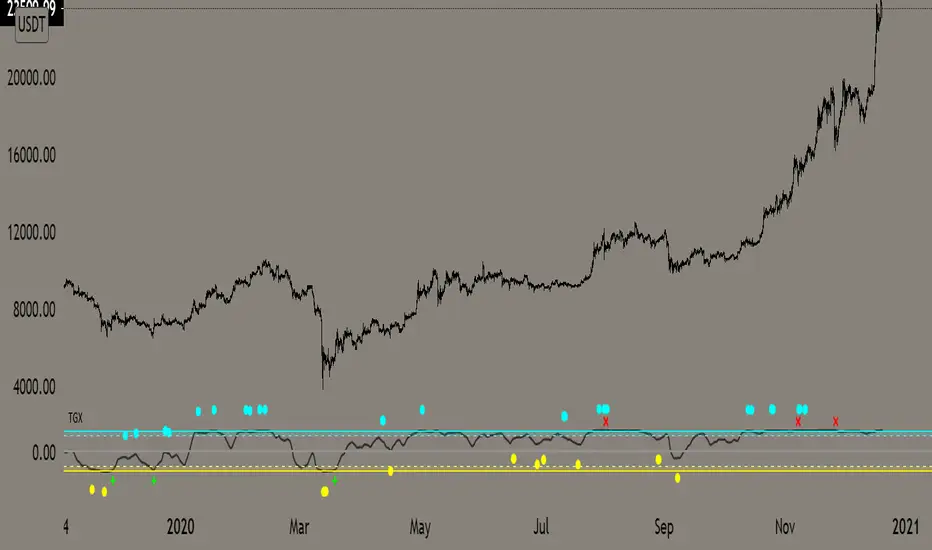
Top Goon X
Momentum based indicator
various signals for various parameters
bull/bear divergence will be seen as the dots with blue being bearish and yellow being bullish
the red X and green + are top and bottom signals per TGX
white flag appears respectably on top and bottom when all parameters are met bullshly or bearishly
Watch for TGX to reset while it rest just under resistance for a bullish set up
or
for TGX to run while sitting on top of support for bearish set up
TGX will trend in the upper parallel when bullish and bottom when bearish
towards the end of the trend is when you will see TGX "reset" for one last push up, albeit that push can run as long as it the market wants
@satoshiiheavy
Technical Analysis for www.cryptocurrentlyvip.com
Extremely Powerful Libra [Eric]This Indicator helps understand the Power shift between Bulls and Bears:
1. The volume is separated into bulls and bears power. For example, when we see a doji, we can check it for more inner information about who actually control the market.
2. The background is a prediction algo that predict the trending direction.
If you guys meet the:
Extremely Powerful Libra (3): Internal server study error
or Loop error,
Just check this button then switch my TF to 5 or bigger, normally 3 works well, but sometime the data is way too much that the server will reject to compile it.
prnt.sc

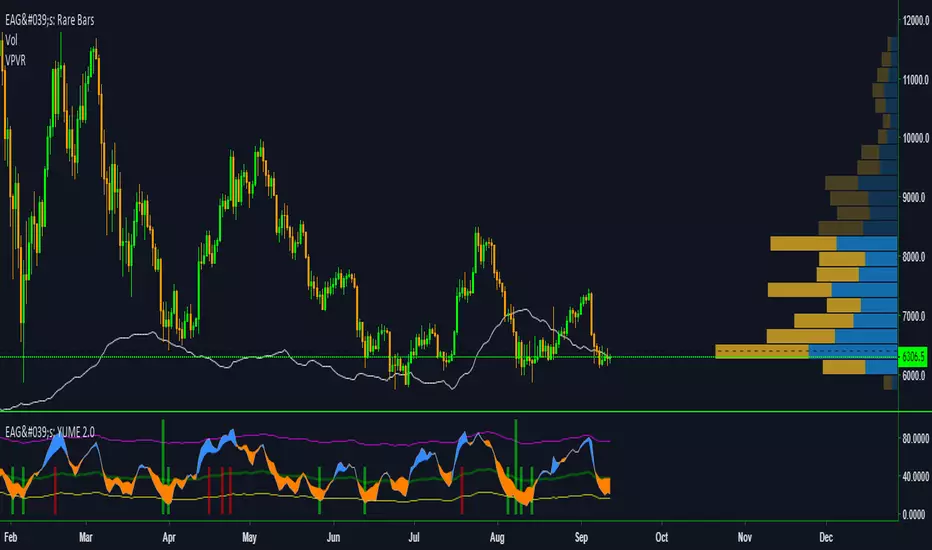
EdgeAnalysisGroup: Yume Wave 2.0This is a upgraded version of the wave with modified parameters for a higher success rate. 3 New Lengths and 75 more lines of code added to the overall algorithm. Also included are 2 sublevel signals based on the Fib MA and pattern trading.
The Wave:
+ The Yume is the Fast length
+ The Akume is the Slow length
+ The Miaku is a median weighted length
+ The Upper Limit is an overbought asset indication
+ The Lower Limit is an oversold asset indication
+ The Wave is the spread between Yume and Miaku
Bullish Indications:
+ The Yume is above the Akume
+ The Yume is above the Miaku
+ The Yume is below the Lower Limit
Bearish Indications:
+ The Yume is below the Akume
+ The Yume is below the Miaku
+ The Yume is above the Upper Limit
Signal Strength Weights:
+ 50 = Yume Wave crossed a Limit Line
+ 100 = Yume Wave crossed a Limit Line + Close to a Fib Moving Average
+ 100 = Edge's Market Bottom/Top Algorithm is marked 'True'
Setting up Signals (Based on a 100 Signal Height):
+ Set the "Bull Signal" to be at 50 or 100
+ Set the "Bear Signal" to be at 50 or 100
+ 50 is Agressive, 100 is Conservative.
+ Bull/Bear are separate so you can play conservative bull with aggressive bear.
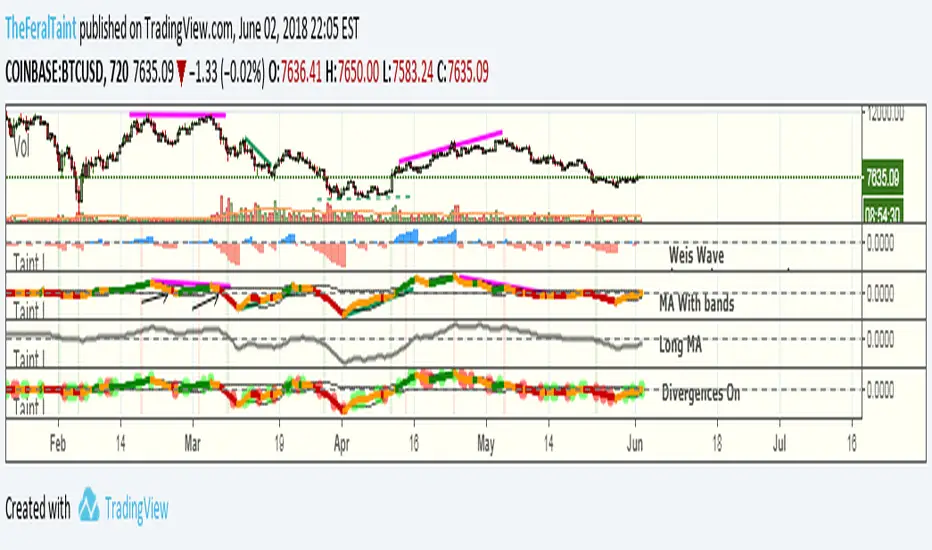
Taintalicious IndicatorThis indicator gathers data from the Weis Wave indicator (thanks to @LazyBear for the original code), and coverts it to something like a VPCI or a Chaikin Oscillator. This indicator is quite versatile. It can be ran with Weis Wave turned on and the Bands + MA turned on together, though I find the scaling becomes an issue. If it is the only indicator you're using, scaling isn't a problem as long as you enlarge it. I prefer to run the Bands + MA + Long MA as one setup, and flip to Weis Wave when I need to see the raw data underneath. You can use this indicator to spot momentum shifts, the strength of bullish or bearish moves, bull/bear divergences, trend reversals, consolidation/squeezes, and even Wyckoff springs. It will take some getting used to though.
Tips for interpretation:
--Bearish/Bearish Divergence: TI diverges from price. TI is making lower highs or higher lows while price is making higher highers or higher lows. You can turn on the setting to highlight some of these divergences, but I find it easier to simply look for them.
--As an Oscillator: TI crossing zero can indicate a shift in momentum. The deeper the initial rise or fall past zero, the stronger the momentum shift.
--Overbought/Oversold: When TI breaches the bands while they are wide--indicating high volatility in the same way Bollinger Bands do--this can be viewed as an overbought or oversold signal. Begin looking for an entry once TI forms a "v" shape, and begins moving back towards the bands. The best entry is typically when TI breaks back into the bands. These breaches are highlighted with either green or red.
--Long MA: This can be used for bull/bear divergence as well as a leading indicator for trend reversals or momentum shifts. TI crossing above or below the Long MA is one signal. Whether the Long MA is above or below zero indicates the market sentiment/trend over the last 100 periods--above zero being bullish and below zero being bearish.
Best setting for Trend Detection Length is 4
Feel free to contact me on Twitter if you have questions: @TheFeralTaint
420_Jpn_PatternsMy first iteration of a script that ID's japanese candlestick patterns including:
bullish_engulfing www.investopedia.com
bearish_engulfing www.investopedia.com
bullish_harami www.investopedia.com
bearish_harami www.investopedia.com
piercing_line (bullish) www.investopedia.com
dark_cloud_cover (bearish) www.investopedia.com
morning_star (bullish) www.investopedia.com
evening_star (bearish) www.investopedia.com
bullish_belt www.investopedia.com
bearish_belt www.investopedia.com
aka_sanpei (bullish) www.investopedia.com
sanba_garasu (bearish) www.investopedia.com
three_stars_south (bullish) www.investopedia.com
stick_sandwich www.investopedia.com
bullish_meeting_line www.thepatternsite.com
bearish_meeting_line www.thepatternsite.com
bullish_kicking www.thepatternsite.com
bearish_kicking thepatternsite.com
ladder_bottom (bullish) www.thepatternsite.com
inverted_hammer www.thepatternsite.com
shooting_star www.thepatternsite.com www.thepatternsite.com
hanging_man (bearish) www.thepatternsite.com
hammer (bullish) www.thepatternsite.com
xoxo
sn00p

Call-Put Cross Strike Match [Pro]📊 Call-Put Cross Strike Match - Professional Options Trading Indicator
Advanced NSE Options Analysis with AI-Powered Trading Signals & Dynamic Display
🎯 Overview
The Call-Put Cross Strike Match is an institutional-grade options analysis tool designed exclusively for NSE NIFTY and BANKNIFTY traders. Built on Pine Script v6, this indicator combines sophisticated cross-strike matching algorithms with intelligent trading signal generation to identify optimal options trading opportunities in real-time.
What makes it unique:
Analyzes 25 call-put combinations simultaneously
Generates actionable BUY/SELL signals using professional strategies
Fully customizable display with 9 table positions and 6 size options
Simplified setup with semi-automatic ATM detection
Clean, clutter-free interface with only essential information
Perfect for intraday scalpers, premium sellers, and positional options traders.
✨ Key Features
1. 🔍 Advanced Cross-Strike Matching Algorithm
The indicator calculates price differences for all 25 combinations (5 call strikes × 5 put strikes) and identifies the best matches based on put-call parity.
How it works:
Compares each call option price with every put option price
Calculates absolute difference: |Call - Put |
Ranks all 25 combinations from lowest to highest difference
Highlights top 3 or top 5 matches with visual checkmarks
Visual indicators:
✓✓ (Double check) = Best match (lowest price difference)
✓ (Single check) = Good matches (top 3 or top 5)
Empty cells = No match (significant price difference)
Why this matters:
When Call ≈ Put at same strike, it indicates fair pricing and synthetic position opportunities. The indicator automatically finds these opportunities across different strike combinations.
2. 🎯 Intelligent Trading Signals (Last Column)
The indicator generates professional trading recommendations based on Call-Put price difference analysis:
Signal Types:
BUY CE - Long call opportunity (bullish)
SELL CE - Short call opportunity (premium selling)
BUY PE - Long put opportunity (bearish/hedge)
SELL PE - Short put opportunity (premium selling)
BULL - Moderate bullish bias
BEAR - Moderate bearish bias
ATM - Neutral market (near parity)
NEUTRAL - No clear bias
Color-Coded for Quick Decisions:
🟩 Green = Long opportunities (BUY CE, BULL)
🟥 Red = Short call opportunities (SELL CE)
🟧 Orange = Long put opportunities (BUY PE)
🟫 Maroon = Short put opportunities (SELL PE)
⬛ Gray = Neutral zones (ATM, NEUTRAL)
3. 🤖 Three Professional Signal Modes
SMART Mode (Recommended) 🎯
Context-aware institutional strategy that considers strike position relative to spot price.
Signal Logic:
text
OTM Call Expensive (C-P > threshold, Strike > Spot):
→ SELL CE (Premium selling opportunity)
ITM Call Underpriced (C-P > threshold, Strike < Spot):
→ BUY CE (Synthetic long opportunity)
OTM Put Expensive (C-P < -threshold, Strike < Spot):
→ SELL PE (Premium selling opportunity)
ITM Put Underpriced (C-P < -threshold, Strike > Spot):
→ BUY PE (Protection or synthetic short)
Near Parity (|C-P| < threshold/4):
→ ATM (Neutral market, straddle/strangle zone)
Moderate Imbalance:
→ BULL or BEAR (Directional bias without extreme pricing)
Best for: Professional traders, option writers, synthetic position builders
MOMENTUM Mode 📈
Trend-following strategy that rides market momentum.
Signal Logic:
text
Calls Expensive (C-P > threshold):
→ BUY CE (Follow bullish momentum)
Puts Expensive (C-P < -threshold):
→ BUY PE (Follow bearish momentum)
Near Parity:
→ NEUTRAL (No clear trend)
Best for: Intraday scalpers, directional traders, swing traders
MEAN REVERSION Mode 🔄
Counter-trend strategy focused on premium selling.
Signal Logic:
text
Calls Overpriced (C-P > threshold):
→ SELL CE (Collect inflated premium)
Puts Overpriced (C-P < -threshold):
→ SELL PE (Collect inflated premium)
Near Parity:
→ ATM (Fair value, no edge)
Best for: Option writers, theta decay strategies, credit spread traders
4. 🎨 Fully Customizable Display
Dynamic Table Positioning (9 Options):
Top: left, center, right
Middle: left, center, right
Bottom: left, center, right
Choose position based on your chart layout and other indicators.
Dynamic Table Sizing (6 Options):
Auto - Adapts to content
Tiny - Minimal space (for cluttered charts)
Small - Default, best balance
Normal - Medium size (1080p monitors)
Large - Big text (4K monitors)
Huge - Maximum size (presentations)
Text scales intelligently:
Headers, data, and checkmarks adjust proportionally
Checkmarks remain visible even in tiny mode
Info row stays readable at all sizes
5. ⚙️ Simplified Input System
Auto Mode (Recommended):
Enter just 5 strikes once at market open - used for both calls and puts.
Example for NIFTY at 25,900:
text
Strike 1: 25850 (ATM - 100)
Strike 2: 25900 (ATM - 50)
Strike 3: 25950 (ATM)
Strike 4: 26000 (ATM + 50)
Strike 5: 26050 (ATM + 100)
Manual Mode (Advanced):
Enter separate call and put strikes for cross-strike arbitrage analysis.
Why this matters:
50% fewer inputs compared to traditional indicators
One-time setup at market open
Rarely needs updating (only if market moves 100+ points)
6. 🎛️ Semi-Automatic ATM Detection
The indicator automatically:
Detects current NIFTY/BANKNIFTY spot price
Calculates ATM strike (rounded to nearest 50 or 100)
Marks ATM strikes with *ATM in the table
Displays ATM and spot price in info box
No manual recalculation needed!
7. 📊 Clean Information Display
Main Table (Top/Middle/Bottom):
CE \ PE matrix showing all strike combinations
Checkmarks (✓✓ and ✓) highlighting best matches
SIGNAL column with color-coded trading recommendations
Best Match footer showing optimal combination
Info row displaying symbol, signal mode, and spot price
Info Box (Bottom Left):
Symbol (NIFTY/BANKNIFTY)
Signal Mode (Smart/Momentum/Mean Reversion)
Current Spot Price
Detected ATM Strike
Best Matched Call Strike
Best Matched Put Strike
Match Difference
C-P value for best match
📋 Quick Setup Guide (3 Steps)
Step 1: Add Indicator
Open NIFTY or BANKNIFTY chart on TradingView
Add "Call-Put Cross Strike Match " from indicators
Step 2: Configure Basic Settings
text
Symbol Detection: Auto (reads from chart)
Expiry Date: 251219 (format: YYMMDD for 19-Dec-2025)
Strike Mode: Auto
Strike Interval: 50 (for NIFTY) or 100 (for BANKNIFTY)
Step 3: Enter Strikes
At market open (9:15 AM), check current price and enter 5 strikes:
text
Example: NIFTY at 25,937
Strike 1: 25850 (ATM - 100)
Strike 2: 25900 (ATM - 50)
Strike 3: 25950 (ATM) ← Rounded to nearest 50
Strike 4: 26000 (ATM + 50)
Strike 5: 26050 (ATM + 100)
That's it! The indicator handles everything else automatically.
💡 Real-World Use Cases
1. 📉 Premium Selling (Mean Reversion Mode)
Scenario: Looking for overpriced options to write
How to use:
Set Signal Mode to "Mean Reversion"
Set Threshold: 30 (NIFTY) or 75 (BANKNIFTY)
Look for SELL CE or SELL PE signals with ✓ or ✓✓
Sell naked options or credit spreads at those strikes
Target 30-50% profit or 3-5 days theta decay
Perfect for: Credit spreads, iron condors, covered calls, naked puts
2. 📈 Directional Trading (Momentum Mode)
Scenario: Scalping intraday moves
How to use:
Set Signal Mode to "Momentum"
Set Threshold: 15 (aggressive) or 25 (conservative)
BUY CE signal + ✓✓ = Long call entry
Enter with tight stop (20% of premium)
Target 30-50% gain within 1-2 hours
Perfect for: Intraday scalping, swing trading, trend following
3. 🔄 Synthetic Positions (Smart Mode)
Scenario: Building synthetic long/short with defined risk
How to use:
Set Signal Mode to "Smart"
Look for BUY CE at ITM strike + SELL PE at OTM strike
Both should have ✓ indicator (good parity)
Creates synthetic long position
Lower capital than buying futures
Perfect for: Professional traders, arbitrage, capital efficiency
4. ⚖️ ATM Strategy Optimization (Smart Mode)
Scenario: Finding optimal strikes for straddle/strangle
How to use:
Identify strike marked *ATM
Check if signal shows ATM (balanced market)
If BULL/BEAR → Market has directional bias, adjust accordingly
✓✓ indicates best matched strike for neutral strategies
Perfect for: Volatility trading, earnings plays, event trading
5. 🛡️ Hedging Optimization (Smart Mode)
Scenario: Protecting long equity positions
How to use:
Look for BUY PE signals (protection signals)
Avoid strikes with SELL PE (expensive hedges)
✓✓ shows best value for hedge entry
Optimize hedge timing and strike selection
Perfect for: Portfolio hedging, risk management, protective puts
⚙️ Settings Guide
Symbol Settings
Symbol Detection: Auto (recommended) or Manual
Manual Symbol: NIFTY or BANKNIFTY
Expiry Date: Format YYMMDD (e.g., 251219 = 19-Dec-2025)
Update every Thursday after 3:30 PM for next week's expiry
Strike Settings
Strike Mode: Auto (recommended) or Manual
Strike Interval:
50 for NIFTY
100 for BANKNIFTY
Trading Signals
Signal Mode: Smart / Momentum / Mean Reversion
Smart: Professional institutional strategy (default)
Momentum: Trend-following for scalpers
Mean Reversion: Premium selling for writers
Signal Threshold: Sensitivity in points
NIFTY Recommendations:
Conservative: 30-40 points (fewer, higher quality signals)
Balanced: 20-25 points (default)
Aggressive: 10-15 points (more signals, more noise)
BANKNIFTY Recommendations:
Conservative: 75-100 points
Balanced: 50-60 points (default)
Aggressive: 30-40 points
Algorithm Settings
Matching Mode:
Top 3: Shows 3 best matches (cleaner display)
Top 5: Shows 5 best matches (more opportunities)
Display Settings
Show Matching Table: Enable/disable main table
Table Position: Choose from 9 positions
top_right (default) - Doesn't block price action
middle_right - Centered vertical view
bottom_right - If top is crowded
Table Size: Choose from 6 sizes
small (default) - Best for most users
normal - For 1080p/4K monitors
tiny - If you have many indicators
📊 Understanding The Table
Table Layout Example:
text
CE \ PE | 25950 | 25900 | 25850 | 26000 | 26050 | SIGNAL
---------|-------|-------|-------|-------|-------|--------
25850 | | | | | | SELL PE
25900*ATM| | ✓ | | | | ATM
25950 | ✓✓ | | | | | BULL
26000 | | | | ✓ | | BUY CE
26050 | | | | | | SELL CE
---------|-------|-------|-------|-------|-------|--------
Best Match: 25950 / 25950 (0.25)
Info: NIFTY | Smart | Spot:25881.9
Reading the Table:
Rows (Left): Call option strike prices
Columns (Top): Put option strike prices
Cells: Checkmarks where Call ≈ Put
✓✓: Best match (minimum price difference)
✓: Good matches (top 3 or 5)
Empty: Prices too different (no match)
*ATM: Automatically detected at-the-money strike
SIGNAL Column: Actionable trading recommendation for each call strike
Info Box Metrics:
Symbol: Currently analyzed index
Signal Mode: Active strategy
Spot: Current underlying price
ATM: Calculated at-the-money strike
Best Call: Matched call strike
Best Put: Matched put strike
Match Diff: Price difference (lower = better)
C-P (Best): Call minus Put for best match
📈 Best Practices
Strike Selection & Maintenance
At Market Open (9:15 AM):
Check current price (e.g., NIFTY at 25,937)
Round to nearest interval (25,950 for 50 interval)
Enter 5 strikes: -100, -50, 0, +50, +100 from ATM
Update Frequency:
Usually no update needed entire day
Update only if market moves 100+ points from initial ATM
Typically 0-2 updates per trading session
Signal Interpretation by Confidence Level
High Confidence (✓✓ + Signal):
Best match indicator present
Strongest signal quality
Highest probability setup
Medium Confidence (✓ + Signal):
Good match present
Reliable signal
Acceptable risk/reward
Low Confidence (Signal without ✓):
No match indicator
Strike far from parity
Requires additional confirmation
Risk Management Rules
Never trade signals blindly. Always:
✅ Confirm with price action and support/resistance
✅ Check overall market trend (NIFTY/BANKNIFTY direction)
✅ Consider time decay (theta) for your position
✅ Monitor IV changes (implied volatility)
✅ Use proper position sizing (1-2% risk per trade)
✅ Set stop losses (20-30% of premium for longs)
✅ Have profit targets (30-50% for scalps)
Timeframe Selection
Intraday Trading:
Use 5-minute or 15-minute chart
Momentum or Smart mode
Lower threshold (aggressive)
Quick entries and exits
Positional Trading:
Use hourly or daily chart
Smart or Mean Reversion mode
Higher threshold (conservative)
Swing trade positions
Combining with Other Tools
Recommended complements:
Support/resistance levels (horizontal lines)
Trend indicators (EMA 20/50, SuperTrend)
Volume analysis (confirm breakouts)
India VIX (volatility context)
Option chain data (open interest)
🎓 Strategy Examples
Strategy 1: Professional Premium Selling
text
Mode: Mean Reversion
Threshold: 30 (NIFTY) / 75 (BANKNIFTY)
Timeframe: Daily
Rules:
1. Wait for SELL CE or SELL PE signal
2. Verify strike has ✓ or ✓✓ (good parity)
3. Check if OTM (Strike away from spot)
4. Sell option or create credit spread
5. Target: 30-50% profit or 3-5 days theta
6. Stop: If signal changes to BUY
Position: Naked short or credit spreads
Risk: Define with spreads or capital allocation
Strategy 2: Intraday Momentum Scalping
text
Mode: Momentum
Threshold: 15 (aggressive)
Timeframe: 5-minute
Rules:
1. Wait for BUY CE signal + ✓✓
2. Enter long call immediately
3. Stop loss: 20% of premium paid
4. Target 1: 30% gain (partial exit)
5. Target 2: 50% gain (full exit)
6. Exit if signal changes or 2 hours pass
Position: Long calls or long puts only
Risk: 1-2% of capital per trade
Strategy 3: Synthetic Long Position
text
Mode: Smart
Threshold: 25 (NIFTY) / 60 (BANKNIFTY)
Timeframe: Hourly
Rules:
1. Identify BUY CE signal at ITM strike
2. Identify SELL PE signal at OTM strike
3. Both should have ✓ indicator
4. Buy ITM call + Sell OTM put = Synthetic Long
5. Lower capital than futures
6. Defined risk (width of strikes)
Position: Call debit + Put credit
Risk: Net debit paid (defined risk)
Strategy 4: ATM Straddle Entry
text
Mode: Smart
Threshold: 20 (default)
Timeframe: Daily
Rules:
1. Find strike marked *ATM
2. Check signal shows "ATM" (neutral)
3. Verify ✓✓ at that strike
4. Sell ATM call + Sell ATM put
5. Collect maximum premium
6. Exit at 30% profit or before expiry
Position: Short straddle or iron condor
Risk: Use defined risk (iron condor recommended)
🔔 Important Notes
Data Accuracy
Indicator uses TradingView's NSE options data feed
Always verify prices independently before trading
Ensure market is open (9:15 AM - 3:30 PM IST)
Check for "-" in cells indicating missing data
Expiry Management
Update expiry date every week on Thursday post-closing
Format: YYMMDD (6 digits)
Weekly expiry: Every Thursday
Monthly expiry: Last Thursday of month
Strike Format
NIFTY: Multiples of 50 (25850, 25900, 25950...)
BANKNIFTY: Multiples of 100 (51800, 51900, 52000...)
Wrong strikes = No data in table
Performance Optimization
Indicator updates every bar close
No lag or performance issues
Works on all timeframes (1m to 1D)
Maximum 5 calls + 5 puts = 10 security calls (within limits)
⚠️ Disclaimer
Trading options involves substantial risk of loss and is not suitable for all investors. This indicator is provided for educational and informational purposes only. It does not constitute financial advice, investment advice, or trading advice.
Important disclaimers:
Options can expire worthless, resulting in 100% loss
Past performance of signals is not indicative of future results
Accuracy depends on TradingView's NSE data feed
Signals are mathematical analysis, not predictions
You are solely responsible for your trading decisions
The developer is not liable for any trading losses incurred while using this indicator.
Before trading, ensure you understand:
Options Greeks (Delta, Gamma, Theta, Vega, Rho)
Implied volatility and its impact
Time decay and expiration risks
Assignment risk for short positions
Liquidity and slippage considerations
Margin requirements and capital needs
Always:
Use proper risk management (1-2% per trade)
Trade with capital you can afford to lose
Paper trade before live trading
Consult with a licensed financial advisor
Start with small position sizes
Never risk more than you can afford to lose
📊 Technical Specifications
Platform: TradingView Pine Script v6
Exchanges: NSE (National Stock Exchange of India)
Instruments: NIFTY, BANKNIFTY options
Timeframes: All (1m, 5m, 15m, 1h, 1D)
Strikes Analyzed: 5 calls × 5 puts = 25 combinations
Security Calls: 10 (5 calls + 5 puts)
Table Positions: 9 (all corners and centers)
Table Sizes: 6 (auto to huge)
Signal Modes: 3 (Smart, Momentum, Mean Reversion)
Performance: Optimized, minimal lag
🎯 Who Should Use This?
✅ Perfect For:
Options Traders: Intraday and positional
Premium Sellers: Option writers and theta strategists
Arbitrage Traders: Synthetic position builders
Straddle/Strangle Traders: ATM strategy traders
Professional Traders: Institutional-grade analysis
Volatility Traders: IV imbalance exploiters
Scalpers: Quick intraday moves
❌ Not Suitable For:
Stock options traders (NSE index-specific)
Equity-only traders (requires options knowledge)
International markets (NSE format only)
Complete beginners (requires basic options understanding)
💬 FAQ
Q: Why manual strike entry? Why not fully automatic?
A: Pine Script's type system limits fully automatic strike generation from live data. However, setup takes just 30 seconds once at market open, and the indicator handles all analysis automatically throughout the day.
Q: How often should I update strikes?
A: Rarely! Only when market moves 100+ points from initial ATM. Usually 0-2 times per day, even in volatile markets.
Q: Which Signal Mode is best?
A: Smart mode (default) for professional trading. Use Momentum for intraday scalping, Mean Reversion for premium selling.
Q: Can I use this for stock options?
A: No. The indicator is designed specifically for NSE index options (NIFTY and BANKNIFTY) with NSE format.
Q: Does it work on mobile?
A: Yes, but table display is optimized for desktop/tablet screens. Use "tiny" or "small" size on mobile.
Q: What if I see "-" in cells?
A: Check expiry format (YYMMDD), verify strikes match NSE strikes, and ensure market is open.
Q: What's the difference between ✓✓ and ✓?
A: ✓✓ = Best match (lowest price difference), highest quality. ✓ = Good matches (top 3-5), reliable quality.
Q: Can I backtest this indicator?
A: The indicator shows live analysis. For backtesting options strategies, you'll need historical options data and separate backtesting tools.
Q: What does the info box show?
A: Bottom-left box shows key metrics: symbol, signal mode, spot price, ATM strike, best matched strikes, match difference, and C-P value.
Q: Why no chart plotting?
A: v1.0 focuses on clean table display with maximum information density. Chart plotting may be added in future versions based on user feedback.
🙏 Credits
Developed by a professional options trader for the Indian trading community. Inspired by institutional trading desks and market makers who use call-put parity for daily trading decisions.
Found This Helpful?
⭐ Rate 5 stars if it improved your trading
💬 Comment with your strategy results
🔔 Follow for updates and new indicators
📢 Share with fellow options traders
Feature Requests
Continuous improvement based on trader feedback. Suggest features in comments!
Planned Features (v2.0):
Multi-expiry comparison
Greeks display (Delta, Theta, Vega)
Historical signal performance stats
Custom signal formulas
Export to CSV functionality
🏷️ Tags for Search
#Options #OptionsTrading #NIFTY #BANKNIFTY #NSE #India #OptionChain #CallPut #PutCallParity #Straddle #Strangle #ATM #TradingSignals #OptionsStrategy #PremiumSelling #OptionsScanner #Derivatives #IntradayTrading #VolatilityTrading #Arbitrage #SyntheticPosition #OptionsGreeks #OptionsSelling #OptionsWriting #IndianStockMarket #NSEOptions #OptionsAnalysis #TechnicalAnalysis #AlgoTrading #QuantTrading #ProfessionalTrading #TradingIndicator #PineScript #TradingView
📝 Version History
v1.0 (Current - Dec 2025)
Pine Script v6 implementation
Cross-strike matching (5×5 matrix, 25 combinations)
Three signal modes (Smart, Momentum, Mean Reversion)
Trading signal generation with color coding
Dynamic table positioning (9 positions)
Dynamic table sizing (6 sizes)
Intelligent text scaling
Semi-automatic ATM detection
Auto symbol detection
Simplified input system (50% fewer inputs in Auto mode)
Clean information display
Info box with key metrics
NSE NIFTY & BANKNIFTY support
Start trading smarter with institutional-grade options analysis! 📈💰🚀
Disclaimer: Options trading is subject to market risk. Please read all scheme-related documents carefully before investing.

COIN-Clean Market Structure & Trend Confirmation TP(Updated)COIN-Clean Market Structure & Trend Confirmation TP(Updated) — COIN (Simple Trend + Buy/Sell Confirmation + Take-Profit Targets)
This indicator is designed to help you trade COIN by clearly showing trend direction, confirmation signals, and predefined take-profit levels. It removes guesswork and helps you stay on the right side of the move.
HOW TO LOAD
Add the indicator to a COIN chart. Turn on Extended Hours for best results. The default settings are already optimized and do not need to be changed.
THE RIBBON (WHAT TO TRADE)
The ribbon shows the overall trend.
Teal ribbon = price is trending up (look for BUY setups).
Red ribbon = price is trending down (look for SELL setups).
Gray ribbon = no clear trend (do not trade).
If the ribbon is gray, the indicator will block signals to protect you from choppy markets.
BULL AND BEAR DOTS (TREND CHANGE ALERTS)
Bull dot appears when the trend turns bullish.
Bear dot appears when the trend turns bearish.
These dots are early warnings, not entries. Always wait for a BUY or SELL arrow before taking a trade.
BUY AND SELL ARROWS (WHEN TO ENTER)
BUY arrows appear only when conditions strongly favor upward movement.
SELL arrows appear only when conditions strongly favor downward movement.
These arrows are confirmation signals. Enter only after the arrow appears.
Not every move will get a signal. Fewer, higher-quality signals are intentional.
OPENING BIAS (FIRST MINUTES PROTECTION)
Right after the market opens, the indicator sets a directional bias.
During this time, it will only allow trades in the safer direction.
This helps avoid getting chopped up during the opening volatility.
TAKE-PROFIT TARGETS AND STOP
When a BUY or SELL arrow appears, take-profit levels automatically show on the chart:
TP1, TP2, and TP3 are profit targets.
STOP is where the trade is considered wrong.
You can scale out at each target or exit fully at any level.
Only the most recent targets are shown to keep the chart clean.
SIMPLE WAY TO USE IT
Check the ribbon color (teal or red).
Ignore the chart if the ribbon is gray.
Wait for a BUY or SELL arrow.
Use the take-profit targets and stop provided.
Do not chase moves without arrows.
IMPORTANT NOTES
This indicator does not repaint confirmed signals.
It is meant to keep trading simple and disciplined.
It works best during strong trend days, not sideways markets.

Hybrid Strategy: Trend/ORB/MTFHybrid Strategy: Trend + ORB + Multi-Timeframe Matrix
This script is a comprehensive "Trading Manager" designed to filter out noise and identify high-probability breakout setups. It combines three powerful concepts into a single, clean chart interface: Trend Alignment, Opening Range Breakout (ORB), and Multi-Timeframe (MTF) Analysis.
It is designed to prevent "analysis paralysis" by providing a unified Dashboard that confirms if the trend is aligned across 5 different timeframes before you take a trade.
How it Works
The strategy relies on the "Golden Trio" of confluence:
1. Trend Definition (The Setup) Before looking for entries, the script analyzes the immediate trend. A bullish trend is defined as:
Price is above the Session VWAP.
The fast EMA (9) is above the slow EMA (21). (The inverse applies for bearish trends).
2. The Signal (The Trigger) The script draws the Opening Range (default: first 15 minutes of the session).
Buy Signal: Price breaks above the Opening Range High while the Trend is Bullish.
Sell Signal: Price breaks below the Opening Range Low while the Trend is Bearish.
3. The Confirmation (The Filter) A signal is only valid if the Higher Timeframe (default: 60m) agrees with the direction. If the 1m chart says "Buy" but the 60m chart is bearish, the signal is filtered out to prevent false breakouts.
Key Features
The Matrix Dashboard A zero-lag, real-time table in the corner of your screen that monitors 5 user-defined timeframes (e.g., 5m, 15m, 30m, 60m, 4H).
Trend: Checks if Price > EMA 21.
VWAP: Checks if Price > VWAP.
ORB: Checks if Price is currently above/below the Opening Range of that session.
D H/L: Warns if price is near the Daily High or Low.
PD H/L: Warns if price is near the Previous Daily High or Low.
Visual Order Blocks The script automatically identifies valid Order Blocks (sequences of consecutive candles followed by a strong explosive move).
Chart: Draws Green/Red zones extending to the right, showing where price may react.
Dashboard: Displays the exact High, Low, and Average price of the most recent Order Blocks for precision planning.
Risk Management (Trailing Stop) Once a trade is active, the script plots Chandelier Exit dots (ATR-based trailing stop) to help you manage the trade and lock in profits during trend runs.
Visual Guide (Chart Legend)
⬜ Gray Box: Represents the Opening Range (first 15 minutes). This is your "No Trade Zone." Wait for price to break out of this box.
🟢 Green Line: The Opening Range High. A break above this line signals potential Bullish momentum.
🔴 Red Line: The Opening Range Low. A break below this line signals potential Bearish momentum.
🟢 Green / 🔴 Red Zones (Boxes): These are Order Blocks.
🟢 Green Zone: A Bullish Order Block (Demand). Expect price to potentially bounce up from here.
🔴 Red Zone: A Bearish Order Block (Supply). Expect price to potentially reject down from here.
⚪ Dots (Trailing Stop):
🟢 Green Dots: These appear below price during a Bullish trend. They represent your suggested Stop Loss.
🔴 Red Dots: These appear above price during a Bearish trend.
🏷️ Buy / Sell Labels:
BUY: Triggers when Price breaks the Green Line + Trend is Bullish + HTF is Bullish.
SELL: Triggers when Price breaks the Red Line + Trend is Bearish + HTF is Bearish.
Settings
Session: Customizable RTH (Regular Trading Hours) to filter out pre-market noise.
Matrix Timeframes: 5 fixed slots to choose which timeframes you want to monitor.
Order Blocks: Adjust the sensitivity and lookback period for Order Block detection.
Risk: Customize the ATR multiplier for the trailing stop.
Disclaimer
This tool is for educational purposes only. Past performance does not guarantee future results. Always manage your risk properly.

Kinetic Scalper [BULLBYTE]KINETIC SCALPER - ADVANCED MOMENTUM & CONFLUENCE TRADING SYSTEM
A SOPHISTICATED MULTI-FACTOR ANALYSIS INDICATOR FOR PRECISION ENTRIES
The Kinetic Scalper is a comprehensive trading analysis tool that combines volume-weighted momentum calculations, multi-oscillator divergence detection, and a proprietary 15-factor confluence scoring system to identify high-probability reversal setups across all timeframes.
WHAT MAKES THIS INDICATOR ORIGINAL
This is NOT a simple mashup of existing indicators.
The Kinetic Scalper features a completely custom momentum engine called the "Kinetic Pulse" - a volume-weighted momentum oscillator with Fisher Transform normalization that fundamentally differs from standard RSI or other momentum indicators. Every component feeds into a unified algorithmic framework designed specifically for this system.
KEY INNOVATIONS:
KINETIC PULSE ENGINE
Unlike standard RSI which uses simple price changes, the Kinetic Pulse applies:
→ Volume weighting to price movements (high-volume moves carry more weight)
→ EMA smoothing instead of traditional SMA (faster response to changes)
→ Fisher Transform normalization for improved signal clarity
→ Adaptive period adjustment based on current volatility regime
→ Result: A momentum oscillator that responds to conviction, not just price noise
15-FACTOR CONFLUENCE SCORING SYSTEM
Every signal is graded based on the number of confirming factors present:
→ Momentum position (oversold/overbought extremes)
→ Momentum velocity (direction change confirmation)
→ Momentum acceleration (strength of reversal)
→ Multi-oscillator divergence (price vs. 3 oscillators)
→ Volume confirmation (above-average participation)
→ Volume delta analysis (buying vs. selling pressure)
→ Higher timeframe alignment (trend confirmation from larger timeframe)
→ Session timing (major forex session awareness)
→ Structure clearance (clear path to profit targets)
→ Support/resistance proximity (confluence with key levels)
→ Market regime filtering (trending vs. choppy conditions)
Signals are graded A+, A, or B based on how many factors align:
• CONSERVATIVE MODE: A+ requires 12+ factors, A requires 9+, B requires 7+
• BALANCED MODE: A+ requires 10+ factors, A requires 7+, B requires 5+
• AGGRESSIVE MODE: A+ requires 8+ factors, A requires 5+, B requires 3+
TRADE ANALYSIS STATE MACHINE
A sophisticated monitoring system that tracks trade conditions in real-time using:
→ 5-state analysis framework (Factors Aligned / Positive Bias / Mixed Signals / Factors Weakening / Negative Bias)
→ Hysteresis-based transitions (different thresholds to enter vs. exit states)
→ Confidence smoothing with EMA (reduces noise, prevents flip-flopping)
→ Minimum commitment periods before state changes
→ Override logic for significant events (near TP/SL, momentum reversals)
→ Result: Stable, actionable guidance that doesn't change on every bar
INSTRUMENT-AWARE CALIBRATION
Automatically detects what you're trading and applies optimized parameters:
→ Forex Majors: Standard ATR, high session weight
→ Forex Crosses: Tighter stops, moderate session weight
→ Crypto: Wider stops (1.8x multiplier), reduced session weight (24/7 markets)
→ Indices: Moderate-wide stops, high session weight
→ Commodities: Moderate stops, moderate session weight
WHAT THIS INDICATOR DOES
The Kinetic Scalper is designed to identify high-confluence reversal opportunities by analyzing multiple dimensions of market behavior simultaneously.
CORE FUNCTIONS:
1. SIGNAL GENERATION
→ Identifies potential reversal points at oversold/overbought extremes
→ Confirms with multi-oscillator divergence detection
→ Validates with volume, higher timeframe, and structural analysis
→ Filters out low-probability setups automatically
→ Grades signals based on total confluence factors present
2. AUTOMATED TRADE TRACKING
→ Calculates structure-based or ATR-based stop loss levels
→ Projects take profit targets using risk-to-reward ratios
→ Monitors live position status (P/L, distance to targets, R-multiple)
→ Tracks TP1 and TP2 hits automatically
→ Displays outcome markers (TP HIT, PARTIAL WIN, STOPPED)
3. REAL-TIME CONDITION MONITORING
→ Analyzes 6 factor categories during active trades
→ Provides confidence scoring (0-100 scale)
→ Generates actionable guidance based on current market state
→ Alerts when conditions deteriorate or improve
→ Helps with trade management decisions
4. COMPREHENSIVE MARKET ANALYSIS
→ Session detection (Asian, London, New York, Overlap)
→ Volatility regime identification (Low, Normal, High, Extreme)
→ Trend state classification (Trending Up/Down, Ranging, Transitioning)
→ Volume analysis (relative volume and delta approximation)
→ Choppiness filtering (blocks signals in ranging markets)
WHY USE THIS INDICATOR
PROBLEM: Most momentum indicators generate too many false signals at extremes.
SOLUTION: The Kinetic Scalper requires MULTIPLE confirming factors before generating a signal, dramatically reducing noise and focusing on high-confluence setups.
ADVANTAGES:
✓ QUALITY OVER QUANTITY
→ Signal grading ensures you can filter for only the highest-quality setups
→ A+ signals have 10-12+ confirming factors aligned
→ Cooldown periods prevent over-trading the same move
✓ COMPLETE TRADE FRAMEWORK
→ Entry signals with confluence justification
→ Calculated stop loss based on market structure or ATR
→ Two profit targets with clear risk-to-reward ratios
→ Live trade monitoring with factor analysis
→ Outcome tracking and visual markers
✓ ADAPTIVE TO MARKET CONDITIONS
→ Volatility-based period adjustment for momentum calculations
→ Instrument-specific ATR multipliers
→ Session awareness for forex traders
→ Higher timeframe trend filtering
→ Automatic regime detection (trending vs. choppy)
✓ TRANSPARENT METHODOLOGY
→ Every input has detailed tooltips explaining its purpose
→ Signal tooltips show exactly why a signal was generated
→ Dashboard displays all relevant market conditions
→ Factor scores are visible during trades
→ No "black box" mystery calculations
✓ NON-REPAINTING & RELIABLE
→ All signals use barstate.isconfirmed (only on closed bars)
→ Higher timeframe data uses lookahead_off with historical offset
→ No future data access or repainting behavior
→ What you see is what you get - signals don't disappear or move
HOW THE INDICATOR WORKS
SIGNAL GENERATION PROCESS:
STEP 1: MOMENTUM ANALYSIS
The Kinetic Pulse engine calculates volume-weighted momentum:
→ Price changes are weighted by volume ratio vs. 20-bar average
→ High-volume moves have more influence on the oscillator
→ Gains and losses are smoothed using EMA (not SMA like RSI)
→ Fisher Transform is applied for normalization to 0-100 scale
→ Result: Momentum reading that emphasizes conviction, not noise
STEP 2: REVERSAL DETECTION
The indicator looks for potential reversal conditions:
→ Kinetic Pulse reaching oversold zone (below dynamic lower threshold)
→ Momentum velocity turning positive after being negative (for longs)
→ OR bullish divergence detected on multiple oscillators
→ Price making lower lows while oscillators make higher lows = divergence
STEP 3: MULTI-OSCILLATOR DIVERGENCE CONFIRMATION
Divergence is validated across three sources:
→ Kinetic Pulse divergence
→ CCI divergence
→ Stochastic divergence
→ Multiple oscillators confirming divergence increases signal reliability
STEP 4: CONFLUENCE FACTOR SCORING
The system evaluates all 15 possible confirming factors:
→ Momentum position: Is pulse oversold/overbought? (+0 to +2 points)
→ Momentum direction: Is velocity reversing? (+0 to +2 points)
→ Momentum acceleration: Is reversal strengthening? (+0 to +1 point)
→ Divergence count: How many oscillators show divergence? (+0 to +2 points)
→ Volume strength: Is volume above 1.3x average? (+0 to +1 point)
→ Volume delta: Is cumulative delta positive/negative? (+0 to +1 point)
→ HTF alignment: Does higher timeframe support direction? (+0 to +2 points)
→ Session timing: Is it a prime trading session? (+0 to +1 point)
→ Clear air: Is path to targets clear of obstacles? (+0 to +1 point)
→ Structure confluence: Are we near support/resistance? (+0 to +1 point)
→ Market regime: Is market trending, not choppy? (+0 to +1 point)
Total possible score: 15 points
Minimum for signal: 3-12 points depending on sensitivity mode
STEP 5: FILTER VALIDATION
Before generating a signal, additional checks are performed:
→ Volume must be above minimum threshold (if filter enabled)
→ Higher timeframe must not oppose the signal direction (if filter enabled)
→ Target path must be clear of major resistance/support (if filter enabled)
→ Volatility must not be EXTREME (blocks signals in chaos)
→ Risk-to-reward ratio must meet minimum requirement
→ Cooldown period must have elapsed since last signal
STEP 6: SIGNAL GRADING
If all filters pass, the signal is graded based on score:
→ A+ Grade: Highest confluence (8-12+ factors depending on sensitivity)
→ A Grade: High confluence (5-9+ factors)
→ B Grade: Moderate confluence (3-7+ factors)
Only graded signals (A+, A, or B) are displayed.
STEP 7: TRADE LEVEL CALCULATION
Stop loss and targets are calculated automatically:
STOP LOSS METHODS:
• Structure-Based: Uses recent swing low/high with ATR buffer, constrained by min/max ATR limits
• ATR-Based: Pure ATR multiplier with min/max constraints
• Fixed ATR: Simple ATR multiplier, no adjustments
TARGET CALCULATION:
• TP1: Entry ± (Stop Distance × Target 1 R:R)
• TP2: Entry ± (Stop Distance × Target 2 R:R)
• Default: TP1 at 1.0 R:R (1:1), TP2 at 2.0 R:R (1:2)
STEP 8: TRADE MONITORING
Once a signal is taken, the indicator tracks:
→ Current P/L in ticks and R-multiples
→ Distance to each target in ATR units
→ Distance to stop loss in ATR units
→ TP1 hit detection (marks with label, updates lines)
→ TP2 hit detection (closes trade, marks outcome)
→ Stop loss hit detection (closes trade, differentiates partial vs. full loss)
STEP 9: FACTOR ANALYSIS (DURING TRADES)
The Trade Analysis Panel monitors 6 key factor categories:
→ Momentum: Is momentum still aligned with trade direction? (-15 to +15 pts)
→ Position: Current R-multiple position (-12 to +12 pts)
→ Volume: Is volume still supportive? (-6 to +6 pts)
→ HTF Alignment: Does HTF still support trade? (-6 to +8 pts)
→ Target Proximity: How close are we to targets? (0 to +10 pts)
→ Stop Proximity: Are we dangerously close to stop? (-15 to +3 pts)
Raw scores are summed and smoothed using 5-bar EMA to create Confidence Score (0-100).
STEP 10: STATE MACHINE TRANSITIONS
Based on smoothed confidence, the system transitions between 5 states:
→ FACTORS ALIGNED (72+): Everything looks good
→ POSITIVE BIAS (58-72): Conditions favorable
→ MIXED SIGNALS (48-58): Neutral conditions
→ FACTORS WEAKENING (22-48): Concerning signals
→ NEGATIVE BIAS (<22): Poor conditions
Hysteresis prevents rapid flipping between states (different entry/exit thresholds).
RECOMMENDED TIMEFRAMES & INSTRUMENTS
TIMEFRAME VERSATILITY:
Despite the name "Scalper," this indicator works on ALL timeframes:
✓ LOWER TIMEFRAMES (1m - 15m)
→ Ideal for: Scalping and very short-term trades
→ Expect: More signals, faster trades, requires active monitoring
→ Best for: Forex majors, liquid crypto pairs
→ Tip: Use Conservative sensitivity to reduce noise
✓ MID TIMEFRAMES (15m - 1H)
→ Ideal for: Intraday trading and day trading
→ Expect: Moderate signal frequency, 1-4 hour trade duration
→ Best for: Forex, indices, major crypto
→ Tip: Balanced sensitivity works well here
✓ HIGHER TIMEFRAMES (4H - Daily)
→ Ideal for: Swing trading and position trading
→ Expect: Fewer signals, higher-quality setups, multi-day trades
→ Best for: All instruments
→ Tip: Can use Aggressive sensitivity for more opportunities
INSTRUMENT COMPATIBILITY:
✓ FOREX MAJORS (EUR/USD, GBP/USD, USD/JPY, etc.)
→ Auto-detected or manually select "Forex Major"
→ Session filtering is highly valuable here
→ London/NY overlap generates best signals
✓ FOREX CROSSES (EUR/GBP, AUD/NZD, etc.)
→ Auto-detected or manually select "Forex Cross"
→ Slightly tighter stops applied automatically
→ Session weight reduced vs. majors
✓ CRYPTOCURRENCIES (BTC, ETH, SOL, etc.)
→ Auto-detected or manually select "Crypto"
→ Wider stops (1.8x multiplier) due to volatility
→ Session filtering less relevant (24/7 markets)
→ Works well on both spot and perpetual futures
✓ INDICES (S&P 500, NASDAQ, DAX, etc.)
→ Auto-detected or manually select "Index"
→ Session opens (NY, London) are important
→ Moderate stop widths applied
✓ COMMODITIES (Gold, Silver, Oil, etc.)
→ Auto-detected or manually select "Commodity"
→ Moderate stops and session awareness
→ Works well on both spot and futures
VISUAL ELEMENTS EXPLAINED
SIGNAL MARKERS:
The indicator offers 3 display styles (choose in settings):
• PREMIUM STYLE (Default)
→ Signal appears below/above candles with connecting line
→ Background panel with grade badge (LONG , SHORT , etc.)
→ Entry price displayed
→ Direction arrow pointing to entry candle
→ Most informative, best for detailed analysis
• MINIMAL STYLE
→ Simple dot marker with grade text next to it
→ Clean, unobtrusive design
→ Best for mobile devices or cluttered charts
→ Less visual noise
• CLASSIC STYLE
→ Diamond marker with grade badge below/above
→ Traditional indicator aesthetic
→ Good balance between info and simplicity
ALL STYLES INCLUDE:
→ Signal tooltips with complete trade plan details
→ Grade display (A+, A, or B)
→ Color coding (bright colors for A+, standard for A/B)
SIGNAL TOOLTIP CONTENTS:
When you hover over any signal marker, you'll see:
→ Signal direction and grade
→ Confluence score (actual points vs. required)
→ Reason for signal (divergence type, reversal pattern)
→ Complete trade plan (Entry, Stop, TP1, TP2)
→ Risk in ticks
→ Risk-to-reward ratios
→ Market conditions at signal (Pulse value, HTF status, Volume, Session)
TRADE LEVEL LINES:
When Trade Tracking is enabled:
• ENTRY LINE (Yellow/Gold)
→ Solid horizontal line at entry price
→ Shaded zone around entry (±ATR buffer)
→ Label showing entry price
→ Extends 20-25 bars into future
• STOP LOSS LINE (Orange/Red)
→ Dashed line at stop level
→ Label showing stop price and distance in ticks
→ Turns dotted and changes color after TP1 hit (breakeven implied)
→ Deleted when trade closes
• TAKE PROFIT 1 LINE (Blue)
→ Dotted line at TP1 level
→ Label showing price and R:R ratio (e.g., "1:1.0")
→ Turns solid and changes to green when hit
→ Deleted after TP1 hit
• TAKE PROFIT 2 LINE (Blue)
→ Solid line at TP2 level
→ Label showing price and R:R ratio (e.g., "1:2.0")
→ This is the "full win" target
→ Deleted when trade closes
OUTCOME MARKERS:
When trade milestones are reached:
• - Green label appears when first target is touched
• - Green label when second target is touched (trade complete)
• - Red label if stop loss hit before any target
• - Orange label if TP1 hit but then stopped out
PREVIOUS DAY LEVELS:
If enabled (Show Previous Day Levels):
• PDH (Previous Day High) - Solid red/orange line
→ Label shows "PDH: "
→ Useful resistance reference for intraday trading
• PDL (Previous Day Low) - Solid green line
→ Label shows "PDL: "
→ Useful support reference for intraday trading
BACKGROUND TINTS:
Subtle background colors indicate states:
→ Light green tint: Active long position being tracked
→ Light red tint: Active short position being tracked
→ Light orange tint: Extreme volatility warning (signals blocked)
DASHBOARD GUIDE
The indicator features TWO dashboard panels:
━━━━━━━━━━━━━━━━━━━━━━━━━━━━━━━━━━━━━━━━━━━━━━━━━━━━━━━━━━━━━━━━━━━━━━━━━━━━━
MAIN DASHBOARD (Top Right by default)
━━━━━━━━━━━━━━━━━━━━━━━━━━━━━━━━━━━━━━━━━━━━━━━━━━━━━━━━━━━━━━━━━━━━━━━━━━━━━
WHEN NO TRADE IS ACTIVE:
→ Bias: Current market bias (BULLISH, BEARISH, NEUTRAL, LEAN LONG/SHORT)
→ Based on Kinetic Pulse position and velocity
→ Helps you understand overall momentum direction
→ Pulse: Current Kinetic Pulse value (0-100 scale)
→ <30 = Oversold (potential long setups developing)
→ >70 = Overbought (potential short setups developing)
→ 40-60 = Neutral zone
→ Volatility: Current volatility regime (LOW, NORMAL, HIGH, EXTREME)
→ Calculated from ATR ratio vs. 100-period average
→ EXTREME volatility blocks all signals (too chaotic)
→ Trend: Market state classification
→ TREND UP / TREND DOWN: ADX > 25, directional movement clear
→ RANGING: ADX < 20, choppy conditions
→ TRANSITIONING: ADX 20-25, developing conditions
→ VOLATILE: Extreme ATR regime
→ Session: Current forex session
→ ASIAN (00:00-08:00 UTC)
→ LONDON (07:00-16:00 UTC)
→ NEW YORK (13:00-22:00 UTC)
→ LDN/NY (13:00-16:00 UTC) - Overlap period, highest volatility
→ OFF-HOURS: Outside major sessions
→ Volume: Current volume vs. 20-bar average
→ Displayed as multiplier (e.g., "1.45x" = 45% above average)
→ Green if >1.3x (high volume, bullish for signal quality)
→ Red if <0.8x (low volume, bearish for signal quality)
→ HTF: Higher timeframe analysis status
→ BULLISH: HTF momentum supports longs
→ BEARISH: HTF momentum supports shorts
→ NEUTRAL: No clear HTF direction
→ Best Score: Highest confluence score currently available
→ Shows both long and short scores
→ Format: " / "
→ Example: "8/7 " means long score is 8, threshold is 7, long is leading
→ Helps you anticipate which direction might signal next
→ PDH/PDL: Previous day high and low prices
→ Quick reference for intraday support/resistance
WHEN TRADE IS ACTIVE:
→ Trade: Direction and grade (e.g., "LONG ")
→ Entry: Entry price of current trade
→ P/L: Current profit/loss
→ Shown in ticks and R-multiples
→ Format: "+45 | +0.75R" or "-20 | -0.35R"
→ Green when positive, red when negative
→ TP1: First target status
→ Shows price and distance if not hit
→ Shows "HIT" in green if reached
→ TP2: Second target price and distance
→ Stop: Stop loss price and current distance from stop
→ Bars: Number of bars since entry (trade duration)
━━━━━━━━━━━━━━━━━━━━━━━━━━━━━━━━━━━━━━━━━━━━━━━━━━━━━━━━━━━━━━━━━━━━━━━━━━━━━
TRADE ANALYSIS PANEL (Bottom Left by default)
━━━━━━━━━━━━━━━━━━━━━━━━━━━━━━━━━━━━━━━━━━━━━━━━━━━━━━━━━━━━━━━━━━━━━━━━━━━━━
This panel provides algorithmic analysis of market conditions. It does NOT provide investment advice or recommendations.
WHEN NO TRADE IS ACTIVE:
Shows scanning status and signal readiness:
→ Long/Short Readiness Gauges
→ Visual bar showing proximity to signal threshold
→ Score display (e.g., "8/7" means 8 points scored, 7 needed)
→ "RDY" indicator when threshold reached
→ Status Messages
→ "Scanning for setups..." - Normal scanning mode
→ "Long setup ready - cooldown: X bars" - Signal qualified but in cooldown
→ "Oversold conditions - watch for reversal" - Setup developing
→ "Choppy conditions detected" - Warning about market state
→ "Extreme volatility - signals blocked" - Safety filter active
WHEN TRADE IS ACTIVE:
Header shows current analysis state:
→ FACTORS ALIGNED (Green) - Everything looks good, confidence 72+
→ POSITIVE BIAS (Light Green) - Conditions favorable, confidence 58-72
→ MIXED SIGNALS (Blue) - Neutral conditions, confidence 48-58
→ FACTORS WEAKENING (Orange) - Concerning signals, confidence 22-48
→ NEGATIVE BIAS (Red) - Poor conditions, confidence <22
Confidence Score:
→ Displayed as percentage (0-100%)
→ Visual gauge (|||||.....)
→ Trend indicator (Rising, Falling, Stable)
→ Shows momentum of confidence change
Factor Breakdown (if enabled):
Shows 6 factor categories with individual scores:
→ Momentum: Is momentum aligned with trade? (-15 to +15 points)
→ Positive if velocity matches trade direction
→ Negative if momentum opposes trade
→ Position: Current R-multiple analysis (-12 to +12 points)
→ Positive if trade is in profit
→ Negative if underwater
→ Score increases as profit grows
→ Volume: Is volume supportive? (-6 to +6 points)
→ Positive if volume above average
→ Negative if volume weak
→ HTF Align: Higher timeframe status (-6 to +8 points)
→ Positive if HTF still supports trade direction
→ Negative if HTF turned against trade
→ Target: Proximity to profit targets (0 to +10 points)
→ Higher score when approaching targets
→ Bonus if TP1 already hit and near TP2
→ Stop Dist: Distance from stop loss (-15 to +3 points)
→ Negative if dangerously close to stop (<0.3 ATR)
→ Positive if well away from stop (>1.5 ATR)
Each factor shows:
• Score value with +/- indicator
• Trend symbol: + (improving), - (deteriorating), = (stable)
• Visual gauge
Guidance Messages:
→ "TARGET 2 APPROACHING" - TP2 within 0.3 ATR
→ "TARGET 1 APPROACHING" - TP1 within 0.3 ATR
→ "STOP PROXIMITY WARNING" - Stop within 0.3 ATR
→ "Factors aligned - Holding" - Positive state, stay in trade
→ "Conditions favorable" - Still looking good
→ "Conditions mixed - " - Neutral assessment
→ "Factors deteriorating" - Warning of weakening setup
→ "Confluence weakening - secure gains" - Consider exit if profitable
COMPACT MODE (Mobile-Friendly):
→ Reduces panel size by showing only essential info
→ Factor icons instead of full breakdowns
→ Simplified guidance messages
→ Perfect for smaller screens
SETTINGS GUIDE
MASTER SETTINGS:
Instrument Type
→ Purpose: Optimizes ATR multipliers and session weights for your asset
→ Options: Auto-Detect (recommended), Forex Major, Forex Cross, Crypto, Index, Commodity
→ Default: Auto-Detect
→ When to change: If auto-detection is incorrect for your symbol
Signal Sensitivity
→ Purpose: Controls how many factors required before generating signals
→ Options:
• Conservative: Requires 12+ for A+, 9+ for A, 7+ for B (fewer, highest quality)
• Balanced: Requires 10+ for A+, 7+ for A, 5+ for B (recommended)
• Aggressive: Requires 8+ for A+, 5+ for A, 3+ for B (more frequent)
→ Default: Balanced
→ When to change: If you want fewer signals (Conservative) or more opportunities (Aggressive)
Enable Trade Signals
→ Purpose: Master on/off switch for signal generation
→ Default: ON
→ When to disable: If you only want to use the analysis dashboards without signals
Enable Trade Tracking
→ Purpose: Tracks active trades and monitors conditions until TP/SL hit
→ Default: ON
→ When to disable: If you manage trades manually and don't want automatic tracking
Show Entry/Stop/Target Levels
→ Purpose: Displays trade plan lines and labels on chart
→ Default: ON
→ When to disable: If you prefer clean charts or manage levels yourself
DISPLAY SETTINGS:
Color Theme
→ Purpose: Optimizes colors for your chart background
→ Options: Dark (for dark charts), Light (for light charts)
→ Default: Dark
Signal Display Style
→ Purpose: Visual style of signal markers
→ Options:
• Premium: Badge with line and background panel (most detailed)
• Minimal: Simple dot with grade text (cleanest)
• Classic: Diamond marker with badge (traditional)
→ Default: Premium
Signal Distance
→ Purpose: How far signal labels appear from price bars (in ATR units)
→ Range: 0.5 to 10.0
→ Default: 2.0
→ When to adjust: Increase to 3.0-4.0 if signals hide behind candle wicks
TP/SL Label Distance
→ Purpose: Spacing of price labels to prevent overlap
→ Range: 0.5 to 5.0
→ Default: 1.5
Show Previous Day Levels
→ Purpose: Display PDH/PDL reference lines
→ Default: ON
→ Best for: Intraday traders who respect previous day levels
MAIN DASHBOARD:
Show Main Dashboard
→ Purpose: Toggle visibility of market conditions table
→ Default: ON
Main Dashboard Position
→ Options: Top Right, Top Left, Bottom Right, Bottom Left
→ Default: Top Right
→ When to change: To avoid overlap with TradingView's built-in panels
TRADE ANALYSIS PANEL:
Show Trade Analysis Panel
→ Purpose: Toggle factor analysis dashboard
→ Default: ON
Analysis Panel Position
→ Options: Top Right, Top Left, Bottom Right, Bottom Left, Middle Right, Middle Left
→ Default: Bottom Left
→ Recommended: Bottom Right or Middle Right to avoid overlap with Main Dashboard
Compact Mode
→ Purpose: Reduces panel size for mobile or smaller screens
→ Default: OFF
→ When to enable: Mobile trading, small screens, or minimalist preference
Show Factor Details
→ Purpose: Displays individual factor scores vs. overall confidence only
→ Default: ON
→ When to disable: For more compact view showing only state and confidence
RISK MANAGEMENT:
Stop Loss Method
→ Purpose: How stop loss distance is calculated
→ Options:
• Structure-Based: Uses swing highs/lows with ATR buffer (recommended)
• ATR-Based: Pure ATR multiplier with min/max constraints
• Fixed ATR: Simple multiplier, no adjustments
→ Default: Structure-Based
→ Impact: Structure-Based respects market geometry but constrains within safe limits
ATR Stop Multiplier
→ Purpose: Multiplier for ATR-based stop calculation
→ Range: 0.5 to 3.0
→ Default: 1.5
→ When to adjust:
• Increase to 2.0-2.5 for more breathing room (fewer false stops)
• Decrease to 1.0-1.2 for tighter stops (but more stop-outs)
Maximum Stop Distance (ATR)
→ Purpose: Cap on stop width to prevent excessive risk
→ Range: 1.0 to 5.0
→ Default: 2.5
→ Impact: If structure-based stop exceeds this, ATR-based stop is used instead
Minimum Stop Distance (ATR)
→ Purpose: Floor on stop width to avoid noise-induced stops
→ Range: 0.2 to 1.0
→ Default: 0.5
→ Impact: Prevents stops too tight to survive normal volatility
Target 1 Risk/Reward Ratio
→ Purpose: R:R for first profit target
→ Range: 0.5 to 2.0
→ Default: 1.0 (1:1 ratio)
→ Common values: 1.0 for quick profit taking, 1.5 for patient trading
Target 2 Risk/Reward Ratio
→ Purpose: R:R for second profit target (full win)
→ Range: 1.0 to 4.0
→ Default: 2.0 (1:2 ratio)
→ Common values: 2.0-3.0 for balanced risk/reward
Minimum R:R Required
→ Purpose: Filters out signals with poor risk/reward
→ Range: 0.5 to 2.0
→ Default: 1.0
→ Impact: Signals where potential reward doesn't meet this ratio are rejected
→ WARNING: Always ensure your position sizing means a stop loss = no more than 1-2% of your account, regardless of R:R ratio
SIGNAL FILTERS:
Session Awareness
→ Purpose: Weights signals higher during major forex sessions
→ Default: ON
→ Impact: Doesn't block signals, but session quality factors into scoring
→ Best for: Forex traders
Session Timezone
→ Purpose: Timezone for session calculations
→ Options: UTC, America/New_York, Europe/London, Asia/Tokyo, Asia/Hong_Kong
→ Default: UTC
→ When to change: Match your broker's server time
Higher Timeframe Alignment
→ Purpose: Checks HTF momentum before generating signals
→ Default: ON
→ Impact: Filters counter-trend signals, improves quality
→ Recommended: Keep enabled
HTF Timeframe
→ Purpose: Which higher timeframe to check
→ Default: Auto (blank field)
→ Auto selection:
• 1m chart → 5m HTF
• 5m chart → 15m HTF
• 15m chart → 1H HTF
• 1H chart → 4H HTF
• 4H+ chart → Daily HTF
→ Manual override: Enter any timeframe (e.g., "60" for 1-hour)
Volume Confirmation
→ Purpose: Requires above-average volume for signals
→ Default: ON
→ Impact: Filters low-liquidity false signals
→ Recommended: Keep enabled
Minimum Volume Ratio
→ Purpose: Volume threshold vs. 20-bar average
→ Range: 0.3 to 2.0
→ Default: 0.8 (80% of average)
→ When to adjust:
• Increase to 1.2-1.5 for only high-volume signals
• Decrease to 0.5-0.7 for more permissive filtering
Structure Clearance Check
→ Purpose: Ensures clear path to targets (no nearby resistance/support)
→ Default: ON
→ Impact: Prevents trades with immediate obstacles
→ Recommended: Keep enabled
Minimum Bars Between Signals
→ Purpose: Cooldown period after each signal
→ Range: 1 to 10
→ Default: 3
→ Impact: After a signal, this many bars must pass before another in same direction
→ When to adjust:
• Increase to 5-7 to prevent over-trading
• Decrease to 1-2 for faster re-entries
ADVANCED TUNING:
Momentum Period
→ Purpose: Base period for Kinetic Pulse calculation
→ Range: 5 to 30
→ Default: 14
→ When to adjust:
• Lower (8-10): More responsive, noisier
• Higher (18-21): Smoother, slower to react
→ Note: If Adaptive Period enabled, this is adjusted automatically
Adaptive Period
→ Purpose: Auto-adjusts momentum period based on volatility
→ Default: ON
→ Impact: Shortens period in high volatility, lengthens in low volatility
→ Recommended: Keep enabled for automatic optimization
Divergence Lookback
→ Purpose: How far back to search for divergence patterns
→ Range: 10 to 60
→ Default: 30
→ When to adjust:
• Shorter (15-20): Only recent divergences
• Longer (40-50): Catches older divergences (may be less relevant)
Swing Detection Bars
→ Purpose: Bars required on each side to confirm swing high/low
→ Range: 2 to 7
→ Default: 3
→ Impact on stops:
• Lower (2-3): More swing points, potentially tighter stops
• Higher (5-7): Only major swings, wider stops
Choppiness Index Threshold
→ Purpose: Threshold above which market considered choppy
→ Range: 38.2 to 80.0
→ Default: 61.8
→ Impact:
• Lower (50-55): Stricter quality filter (fewer signals in ranging markets)
• Higher (65-70): More permissive (allows signals in choppier conditions)
HOW TO READ SIGNALS
SIGNAL ANATOMY:
When a signal appears, you'll see:
1. DIRECTIONAL MARKER
→ Arrow, dot, or diamond pointing to entry candle (depends on style)
→ Positioned below price for LONG, above price for SHORT
→ Connected to price with line (Premium style)
2. GRADE BADGE
→ Displays signal quality: LONG , SHORT , etc.
→ Color coding:
• Bright green/cyan for A+ longs
• Standard green for A/B longs
• Bright pink/magenta for A+ shorts
• Standard red for A/B shorts
3. ENTRY PRICE (Premium style only)
→ Shows exact entry price at signal generation
4. TOOLTIP (all styles)
→ Hover over signal to see complete trade plan
→ Includes: Entry, Stop, TP1, TP2, Risk, R:R ratios, market conditions, signal reason, confluence score
INTERPRETING GRADES:
→ A+ SIGNALS (Highest Quality)
• 8-12+ confirming factors aligned
• Multiple divergences OR strong momentum reversal
• HTF alignment + volume + session timing + clear structure
• These are your highest-probability setups
• Recommended action: Give these priority, consider larger position size
→ A SIGNALS (High Quality)
• 5-9+ confirming factors aligned
• Good confluence, most key factors present
• Missing 1-2 optimal conditions
• These are still quality trades
• Recommended action: Standard position size, solid setups
→ B SIGNALS (Moderate Quality)
• 3-7+ confirming factors aligned
• Minimum viable confluence
• May be missing HTF alignment, volume, or session timing
• Higher variance outcomes
• Recommended action: Smaller position size or skip if conservative
SIGNAL NARRATIVE:
Each signal tooltip includes a narrative explaining WHY it was generated:
→ "Multi-divergence at oversold extreme"
• Multiple oscillators showing bullish divergence
• Kinetic Pulse in oversold zone
• High-quality reversal setup
→ "Bullish divergence near support"
• Divergence detected
• Price near key support level (swing low or PDL)
• Structure confluence
→ "Momentum reversal with HTF alignment"
• Kinetic Pulse velocity reversing
• Higher timeframe supports direction
• Strong trend-following setup
→ "Oversold momentum reversal"
• Extreme Kinetic Pulse reading reversing
• May not have divergence but strong momentum shift
READING THE TRADE PLAN:
Every signal comes with a complete trade plan:
→ ENTRY: The close price of the signal candle
• This is where the signal triggered
• If using limit orders, you might improve on this price
→ STOP: Calculated stop loss level
• Based on your Stop Loss Method setting
• Distance shown in ticks
• Risk tolerance: Ensure this represents ≤1-2% of your account
→ TP1: First profit target
• Default: 1:1 risk-reward
• This is your partial profit or first exit
• Consider taking 50% off at TP1
→ TP2: Second profit target
• Default: 1:2 risk-reward
• This is your "full win" target
• Hold remaining position for this level
SIGNAL FREQUENCY EXPECTATIONS:
Frequency varies by timeframe, sensitivity, and market conditions:
→ AGGRESSIVE MODE
• Lower timeframes (1m-5m): 5-15 signals per day
• Mid timeframes (15m-1H): 2-5 signals per day
• Higher timeframes (4H-D): 1-3 signals per week
→ BALANCED MODE (Default)
• Lower timeframes: 3-8 signals per day
• Mid timeframes: 1-3 signals per day
• Higher timeframes: 2-5 signals per week
→ CONSERVATIVE MODE
• Lower timeframes: 1-4 signals per day
• Mid timeframes: 0-2 signals per day
• Higher timeframes: 1-3 signals per week
Note: Frequency also depends on market volatility and trending vs. ranging conditions.
Example - Kinetic Scalper Trade Sequence
Here's an example showing the complete trade lifecycle with all dashboard transitions, annotations, and descriptions.
INSTRUMENT & TIMEFRAME DETAILS
Symbol: Nifty 50 Index (NSE)
Date: December 15, 2025
Session: London session (active trading hours)
Instrument Type: Index (auto-detected)
TRADE SEQUENCE BREAKDOWN
SCREENSHOT 1: Pre-Signal Setup Building (Image 1)
Time: ~12:00-14:30 UTC+5:30(approx.)
Price Action: Uptrend showing signs of exhaustion near 26,200
Market State: Price at session highs
Main Dashboard (Top Right):
- Bias: LEAN SHORT
- Pulse: 58.9 (approaching overbought)
- Volatility: NORMAL
- Trend: TRANSITIONING
- Session: LONDON (favorable timing)
- Volume: 0.98x (slightly below average)
- HTF: BULLISH (caution for counter-trend)
- Best Score: 9/5 (Short score building)
- PDH/PDL: 26098.25 / 25938.95
Trade Analysis Panel (Bottom Left):
- Status: NO ACTIVE TRADE
- Long Score: 5/5 (RDY)
- Short Score: 9/5 (RDY)
- Panel Message: "Short pattern developing - score: 9"
Description :
Setup Development Phase: The indicator identifies a potential short opportunity as price reaches the previous day's high. The short confluence score has climbed to 9/15 points, meeting the 'Balanced' sensitivity threshold for a Grade B signal. Notice the 'LEAN SHORT' bias and the Kinetic Pulse reading of 58.9 approaching overbought territory. The Trade Analysis panel shows 'Short pattern developing' with 9/5 factors aligned. Key factors: momentum approaching reversal zone, price at resistance (PDH), and London session providing favorable conditions.
SCREENSHOT 2: Signal Generated & Trade Entered (Image 2)
Time: ~13:00 UTC+5:30 (signal bar)
Entry Price: 26,184.65
Signal Grade: Grade
Main Dashboard (Top Right):
- Trade: SHORT
- Entry: 26184.65
- P/L: 5.95 pts | +0.2R (early positive movement)
- TP1: 26157.00 (33.2 pts away)
- TP2: 26129.35 (60.84 pts away)
- Stop: 26212.30 (22.1 pts away)
- Bars: 1 (just entered)
Trade Analysis Panel (Bottom Left):
- Header: TRADE ANALYSIS
- Status Bar: "Conditions mixed - improving 57%"
- Confidence: 57% RISING
- Factor Breakdown:
- Momentum: -4 (velocity not yet aligned)
- Position: +4 (slight profit)
- Volume: +2 = (volume present)
- HTF Align: +2 = (not strongly aligned)
- Target: +0 - (far from TP)
- Stop Dist: +3 - (good distance)
- Bottom Status: "Conditions mixed - Monitoring"
- Disclaimer: "Analysis only - Not financial advice"
Description:
Signal Activation: A Grade A short signal triggers at 26,184.65 after the short confluence score reached qualifying levels. The indicator places a structure-based stop loss at 26,212.30 (27.65 points risk) with dual targets at 1:1 and 1:2 risk-reward ratios.
The Trade Analysis Panel immediately begins monitoring with an initial confidence score of 57% - classified as 'MIXED SIGNALS' but showing a 'RISING' trend. Factor analysis reveals: momentum not yet aligned (-4 points as price just reversed), position slightly favorable (+4 points already +0.2R), volume adequate (+2), HTF showing weak alignment (+2 as we're counter-trend), stop well-placed (+3), but targets still distant (0 points).
Notice how the Main Dashboard switches from market scanning mode to active trade tracking, now displaying entry price, live P/L in both points (5.95 pts) and R-multiples (+0.2R), and distances to all key levels. The analysis panel provides real-time factor scoring to help monitor trade health.
SCREENSHOT 3: TP1 Hit - Trade Performing Well (Image 3)
Time: ~14:20 UTC+5:30(approx)
Price: ~26,154 (TP1 zone)
Bars in Trade: 29
Main Dashboard (Top Right):
- Trade: SHORT
- Entry: 26184.65
- P/L: 30.85 pts | +1.12R (excellent progress)
- TP1: HIT (displayed in green)
- TP2: 26129.35 (24.44 pts away)
- Stop: 26212.30 (58.5 pts away - well protected)
- Bars: 29
Trade Analysis Panel (Bottom Left):
- Header: TRADE ANALYSIS
- Status Bar: "Multiple factors positive"
- Confidence: 78% RISING
- Factor Breakdown:
- Momentum: +8 = (ALIGNED)
- Position: +8 + (strong profit zone)
- Volume: +2 + (continued support)
- HTF Align: +8 = (now strongly aligned)
- Target: +10 + (TP1 achieved, approaching TP2)
- Stop Dist: +3 + (excellent cushion)
- Bottom Status: "Multiple factors positive"
- Visual State: Green background (FACTORS ALIGNED state)
Description:
Trade Execution Phase - First Target Achieved: After 29 bars , price reaches the first take-profit target at 26,157.00. The ' ' marker confirms partial profit taking. Current P/L shows +30.85 points (+1.12R), exceeding the initial 1:1 risk-reward.
The Trade Analysis Panel shows dramatic improvement - confidence has surged to 78% (FACTORS ALIGNED state) with most factors now positive:
- Momentum factor improved to +8 (velocity aligned with trade direction)
- Position factor at +8 (over +1R profit zone)
- HTF Align jumped to +8 (higher timeframe now confirming the move)
- Target factor maxed at +10 (TP1 achieved, TP2 within reach)
- Stop Distance at +3 (58.5 points cushion providing safety)
Notice the panel status displays 'Multiple factors positive' with a green-tinted background, indicating optimal trade conditions. The confidence trend shows 'RISING' suggesting continued momentum. With TP1 secured and only 24.44 points to TP2, the trade is well-positioned for a full 1:2R win.
SCREENSHOT 4: TP2 Reached - Trade Complete (Image 4)
Time: ~15:00+ UTC+5:30
Final Exit: 26,129.35 (TP2)
Final Result: Full TP2 win
Main Dashboard (Top Right):
- Bias: NEUTRAL (reverted to scanning mode)
- Pulse: 45.2 (returned to neutral zone)
- Volatility: NORMAL
- Trend: TREND DOWN (confirmed the move)
- Session: LONDON
- Volume: 1.26x (increased as move developed)
- HTF: BEARISH (fully aligned post-trade)
- Best Score: 5/5 (neutral after completion)
Trade Analysis Panel (Bottom Left):
- Status: NO ACTIVE TRADE (reverted)
- Long Score: 5/5 (RDY)
- Short Score: 5/5 (RDY)
- Panel Message: "Scanning - prime session active"
- Light blue/cyan background (back to scanning mode)
Description:
Trade Completion - Full Target Achieved: The short trade reaches its second take-profit target at 26,129.35, securing a complete 1:2 risk-reward win. The ' ' marker confirms the exit. Final results:
- Entry: 26,184.65
- Exit: 26,129.35
- Profit: 55.30 points (approximately +2.0R)
- Outcome: Full TP2 success
Post-Trade Analysis: After trade closure, the indicator automatically returns to market scanning mode. The Main Dashboard reverts to showing market conditions rather than trade metrics. Notice how the 'Trend' now displays 'TREND DOWN' - confirming the move we captured. Volume increased to 1.26x during the winning move, validating the signal quality.
The Trade Analysis Panel switches back to 'NO ACTIVE TRADE' status and resumes displaying long/short setup scores. The confidence-based factor monitoring was instrumental throughout the trade:
- Initial entry at 57% confidence (MIXED SIGNALS)
- Peak confidence of 78% at TP1 (FACTORS ALIGNED)
- Real-time factor updates helped confirm trade validity
This example demonstrates the indicator's complete workflow: setup identification → signal generation → entry execution → live trade monitoring → systematic exit at targets.
KEY FEATURES DEMONSTRATED
1. Dual Dashboard System
- Main Dashboard: Market conditions (scanning) → Trade metrics (active position)
- Analysis Panel: Setup scores (scanning) → Factor-based confidence (in-trade)
2. Visual Trade Management
- Color-coded entry zones (yellow)
- Risk levels clearly marked (red dashed stop)
- Profit targets with R:R ratios labeled
- Achievement markers ( , )
3. Real-Time Factor Analysis
- 6-factor scoring system (Momentum, Position, Volume, HTF, Target, Stop Dist)
- Confidence percentage with trend indicators
- State machine (MIXED → FACTORS ALIGNED)
- Hysteresis prevents false state changes
4. Risk Management
- Structure-based stop placement (respects swing highs)
- Multiple take-profit levels (1:1 and 1:2 R:R)
- Live P/L tracking in points and R-multiples
- Distance monitoring to all key levels
This complete example showcases the indicator's progression from setup identification through trade completion, demonstrating how the dual-dashboard system and factor-based analysis provide continuous trade guidance. The structured stop-loss and dual-target approach delivered the planned 1:2 risk-reward ratio with systematic, rule-based execution.
ALERT SYSTEM
The indicator includes 9 built-in alert conditions:
SIGNAL ALERTS:
→ High-Grade Long Signal (A+)
• Triggers only on A+ long signals
• For traders who want only the highest-quality longs
• Message: "KINETIC SCALPER: LONG @ "
→ High-Grade Short Signal (A+)
• Triggers only on A+ short signals
• For traders who want only the highest-quality shorts
• Message: "KINETIC SCALPER: SHORT @ "
→ Long Signal
• Triggers on ANY qualified long signal (A+, A, or B)
• For traders who want all long opportunities
• Message: "KINETIC SCALPER: LONG @ "
→ Short Signal
• Triggers on ANY qualified short signal
• For traders who want all short opportunities
• Message: "KINETIC SCALPER: SHORT @ "
TRADE MANAGEMENT ALERTS:
→ TP1 Hit
• Triggers when first profit target is reached
• Useful for partial profit taking notifications
• Message: "KINETIC SCALPER: TP1 REACHED"
→ TP2 Reached
• Triggers when second profit target is reached
• Trade is complete, full win achieved
• Message: "KINETIC SCALPER: TP2 REACHED"
→ Stop Loss Hit
• Triggers when stop loss is reached
• Important for trade management and risk tracking
• Message: "KINETIC SCALPER: STOP LOSS"
ANALYSIS STATE ALERTS:
→ Analysis State: Negative Bias
• Triggers when factor analysis enters "Negative Bias" state
• Warning that trade conditions are deteriorating
• Consider reducing position or preparing to exit
• Message: "KINETIC SCALPER: Analysis state changed to NEGATIVE BIAS"
→ Analysis State: Factors Weakening
• Triggers when factor analysis enters "Factors Weakening" state
• Caution that confluence is diminishing
• Monitor trade closely
• Message: "KINETIC SCALPER: Analysis state changed to FACTORS WEAKENING"
HOW TO SET UP ALERTS:
1. Click the "Create Alert" button in TradingView
2. Condition: Select "Kinetic Scalper "
3. Choose your desired alert from the dropdown
4. Configure your alert options:
→ Once Per Bar Close (recommended for non-repainting)
→ Frequency: Once Per Bar Close or Only Once
5. Set expiration and notification methods (popup, email, webhook, etc.)
6. Create alert
RECOMMENDED ALERT STRATEGY:
For active traders:
→ Set "Long Signal" and "Short Signal" alerts for all opportunities
→ Set "TP1 Hit", "TP2 Reached", and "Stop Loss Hit" for trade management
→ Consider "Analysis State: Negative Bias" for trade monitoring
For selective traders:
→ Set only "High-Grade Long Signal (A+)" and "High-Grade Short Signal (A+)"
→ Focus on the absolute highest-quality setups
→ Set TP/SL alerts for position management
USAGE TIPS & BEST PRACTICES
SIGNAL SELECTION:
✓ GRADE MATTERS
→ A+ signals have statistically more confluence factors
→ If you're conservative, trade only A+ signals
→ B signals can work but require more discretion
✓ CONFLUENCE WITH YOUR ANALYSIS
→ Use this indicator as CONFIRMATION, not sole decision criteria
→ Combine with your own support/resistance analysis
→ Check for fundamental events (news, economic data)
→ Respect major round numbers and psychological levels
✓ SESSION TIMING (Forex)
→ Best signals often occur during London/NY overlap
→ Avoid signals 10 minutes before major news releases
→ Asian session signals can be valid but lower liquidity
✓ TIMEFRAME CONFLUENCE
→ If you get an A+ signal on 15m, check if 1H chart agrees
→ Higher timeframe confirmation adds conviction
→ Avoid signals that oppose the daily/4H trend
TRADE MANAGEMENT:
✓ POSITION SIZING
→ ALWAYS size positions so stop loss = 1-2% of account
→ Never risk more than you can afford to lose
→ Smaller position on B signals, standard on A, larger on A+ (within limits)
✓ PARTIAL PROFIT TAKING
→ Consider taking 50% off at TP1
→ Move stop to breakeven after TP1 hit
→ Let remaining position run to TP2
✓ TRAILING STOPS
→ The indicator doesn't auto-trail stops (manual decision)
→ After TP1, you might manually move stop to entry (breakeven)
→ Consider ATR-based trailing stop for runners
✓ WATCH THE ANALYSIS PANEL
→ If state changes to "Factors Weakening" while in profit, consider exit
→ "Negative Bias" during a trade is a strong warning
→ "Factors Aligned" confirms your trade thesis is still valid
RISK MANAGEMENT:
✓ NEVER IGNORE STOPS
→ The calculated stop is there for a reason
→ Moving stop further away increases risk exponentially
→ If stopped out, accept it and wait for next setup
✓ AVOID REVENGE TRADING
→ If you get stopped out, resist urge to immediately re-enter
→ Signal cooldown helps with this
→ Wait for next qualified signal
✓ RESPECT VOLATILITY WARNINGS
→ If indicator shows "EXTREME" volatility, signals are blocked for a reason
→ Don't force trades in chaotic conditions
→ Wait for regime to normalize
✓ CORRELATION RISK
→ Be aware of correlation if trading multiple pairs
→ EUR/USD and GBP/USD are highly correlated
→ Don't stack risk on correlated instruments
OPTIMIZATION:
✓ START WITH DEFAULTS
→ Default settings are well-tested
→ Don't over-optimize for recent market behavior
→ Give settings at least 20-30 trades before judging
✓ TIMEFRAME-SPECIFIC ADJUSTMENTS
→ Lower timeframes: Consider increasing Signal Distance to 3.0-4.0
→ Higher timeframes: ATR Stop Multiplier might go to 2.0-2.5
→ Crypto: Ensure Instrument Type is set to "Crypto" for proper stops
✓ SENSITIVITY CALIBRATION
→ Too many signals? Switch to Conservative
→ Missing good setups? Try Balanced or Aggressive
→ Quality > Quantity always
✓ KEEP A JOURNAL
→ Track which signal grades work best for you
→ Note which sessions produce best results
→ Review stopped trades for patterns
THINGS TO AVOID:
✗ DON'T chase signals after several bars have passed
✗ DON'T ignore the stop loss or move it further away
✗ DON'T overtrade by taking every B-grade signal
✗ DON'T trade during major news if you're not experienced
✗ DON'T use this as your only analysis tool
✗ DON'T expect 100% win rate (no indicator has this)
✗ DON'T risk more than 1-2% per trade regardless of signal grade
UNDERSTANDING THE METHODOLOGY
WHY VOLUME WEIGHTING?
Traditional momentum oscillators treat all price moves equally. A 10-point move on low volume is weighted the same as a 10-point move on high volume.
The Kinetic Pulse corrects this by:
→ Calculating volume ratio vs. 20-bar average
→ Applying square root transformation to volume ratio (prevents extreme weights)
→ Multiplying price changes by volume weight
→ Result: High-volume moves influence the oscillator more than low-volume noise
This helps filter false breakouts and emphasizes moves with participation.
WHY FISHER TRANSFORM?
Fisher Transform is a mathematical transformation that:
→ Normalizes probability distributions
→ Creates sharper turning points
→ Amplifies extremes while compressing the middle
→ Makes overbought/oversold levels more distinct
Applied to the Kinetic Pulse, it helps identify genuine extremes vs. noise.
WHY MULTI-OSCILLATOR DIVERGENCE?
Single-source divergence can give false signals. By requiring divergence confirmation across multiple oscillators (Kinetic Pulse, CCI, Stochastic), the system filters out:
→ Divergences caused by calculation quirks in one oscillator
→ Temporary momentum anomalies
→ False divergence on noisy, low-timeframe charts
Multiple sources confirming the same pattern increases reliability.
WHY ADAPTIVE PERIODS?
Fixed periods can be:
→ Too slow during high volatility (miss fast reversals)
→ Too fast during low volatility (generate noise)
The adaptive system:
→ Shortens period when ATR ratio > 1.3 (high volatility = need faster response)
→ Lengthens period when ATR ratio < 0.7 (low volatility = need noise filtering)
→ Keeps period in reasonable range (60% to 140% of base period)
→ Result: Oscillator adjusts to current market pace automatically
WHY HYSTERESIS IN STATE MACHINE?
Without hysteresis, the analysis state would flip-flop on every bar, creating:
→ Confusing, contradictory guidance
→ Analysis paralysis
→ Lack of actionable information
Hysteresis solves this by:
→ Using different thresholds to ENTER vs. EXIT a state
→ Example: Enter "Factors Aligned" at 72+ confidence, but don't exit until <62
→ This creates stable states that persist through minor fluctuations
→ Requires minimum commitment period (3 bars) before state changes
→ Overrides commitment for significant events (near TP/SL)
→ Result: Stable, trustworthy analysis that changes only when truly warranted
WHY CONFIDENCE SMOOTHING?
Raw factor scores fluctuate bar-by-bar based on momentary conditions. Smoothing:
→ Uses 5-period EMA on raw confidence scores
→ Filters out single-bar anomalies
→ Preserves genuine trends in confidence
→ Prevents false state transitions
→ Result: More reliable assessment of actual trade health
WHY INSTRUMENT-SPECIFIC PARAMETERS?
Different instruments have different characteristics:
→ Forex is highly liquid, respects technical levels well, standard ATR works
→ Crypto is extremely volatile, needs wider stops (1.8x) to avoid false stops
→ Indices respect session opens strongly, session weighting is important
→ Commodities fall in between
Auto-detection applies research-based multipliers automatically.
WHY STRUCTURE-BASED STOPS?
ATR-based stops can:
→ Place stop in middle of consolidation (easily hit)
→ Ignore obvious invalidation levels
→ Be too tight during expansion or too wide during contraction
Structure-based stops:
→ Use actual swing highs/lows (where traders actually place stops)
→ Add small ATR buffer to avoid stop hunting
→ Constrain within min/max ATR limits for safety
→ Result: Stops that respect market geometry while managing risk
DISCLAIMER & RISK WARNING
READ THIS CAREFULLY BEFORE USING THIS INDICATOR
This indicator is provided for EDUCATIONAL and INFORMATIONAL purposes only.
❌ NOT FINANCIAL ADVICE
This indicator does NOT constitute financial advice, investment recommendations, or solicitation to buy or sell any financial instrument. All information is for educational purposes only.
❌ NO GUARANTEES
→ Past performance does NOT guarantee future results
→ No indicator can predict future price movements with certainty
→ Signal grades represent confluence, NOT win probability
→ A+ signals can lose, B signals can win - markets are probabilistic
❌ SUBSTANTIAL RISK
Trading financial instruments involves SUBSTANTIAL RISK of loss:
→ You can lose your entire investment
→ Leveraged trading amplifies both gains AND losses
→ Never trade with money you cannot afford to lose
→ Never risk more than 1-2% of your account per trade
❌ YOUR RESPONSIBILITY
→ All trading decisions are YOUR responsibility
→ You must conduct your own analysis before entering trades
→ Consult a licensed financial advisor before trading
→ Understand the risks specific to your jurisdiction and situation
→ Only trade with capital you can afford to lose completely
❌ NO HOLY GRAIL
→ This indicator is a TOOL, not a complete trading system
→ It should be used as part of a broader analysis framework
→ Combine with your own technical analysis, risk management, and judgment
→ No indicator works 100% of the time in all market conditions
❌ ANALYSIS PANEL DISCLAIMER
The "Trade Analysis Panel" provides ALGORITHMIC ANALYSIS of market factors.
→ It does NOT provide investment advice or recommendations
→ Factor scores are mathematical calculations, not predictions
→ Guidance messages are informational, not directives
→ All trading decisions remain your responsibility
❌ BACKTESTING LIMITATIONS
→ This is an indicator, not a strategy, so no backtesting results are provided
→ Any backtesting you perform includes hindsight bias and optimization bias
→ Historical performance does not indicate future performance
→ Slippage, commissions, and real-world execution differ from backtests
❌ MARKET CONDITIONS
→ This indicator performs differently in trending vs. ranging markets
→ Extreme volatility can produce false signals or whipsaws
→ Low liquidity periods increase execution risk
→ Major news events can invalidate technical analysis
BY USING THIS INDICATOR, YOU ACKNOWLEDGE:
→ You have read and understood this disclaimer
→ You accept full responsibility for your trading decisions
→ You understand the substantial risks involved in trading
→ You will not hold the author liable for any losses incurred
→ You are using this tool as part of your own due diligence process
KEY FEATURES SUMMARY
✅ Volume-Weighted Kinetic Pulse Engine (proprietary momentum calculation)
✅ 15-Factor Confluence Scoring System (graded signals: A+, A, B)
✅ Multi-Oscillator Divergence Detection (Pulse + CCI + Stochastic)
✅ Higher Timeframe Trend Alignment Filter
✅ Adaptive Period Adjustment (volatility-responsive)
✅ Instrument-Aware Calibration (Forex, Crypto, Indices, Commodities)
✅ Structure-Based Stop Loss Calculation (respects swing highs/lows)
✅ Automated Trade Tracking (entry, stop, TP1, TP2, P/L)
✅ Real-Time Factor Analysis State Machine (5-state system with hysteresis)
✅ Session Awareness (Asian, London, New York, Overlap)
✅ Volatility Regime Detection (blocks signals in extreme conditions)
✅ Choppiness Filter (reduces signals in ranging markets)
✅ Volume Confirmation (relative volume and delta analysis)
✅ Clean Air Check (validates clear path to targets)
✅ Comprehensive Dashboards (market conditions + trade analysis)
✅ Customizable Display (3 signal styles, color themes, positioning)
✅ 9 Built-In Alert Conditions (signals, TP/SL hits, state changes)
✅ Fully Non-Repainting (barstate.isconfirmed, lookahead_off)
✅ Previous Day Levels (PDH/PDL reference lines)
✅ Mobile-Friendly Compact Mode (for smaller screens)
TECHNICAL SPECIFICATIONS
→ Pine Script Version: v6
→ Indicator Type: Overlay (displays on price chart)
→ License: Mozilla Public License 2.0
→ Copyright: BULLBYTE
→ Object Limits: 300 labels, 100 lines, 50 boxes
→ Memory Management: Automatic cleanup system (FIFO queue)
→ Repainting: Non-repainting (signals confirmed on bar close)
→ Timeframe Support: All timeframes (1s to Monthly)
→ Instrument Support: Forex, Crypto, Indices, Commodities, Stocks
→ HTF Data Handling: lookahead_off with historical offset
VERSION HISTORY
v1.0 - Initial Release
→ Kinetic Pulse engine with volume weighting and Fisher Transform
→ 15-factor confluence scoring system
→ Trade analysis state machine with hysteresis
→ Automated trade tracking and monitoring
→ Dual dashboard system (market conditions + factor analysis)
→ 9 alert conditions
→ 3 signal display styles
→ Instrument-aware calibration
→ Full risk management framework
WHO IS THIS INDICATOR FOR?
IDEAL FOR:
✓ Scalpers and day traders seeking high-confluence reversal entries
✓ Swing traders who want quality over quantity
✓ Traders who appreciate systematic, rules-based analysis
✓ Multi-timeframe traders who value HTF confirmation
✓ Forex traders who respect session timing
✓ Crypto traders needing volatility-adjusted parameters
✓ Traders who want complete trade management (entry, stop, targets)
✓ Analytical traders who want transparency in signal generation
NOT IDEAL FOR:
✗ Traders seeking a "set and forget" holy grail system
✗ Traders who don't want to learn the methodology
✗ Traders unwilling to accept losing trades as part of the process
✗ Traders who need constant signals (this is a quality-focused system)
✗ Traders who ignore risk management
FINAL THOUGHTS
The Kinetic Scalper is the result of extensive research into momentum behavior, volume confirmation, and multi-factor confluence analysis. It's designed to identify high-probability reversal setups while maintaining strict risk management and providing complete transparency.
This is NOT a magic solution. It's a sophisticated TOOL that requires:
→ Understanding of the methodology
→ Proper risk management discipline
→ Patience to wait for quality setups
→ Willingness to accept losses as part of trading
→ Integration with your own analysis and judgment
Used properly as part of a complete trading plan, the Kinetic Scalper can help you identify high-confluence opportunities and manage trades systematically.
Remember: Quality over quantity. Discipline over emotion. Risk management over everything.
Trade smart. Trade safe.
© 2025 BULLBYTE | Kinetic Scalper v1.0 | For Educational Purposes Only

VR Volume Ratio + Divergence (Pro)成交量比率 (Volume Ratio, VR) 是一項通過分析股價上漲與下跌日的成交量,來研判市場資金氣氛的技術指標。本腳本基於傳統 VR 公式進行了優化,增加了**「趨勢變色」與「自動背離偵測」**功能,幫助交易者更精準地捕捉量價轉折點。
Introduction
Volume Ratio (VR) is a technical indicator that measures the strength of a trend by comparing the volume on up-days versus down-days. This script enhances the classic VR formula with "Trend Color Coding" and "Auto-Divergence Detection", helping traders identify volume-price reversals more accurately.
核心功能與參數
公式原理: VR = (Qu + Qf/2) / (Qd + Qf/2) * 100
Qu: 上漲日成交量 (Up volume)
Qd: 下跌日成交量 (Down volume)
Qf: 平盤日成交量 (Flat volume)
參數 (Length):預設為 26 日,這是市場公認最有效的短中線參數。
關鍵水位線 (Key Levels):
< 40% (底部區):量縮極致,市場情緒冰點,常對應股價底部,適合尋找買點。
100% (中軸):多空分界線。
> 260% (多頭警戒):進入強勢多頭行情,但需注意過熱。
> 450% (頭部區):成交量過大,市場情緒亢奮,通常為頭部訊號。
視覺優化 (Visuals):
紅漲綠跌:當 VR 數值大於前一日顯示為紅色(動能增強);小於前一日顯示為綠色(動能退潮)。
背離訊號 (Divergence):自動標記量價背離。
▲ 底背離 (Bullish):股價創新低,但 VR 指標墊高(主力吸籌)。
▼ 頂背離 (Bearish):股價創新高,但 VR 指標走弱(買氣衰竭)。
Features & Settings
Formula Logic: Calculated as VR = (Qu + Qf/2) / (Qd + Qf/2) * 100.
Default Length: 26, widely regarded as the optimal setting for short-to-medium term analysis.
Key Zones:
< 40% (Oversold/Bottom): Extreme low volume, often indicating a market bottom and potential buying opportunity.
100% (Neutral): The balance point between bulls and bears.
> 260% (Bullish Zone): Strong uptrend, volume is expanding.
> 450% (Overbought/Top): Extreme high volume, often indicating a market top and potential reversal.
Visual Enhancements:
Color Coding: Line turns Red when VR rises (Momentum Up) and Green when VR falls (Momentum Down).
Divergence Signals: Automatically marks divergence points on the chart.
▲ Bullish Divergence: Price makes a lower low, but VR makes a higher low (Accumulation).
▼ Bearish Divergence: Price makes a higher high, but VR makes a lower high (Distribution).
應用策略建議
抄底策略:當 VR 跌破 40% 後,指標線由綠翻紅,或出現「▲底背離」訊號時,為極佳的波段進場點。
逃頂策略:當 VR 衝過 450% 進入高檔區,一旦指標線由紅翻綠,或出現「▼頂背離」訊號時,建議分批獲利了結。
Strategy Guide
Bottom Fishing: Look for entries when VR drops below 40% and turns red, or when a "▲ Bullish Divergence" label appears.
Taking Profit: Consider selling when VR exceeds 450% and turns green, or when a "▼ Bearish Divergence" label appears.
Disclaimer: This tool is for informational purposes only and does not constitute financial advice. / 本腳本僅供參考,不構成投資建議。

Trading Module [BackQuant]Trading Module
A modular overlay that lets you combine three core components, a Trend Model, an Impulse Model, and an optional Stop Loss framework, then layer in a multi-symbol RSI screener plus a full price action toolkit (market structure, FVGs, order blocks, volumetric S/R). Built for discretionary execution and study, not for blind automation.
────────────────────────────────────────────────────────────
What this script is
This indicator is designed like a “module picker”. Instead of forcing one opinionated system, it gives you selectable models that can be combined into a workflow:
1) Trend Model , answers “what side is the market biased to?”
2) Impulse Model , answers “is there currently expansion, pressure, or a momentum event worth paying attention to?”
3) Stop Loss Layer , answers “where are reasonable invalidation zones if I’m managing risk manually?”
4) RSI Screener , answers “what are my watchlist assets doing right now, on multiple timeframes, in one place?”
5) Price Action Concepts , answers “what structure levels, imbalances, institutional zones, and volume-based levels matter?”
You can run it as a lightweight overlay (trend + impulse only), or turn on the heavier price action stack when you want deeper context.
────────────────────────────────────────────────────────────
How to use it, the intended workflow
Step 1, pick your Trend Model
The trend model is your baseline directional filter. It is meant to reduce “random trading” by keeping you aligned with the dominant structure or momentum bias.
Trend Models (examples)
Typical usage:
- If the trend model reads bullish, you focus on long setups and avoid shorting into strength.
- If the trend model reads bearish, you focus on short setups and avoid catching bottoms.
- If the trend model is neutral or mixed, you reduce size or wait for confirmation.
What you can expect from the options (without exposing internal weighting or thresholds):
- Universal Trend+ , a composite trend regime model that blends multiple families of trend evidence. It is designed to be more robust than a single indicator and reduce “one-indicator failure modes”.
- EMA Cross , a classic fast vs slow trend bias. Simple, responsive, but can whipsaw in ranges.
- DEMA ATR , a smoother trend anchor that adapts to volatility. Often cleaner in chop than basic crosses.
- Relative Strength Overlay , a strength scoring style bias built from an RSI-style internal scoring process. Useful when you want “strength state” more than “moving average state”.
Color conventions:
- Long color and short color are user-defined, so you can keep consistent visuals across your BackQuant suite.
Step 2, pick your Impulse Model
Impulse is separate from trend on purpose. Trend answers direction, impulse answers timing. A market can be trending but not currently impulsing, or impulsing in a counter-trend squeeze.
Impulse Models (examples)
How to use impulse signals:
- Treat impulse as “permission” to engage, not as a standalone trade trigger.
- Best pairing is trend aligned impulse, meaning bullish trend model plus bullish impulse, bearish plus bearish.
- Counter-trend impulses can be used as warning signals, take-profit cues, or short-lived mean reversion opportunities, depending on your style.
The impulse options in this module are built around pressure and expansion detection. They are meant to identify moments where conditions shift from “noise” to “initiative activity”.
Step 3, choose a Stop Loss framework
This script includes optional stop visualization modes. These are not meant to be blindly used as a “one true stop”, they are tools for structuring invalidation around volatility or defined percentage bands.
Stop Loss (examples)
Stop loss options:
- None , no overlay.
- Dynamic , a volatility-aware band. Useful when you want stops to widen in high vol and tighten in low vol.
- Fixed , preset percentage bands. Useful for quick structure around risk units, scaling, or rule-based journaling.
- Bar-to-Bar , a micro-structure invalidation reference that uses the prior bar as a risk anchor. Useful for very tight management and fast invalidation.
How to apply them properly:
- Stops should be placed where the trade idea is wrong, not where you “feel pain”.
- A volatility stop is usually an environment stop, while a fixed stop is usually a plan stop.
- If you use impulses for entries, your stop should account for impulse volatility, otherwise you get stopped on the exact move you’re trying to capture.
────────────────────────────────────────────────────────────
RSI Screener module
This module is built for scanning multiple symbols and timeframes from one chart, without switching tabs.
RSI Screener (example)
What it does:
- Lets you define up to 10 symbols (defaults to major crypto pairs).
- Each slot can have its own timeframe.
- Computes an RSI value per symbol and assigns a directional state relative to a midline threshold.
- Displays a stacked overlay readout using a monospace label style for quick scanning.
How to use it:
- Set slots 1–5 as your majors, 6–10 as your rotation candidates.
- Use higher timeframes for regime, lower timeframes for timing.
- Use the midline threshold as a “trend bias” line, not an overbought or oversold line.
- Treat the screener as context, not a signal. Your chart model and price action still decide the trade.
Performance note:
- Screeners are heavy by nature because each symbol is a security() request. Keep the number of enabled slots reasonable if you are on lower-end hardware or running many scripts.
────────────────────────────────────────────────────────────
Price Action Concepts and Market Structure stack
This script includes a full price action toolkit intended to provide “where” context, levels, zones, and structural breaks, so the trend and impulse models are not operating in a vacuum.
Price Action Concepts / Market Structure (example)
This section is split into five major blocks:
1) Market Structure, Swing and Internal
You can enable swing structure and internal structure separately, with independent lookbacks.
- Swing structure tracks larger, slower pivots, better for macro trend structure.
- Internal structure tracks tighter pivots, better for entry timing and micro shifts.
It prints structure events as:
- BOS (Break of Structure), continuation-style break.
- MSB (Market Structure Break), shift-style break. Some traders call this CHoCH, here it’s presented as an MSB concept.
Usage:
- Swing BOS is good for confirming a larger regime.
- Internal structure is good for timing entries within the swing context.
- If internal flips but swing does not, treat it as a warning, not necessarily a full reversal.
2) Fair Value Gaps (FVG)
Optional imbalance boxes that highlight displacement zones.
Key controls:
- Timeframe selection (or current timeframe).
- How many to keep on chart.
- How far to extend them right.
Usage:
- FVGs are best treated as “areas of interest”, not guaranteed support/resistance.
- They help you frame where price might rebalance after an impulse event.
3) Order Blocks (OB)
Optional institutional-style zones detected from structure and candle logic, with filters.
Key controls:
- Fractal type (3 or 5) changes how “strict” structure detection is.
- Break method (close vs high/low) changes confirmation strictness.
- Optional filter with FVG distance to reduce low-quality blocks.
- Extend, delete-when-filled, and label options for chart hygiene.
Usage:
- OBs are strongest when aligned with swing context and confirmed by volume or displacement.
- Filled blocks are informational, they can be removed to reduce clutter.
4) Volumetric Support and Resistance
This module creates support and resistance “zones” based on high-volume pivot events, then manages them over time.
Key controls:
- Detection sensitivity, volume multiplier, and lookback period.
- Minimum distance between zones to avoid stacking duplicates.
- Remove broken, extend, and volume display toggles.
How to interpret:
- Levels are thicker zones, not single price lines.
- “Touches” are tracked as an interaction count, useful for identifying repeatedly defended or attacked zones.
- High-volume zones are visually emphasized, these tend to matter more than low volume pivots.
Usage:
- Pair volumetric levels with impulse signals, an impulse into a high-volume resistance zone is not the same as an impulse in open space.
- Use volumetric levels as structure anchors for invalidation and targets.
5) Alerts
The price action stack includes alerts for new levels, touches, breaks, and order block creation or interaction.
Use alerts for:
- Watchlist management, you get notified when price hits an area.
- Avoiding screen-watching, especially when you run multi-timeframe setups.
────────────────────────────────────────────────────────────
Core philosophy of the module
This indicator is not “one model to rule them all”. It is meant to let you build a trading process:
- Trend decides bias.
- Impulse decides engagement timing.
- Price action decides location and structure.
- Stops decide risk containment.
- Screener decides where to look.
If you only use one layer, you are throwing away most of the edge this style of framework is designed to create. The strength is in confluence and filtering.
────────────────────────────────────────────────────────────
Suggested presets
Preset A, clean trend-following overlay
- Trend Model, Universal Trend+ or DEMA ATR
- Impulse Model, either option
- Stop Loss, Dynamic
- Price action modules off (structure off, FVG off, OB off, volumetric off)
- Screener on (high timeframe)
Preset B, execution and structure mode
- Trend Model on
- Impulse Model on
- Market Structure on (swing + internal)
- FVG on (current timeframe or one higher)
- Order Blocks on with FVG filter
- Volumetric S/R on
- Stop Loss, Dynamic or Bar-to-Bar depending on speed
Preset C, watchlist scanner mode
- Screener on
- Minimal chart overlays on
- Use alerts for touches and breaks
- Only open charts that show alignment across trend and impulse
────────────────────────────────────────────────────────────
Notes and limitations
- This is a heavy script when multiple modules are enabled, because it draws objects and can request multiple symbols.
- The models are designed to be modular, so not every combination will be optimal for every market or timeframe.
────────────────────────────────────────────────────────────
Quick input map
Main Settings/Models
- Select Trend Model
- Select Impulse Model
- Select Stop Loss
- Show Screener
- Long/Short colors
Screener Settings
- Label size and offsets
- RSI length and midline
- Up to 10 symbol slots with per-slot timeframe and enable toggle
Market Structure
- Swing and internal structure mode and lookbacks
- Bull and bear colors
Fair Value Gaps
- Enable, count, timeframe, extend, colors
Order Blocks
- Enable, labels, fractal type, break method
- FVG filter and distance
- Lookback, extend, delete-when-filled, colors
Volumetric S/R
- Sensitivity, volume multiplier, analysis window
- Level limits, distance rules, extension and cleanup rules
- Volume display preferences
────────────────────────────────────────────────────────────
End note
This is intended as a full visual decision-support module for discretionary traders who want trend, timing, structure, and watchlist scanning in one place. Use it to build a repeatable process, then validate that process with proper testing and journaling before risking real capital.

COT Index by thedatalayers.comThe COT Index transforms the weekly COT net positions of Commercial traders into a normalized mathematical model.
Instead of displaying raw net positioning, the COT Index processes the data through a cyclical normalization algorithm (commonly using a 26-week or alternatively a 52-week cycle).
This makes it easier to identify bullish or bearish extremes in Commercial activity.
The index is plotted as a color-coded line:
• Green Zone - Commercials are mathematically classified as bullish.
Historically, bullish Commercial positioning often aligns with upward market pressure.
• Red Zone - Commercials are mathematically classified as bearish.
This typically corresponds with increased downward pressure in the underlying market.
• Neutral Zone - Neither bull nor bear dominance; positioning is mid-range.
Since COT data is published only once per week and the COT Index is built on cyclical multi-week analysis, the indicator is intended to be used exclusively on the weekly timeframe.
Using lower timeframes will not reflect the structure of the data accurately.
The selected cycle length (typically 26 weeks, optionally 52 weeks) determines how net positions are compared and normalized, and can influence how quickly extreme zones appear.
The COT Index provides an objective way to interpret Commercial trader sentiment and to identify potential directional bias in the market.

Market Regime# MARKET REGIME IDENTIFICATION & TRADING SYSTEM
## Complete User Guide
---
## 📋 TABLE OF CONTENTS
1. (#overview)
2. (#regimes)
3. (#indicator-usage)
4. (#entry-signals)
5. (#exit-signals)
6. (#regime-strategies)
7. (#confluence)
8. (#backtesting)
9. (#optimization)
10. (#examples)
---
## OVERVIEW
### What This System Does
This is a **complete market regime identification and trading system** that:
1. **Identifies 6 distinct market regimes** automatically
2. **Adapts trading tactics** to each regime
3. **Provides high-probability entry signals** with confluence scoring
4. **Shows optimal exit points** for each trade
5. **Can be backtested** to validate performance
### Two Components Provided
1. **Indicator** (`market_regime_indicator.pine`)
- Visual regime identification
- Entry/exit signals on chart
- Dynamic support/resistance
- Info tables with live data
- Use for manual trading
2. **Strategy** (`market_regime_strategy.pine`)
- Fully automated backtestable version
- Same logic as indicator
- Position sizing and risk management
- Performance metrics
- Use for backtesting and automation
---
## THE 6 MARKET REGIMES
### 1. 🟢 BULL TRENDING
**Characteristics:**
- Strong uptrend
- Price above SMA50 and SMA200
- ADX > 25 (strong trend)
- Higher highs and higher lows
- DI+ > DI- (bullish momentum)
**What It Means:**
- Market has clear upward direction
- Buyers in control
- Pullbacks are buying opportunities
- Strongest regime for long positions
**How to Trade:**
- ✅ **BUY dips to EMA20 or SMA20**
- ✅ Enter when RSI < 60 on pullback
- ✅ Hold through minor corrections
- ❌ Don't short against the trend
- ❌ Don't sell too early
**Expected Behavior:**
- Pullbacks are shallow (5-10%)
- Bounces are strong
- Support at moving averages holds
- Volume increases on rallies
---
### 2. 🔴 BEAR TRENDING
**Characteristics:**
- Strong downtrend
- Price below SMA50 and SMA200
- ADX > 25 (strong trend)
- Lower highs and lower lows
- DI- > DI+ (bearish momentum)
**What It Means:**
- Market has clear downward direction
- Sellers in control
- Rallies are selling opportunities
- Strongest regime for short positions
**How to Trade:**
- ✅ **SELL rallies to EMA20 or SMA20**
- ✅ Enter when RSI > 40 on bounce
- ✅ Hold through minor bounces
- ❌ Don't buy against the trend
- ❌ Don't cover shorts too early
**Expected Behavior:**
- Rallies are weak (5-10%)
- Selloffs are strong
- Resistance at moving averages holds
- Volume increases on declines
---
### 3. 🔵 BULL RANGING
**Characteristics:**
- Bullish bias but consolidating
- Price near or above SMA50
- ADX < 20 (weak trend)
- Trading in range
- Choppy price action
**What It Means:**
- Uptrend is pausing
- Accumulation phase
- Support and resistance zones clear
- Lower volatility
**How to Trade:**
- ✅ **BUY at support zone**
- ✅ Enter when RSI < 40
- ✅ Take profits at resistance
- ⚠️ Smaller position sizes
- ⚠️ Tighter stops
**Expected Behavior:**
- Range-bound oscillations
- Support bounces repeatedly
- Resistance rejections common
- Eventually breaks higher (usually)
---
### 4. 🟠 BEAR RANGING
**Characteristics:**
- Bearish bias but consolidating
- Price near or below SMA50
- ADX < 20 (weak trend)
- Trading in range
- Choppy price action
**What It Means:**
- Downtrend is pausing
- Distribution phase
- Support and resistance zones clear
- Lower volatility
**How to Trade:**
- ✅ **SELL at resistance zone**
- ✅ Enter when RSI > 60
- ✅ Take profits at support
- ⚠️ Smaller position sizes
- ⚠️ Tighter stops
**Expected Behavior:**
- Range-bound oscillations
- Resistance holds repeatedly
- Support bounces are weak
- Eventually breaks lower (usually)
---
### 5. ⚪ CONSOLIDATION
**Characteristics:**
- No clear direction
- Range compression
- Very low ADX (< 15 often)
- Price inside tight range
- Neutral sentiment
**What It Means:**
- Market is coiling
- Building energy for next move
- Indecision between buyers/sellers
- Calm before the storm
**How to Trade:**
- ✅ **WAIT for breakout direction**
- ✅ Enter on high-volume breakout
- ✅ Direction becomes clear
- ❌ Don't trade inside the range
- ❌ Avoid choppy scalping
**Expected Behavior:**
- Narrow range
- Low volume
- False breakouts possible
- Explosive move when it breaks
---
### 6. 🟣 CHAOS (High Volatility)
**Characteristics:**
- Extreme volatility
- No clear direction
- Erratic price swings
- ATR > 2x average
- Unpredictable
**What It Means:**
- Market panic or euphoria
- News-driven moves
- Emotion dominates logic
- Highest risk environment
**How to Trade:**
- ❌ **STAY OUT!**
- ❌ No positions
- ❌ Wait for stability
- ✅ Protect existing positions
- ✅ Reduce risk
**Expected Behavior:**
- Large intraday swings
- Gaps up/down
- Stop hunts
- Whipsaws
- Eventually calms down
---
## INDICATOR USAGE
### Visual Elements
#### 1. Background Colors
- **Light Green** = Bull Trending (go long)
- **Light Red** = Bear Trending (go short)
- **Light Teal** = Bull Ranging (buy dips)
- **Light Orange** = Bear Ranging (sell rallies)
- **Light Gray** = Consolidation (wait)
- **Purple** = Chaos (stay out!)
#### 2. Regime Labels
- Appear when regime changes
- Show new regime name
- Positioned at highs (bullish) or lows (bearish)
#### 3. Entry Signals
- **Green "LONG"** labels = Buy here
- **Red "SHORT"** labels = Sell here
- Number shows confluence score (X/5 signals)
- Hover for details (stop, target, RSI, etc.)
#### 4. Exit Signals
- **Orange "EXIT LONG"** = Close long position
- **Orange "EXIT SHORT"** = Close short position
- Shows exit reason in tooltip
#### 5. Support/Resistance Lines
- **Green line** = Dynamic support (buy zone)
- **Red line** = Dynamic resistance (sell zone)
- Adapts to regime automatically
#### 6. Moving Averages
- **Blue** = SMA 20 (short-term trend)
- **Orange** = SMA 50 (medium-term trend)
- **Purple** = SMA 200 (long-term trend)
### Information Tables
#### Top Right Table (Main Info)
Shows real-time market conditions:
- **Current Regime** - What regime we're in
- **Bias** - Long, Short, Breakout, or Stay Out
- **ADX** - Trend strength (>25 = strong)
- **Trend** - Strong, Moderate, or Weak
- **Volatility** - High or Normal
- **Vol Ratio** - Current vs average volatility
- **RSI** - Momentum (>70 overbought, <30 oversold)
- **vs SMA50/200** - Price position relative to MAs
- **Support/Resistance** - Exact price levels
- **Long/Short Signals** - Confluence scores (X/5)
#### Bottom Right Table (Regime Guide)
Quick reference for each regime:
- What action to take
- What strategy to use
- Color-coded for quick identification
---
## ENTRY SIGNALS EXPLAINED
### Confluence Scoring System (5 Factors)
Each entry signal is scored 0-5 based on how many factors align:
#### For LONG Entries:
1. ✅ **Regime Alignment** - In Bull Trending or Bull Ranging
2. ✅ **RSI Pullback** - RSI between 35-50 (not overbought)
3. ✅ **Near Support** - Price within 2% of dynamic support
4. ✅ **MACD Turning Up** - Momentum shifting bullish
5. ✅ **Volume Confirmation** - Above average volume
#### For SHORT Entries:
1. ✅ **Regime Alignment** - In Bear Trending or Bear Ranging
2. ✅ **RSI Rejection** - RSI between 50-65 (not oversold)
3. ✅ **Near Resistance** - Price within 2% of dynamic resistance
4. ✅ **MACD Turning Down** - Momentum shifting bearish
5. ✅ **Volume Confirmation** - Above average volume
### Confluence Requirements
**Minimum Confluence** (default = 2):
- 2/5 = Entry signal triggered
- 3/5 = Good signal
- 4/5 = Strong signal
- 5/5 = Excellent signal (rare)
**Higher confluence = Higher probability = Better trades**
### Specific Entry Patterns
#### 1. Bull Trending Entry
```
Requirements:
- Regime = Bull Trending
- Price pulls back to EMA20
- Close above EMA20 (bounce)
- Up candle (close > open)
- RSI < 60
- Confluence ≥ 2
```
#### 2. Bear Trending Entry
```
Requirements:
- Regime = Bear Trending
- Price rallies to EMA20
- Close below EMA20 (rejection)
- Down candle (close < open)
- RSI > 40
- Confluence ≥ 2
```
#### 3. Bull Ranging Entry
```
Requirements:
- Regime = Bull Ranging
- RSI < 40 (oversold)
- Price at or below support
- Up candle (reversal)
- Confluence ≥ 1 (more lenient)
```
#### 4. Bear Ranging Entry
```
Requirements:
- Regime = Bear Ranging
- RSI > 60 (overbought)
- Price at or above resistance
- Down candle (rejection)
- Confluence ≥ 1 (more lenient)
```
#### 5. Consolidation Breakout
```
Requirements:
- Regime = Consolidation
- Price breaks above/below range
- Volume > 1.5x average (explosive)
- Strong directional candle
```
---
## EXIT SIGNALS EXPLAINED
### Three Types of Exits
#### 1. Regime Change Exits (Automatic)
- **Long Exit**: Regime changes to Bear Trending or Chaos
- **Short Exit**: Regime changes to Bull Trending or Chaos
- **Reason**: Market character changed, strategy no longer valid
#### 2. Support/Resistance Break Exits
- **Long Exit**: Price breaks below support by 2%
- **Short Exit**: Price breaks above resistance by 2%
- **Reason**: Key level violated, trend may be reversing
#### 3. Momentum Exits
- **Long Exit**: RSI > 70 (overbought) AND down candle
- **Short Exit**: RSI < 30 (oversold) AND up candle
- **Reason**: Overextension, take profits
### Stop Loss & Take Profit
**Stop Loss** (Automatic in strategy):
- Placed at Entry - (ATR × 2)
- Adapts to volatility
- Protected from whipsaws
- Typically 2-4% for stocks, 5-10% for crypto
**Take Profit** (Automatic in strategy):
- Placed at Entry + (Stop Distance × R:R Ratio)
- Default 2.5:1 reward:risk
- Example: $2 risk = $5 reward target
- Allows winners to run
---
## TRADING EACH REGIME
### BULL TRENDING - Most Profitable Long Environment
**Strategy: Buy Every Dip**
**Entry Rules:**
1. Wait for pullback to EMA20 or SMA20
2. Look for RSI < 60
3. Enter when candle closes above MA
4. Confluence should be 2+
**Stop Loss:**
- Below the recent swing low
- Or 2 × ATR below entry
**Take Profit:**
- At previous high
- Or 2.5:1 R:R minimum
**Position Size:**
- Can use full size (2% risk)
- High win rate regime
**Example Trade:**
```
Price: $100, pulls back to $98 (EMA20)
Entry: $98.50 (close above EMA)
Stop: $96.50 (2 ATR)
Target: $103.50 (2.5:1)
Risk: $2, Reward: $5
```
---
### BEAR TRENDING - Most Profitable Short Environment
**Strategy: Sell Every Rally**
**Entry Rules:**
1. Wait for bounce to EMA20 or SMA20
2. Look for RSI > 40
3. Enter when candle closes below MA
4. Confluence should be 2+
**Stop Loss:**
- Above the recent swing high
- Or 2 × ATR above entry
**Take Profit:**
- At previous low
- Or 2.5:1 R:R minimum
**Position Size:**
- Can use full size (2% risk)
- High win rate regime
**Example Trade:**
```
Price: $100, rallies to $102 (EMA20)
Entry: $101.50 (close below EMA)
Stop: $103.50 (2 ATR)
Target: $96.50 (2.5:1)
Risk: $2, Reward: $5
```
---
### BULL RANGING - Buy Low, Sell High
**Strategy: Range Trading (Long Bias)**
**Entry Rules:**
1. Wait for price at support zone
2. Look for RSI < 40
3. Enter on reversal candle
4. Confluence should be 1-2+
**Stop Loss:**
- Below support zone
- Tighter than trending (1.5 ATR)
**Take Profit:**
- At resistance zone
- Don't hold through resistance
**Position Size:**
- Reduce to 1-1.5% risk
- Lower win rate than trending
**Example Trade:**
```
Range: $95-$105
Entry: $96 (at support, RSI 35)
Stop: $94 (below support)
Target: $104 (at resistance)
Risk: $2, Reward: $8 (4:1)
```
---
### BEAR RANGING - Sell High, Buy Low
**Strategy: Range Trading (Short Bias)**
**Entry Rules:**
1. Wait for price at resistance zone
2. Look for RSI > 60
3. Enter on rejection candle
4. Confluence should be 1-2+
**Stop Loss:**
- Above resistance zone
- Tighter than trending (1.5 ATR)
**Take Profit:**
- At support zone
- Don't hold through support
**Position Size:**
- Reduce to 1-1.5% risk
- Lower win rate than trending
**Example Trade:**
```
Range: $95-$105
Entry: $104 (at resistance, RSI 65)
Stop: $106 (above resistance)
Target: $96 (at support)
Risk: $2, Reward: $8 (4:1)
```
---
### CONSOLIDATION - Wait for Breakout
**Strategy: Breakout Trading**
**Entry Rules:**
1. Identify consolidation range
2. Wait for VOLUME SURGE (1.5x+ avg)
3. Enter on close outside range
4. Direction must be clear
**Stop Loss:**
- Opposite side of range
- Or 2 ATR
**Take Profit:**
- Measure range height, project it
- Example: $10 range = $10 move expected
**Position Size:**
- Reduce to 1% risk
- 50% false breakout rate
**Example Trade:**
```
Consolidation: $98-$102 (4-point range)
Breakout: $102.50 (high volume)
Entry: $103
Stop: $100 (back in range)
Target: $107 (4-point range projected)
Risk: $3, Reward: $4
```
---
### CHAOS - STAY OUT!
**Strategy: Preservation**
**What to Do:**
- ❌ NO new positions
- ✅ Close existing positions if near entry
- ✅ Tighten stops on profitable trades
- ✅ Reduce position sizes dramatically
- ✅ Wait for regime to stabilize
**Why It's Dangerous:**
- Stop hunts are common
- Whipsaws everywhere
- News-driven volatility
- No technical reliability
- Even "perfect" setups fail
**When Does It End:**
- Volatility ratio drops < 1.5
- ADX starts rising (direction appears)
- Price respects support/resistance again
- Usually 1-5 days
---
## CONFLUENCE SYSTEM
### How It Works
The system scores each potential entry on 5 factors. More factors aligning = higher probability.
### Confluence Requirements by Regime
**Trending Regimes** (strictest):
- Minimum 2/5 required
- 3/5 = Good
- 4-5/5 = Excellent
**Ranging Regimes** (moderate):
- Minimum 1-2/5 required
- 2/5 = Good
- 3+/5 = Excellent
**Consolidation** (breakout only):
- Volume is most critical
- Direction confirmation
- Less confluence needed
### Adjusting Minimum Confluence
**If too few signals:**
- Lower from 2 to 1
- More trades, lower quality
**If too many false signals:**
- Raise from 2 to 3
- Fewer trades, higher quality
**Recommendation:**
- Start at 2
- Adjust based on win rate
- Aim for 55-65% win rate
---
## STRATEGY BACKTESTING
### Loading the Strategy
1. Copy `market_regime_strategy.pine`
2. Open Pine Editor in TradingView
3. Paste and "Add to Chart"
4. Strategy Tester tab opens at bottom
### Initial Settings
```
Risk Per Trade: 2%
ATR Stop Multiplier: 2.0
Reward:Risk Ratio: 2.5
Trade Longs: ✓
Trade Shorts: ✓
Trade Trending Only: ✗ (test both)
Avoid Chaos: ✓
Minimum Confluence: 2
```
### What to Look For
**Good Results:**
- Win Rate: 50-60%
- Profit Factor: 1.8-2.5
- Net Profit: Positive
- Max Drawdown: <20%
- Consistent equity curve
**Warning Signs:**
- Win Rate: <45% (too many losses)
- Profit Factor: <1.5 (barely profitable)
- Max Drawdown: >30% (too risky)
- Erratic equity curve (unstable)
### Testing Different Regimes
**Test 1: Trending Only**
```
Trade Trending Only: ✓
Result: Higher win rate, fewer trades
```
**Test 2: All Regimes**
```
Trade Trending Only: ✗
Result: More trades, potentially lower win rate
```
**Test 3: Long Only**
```
Trade Longs: ✓
Trade Shorts: ✗
Result: Works in bull markets
```
**Test 4: Short Only**
```
Trade Longs: ✗
Trade Shorts: ✓
Result: Works in bear markets
```
---
## SETTINGS OPTIMIZATION
### Key Parameters to Adjust
#### 1. Risk Per Trade (Most Important)
- **0.5%** = Very conservative
- **1.0%** = Conservative (recommended for beginners)
- **2.0%** = Moderate (recommended)
- **3.0%** = Aggressive
- **5.0%** = Very aggressive (not recommended)
**Impact:** Higher risk = higher returns BUT bigger drawdowns
#### 2. Reward:Risk Ratio
- **2:1** = More wins needed, hit target faster
- **2.5:1** = Balanced (recommended)
- **3:1** = Fewer wins needed, hold longer
- **4:1** = Very patient, best in trending
**Impact:** Higher R:R = can have lower win rate
#### 3. Minimum Confluence
- **1** = More signals, lower quality
- **2** = Balanced (recommended)
- **3** = Fewer signals, higher quality
- **4** = Very selective
- **5** = Almost never triggers
**Impact:** Higher = fewer but better trades
#### 4. ADX Thresholds
- **Trending: 20-30** (default 25)
- Lower = detect trends earlier
- Higher = only strong trends
- **Ranging: 15-25** (default 20)
- Lower = identify ranging earlier
- Higher = only weak trends
#### 5. Trend Period (SMA)
- **20-50** = Short-term trends
- **50** = Medium-term (default, recommended)
- **100-200** = Long-term trends
**Impact:** Longer period = slower regime changes, more stable
### Optimization Workflow
**Step 1: Baseline**
- Use all default settings
- Test on 3+ years
- Record: Win Rate, PF, Drawdown
**Step 2: Risk Optimization**
- Test 1%, 1.5%, 2%, 2.5%
- Find best risk-adjusted return
- Balance profit vs drawdown
**Step 3: R:R Optimization**
- Test 2:1, 2.5:1, 3:1
- Check which maximizes profit factor
- Consider holding time
**Step 4: Confluence Optimization**
- Test 1, 2, 3
- Find sweet spot for win rate
- Aim for 55-65% win rate
**Step 5: Regime Filter**
- Test with/without trend filter
- Test with/without chaos filter
- Find what works for your asset
---
## REAL TRADING EXAMPLES
### Example 1: Bull Trending - SPY
**Setup:**
- Regime: BULL TRENDING
- Price pulls back from $450 to $445
- EMA20 at $444
- RSI drops to 45
- Confluence: 4/5
**Entry:**
- Price closes at $445.50 (above EMA20)
- LONG signal appears
- Enter at $445.50
**Risk Management:**
- Stop: $443 (2 ATR = $2.50)
- Target: $451.75 (2.5:1 = $6.25)
- Risk: $2.50 per share
- Position: 80 shares (2% of $10k = $200 risk)
**Outcome:**
- Price rallies to $452 in 3 days
- Target hit
- Profit: $6.50 × 80 = $520
- Return: 2.6 × risk (excellent)
---
### Example 2: Bear Ranging - AAPL
**Setup:**
- Regime: BEAR RANGING
- Range: $165-$175
- Price rallies to $174
- Resistance at $175
- RSI at 68
- Confluence: 3/5
**Entry:**
- Rejection candle at $174
- SHORT signal appears
- Enter at $173.50
**Risk Management:**
- Stop: $176 (above resistance)
- Target: $166 (support)
- Risk: $2.50
- Position: 80 shares
**Outcome:**
- Price drops to $167 in 2 days
- Target hit
- Profit: $6.50 × 80 = $520
- Return: 2.6 × risk
---
### Example 3: Consolidation Breakout - BTC
**Setup:**
- Regime: CONSOLIDATION
- Range: $28,000 - $30,000
- Compressed for 2 weeks
- Volume declining
**Breakout:**
- Price breaks $30,000
- Volume surges 200%
- Close at $30,500
- LONG signal
**Entry:**
- Enter at $30,500
**Risk Management:**
- Stop: $29,500 (back in range)
- Target: $32,000 (range height = $2k)
- Risk: $1,000
- Position: 0.2 BTC ($200 risk on $10k)
**Outcome:**
- Price runs to $33,000
- Target exceeded
- Profit: $2,500 × 0.2 = $500
- Return: 2.5 × risk
---
### Example 4: Avoiding Chaos - Tesla
**Setup:**
- Regime: BULL TRENDING
- LONG position from $240
- Elon tweets something crazy
- Regime changes to CHAOS
**Action:**
- EXIT signal appears
- Close position immediately
- Current price: $242 (small profit)
**Outcome:**
- Next 3 days: wild swings
- High $255, Low $230
- By staying out, avoided:
- Potential stop out
- Whipsaw losses
- Stress
**Result:**
- Small profit preserved
- Capital protected
- Re-enter when regime stabilizes
---
## ALERTS SETUP
### Available Alerts
1. **Bull Trending Regime** - Market goes bullish
2. **Bear Trending Regime** - Market goes bearish
3. **Chaos Regime** - High volatility, stay out
4. **Long Entry Signal** - Buy opportunity
5. **Short Entry Signal** - Sell opportunity
6. **Long Exit Signal** - Close long
7. **Short Exit Signal** - Close short
### How to Set Up
1. Click **⏰ (Alert)** icon in TradingView
2. Select **Condition**: Choose indicator + alert type
3. **Options**: Popup, Email, Webhook, etc.
4. **Message**: Customize notification
5. Click **Create**
### Recommended Alert Strategy
**For Active Traders:**
- Long Entry Signal
- Short Entry Signal
- Long Exit Signal
- Short Exit Signal
**For Position Traders:**
- Bull Trending Regime (enter longs)
- Bear Trending Regime (enter shorts)
- Chaos Regime (exit all)
**For Conservative:**
- Only regime change alerts
- Manually review entries
- More selective
---
## TIPS FOR SUCCESS
### 1. Start Small
- Paper trade first
- Then 0.5% risk
- Build to 1-2% over time
### 2. Follow the Regime
- Don't fight it
- Adapt your style
- Different tactics for each
### 3. Trust the Confluence
- 4-5/5 = Best trades
- 2-3/5 = Good trades
- 1/5 = Skip unless desperate
### 4. Respect Exits
- Don't hope and hold
- Cut losses quickly
- Take profits at targets
### 5. Avoid Chaos
- Seriously, just stay out
- Protect your capital
- Wait for clarity
### 6. Keep a Journal
- Record every trade
- Note regime and confluence
- Review weekly
- Learn patterns
### 7. Backtest Thoroughly
- 3+ years minimum
- Multiple market conditions
- Different assets
- Walk-forward test
### 8. Be Patient
- Best setups are rare
- 1-3 trades per week is normal
- Quality over quantity
- Compound over time
---
## COMMON QUESTIONS
**Q: How many trades per month should I expect?**
A: Depends on timeframe and settings. Daily chart: 5-15 trades/month. 4H chart: 15-30 trades/month.
**Q: What's a good win rate?**
A: 55-65% is excellent. 50-55% is good. Below 50% needs adjustment.
**Q: Should I trade all regimes?**
A: Beginners: Only trending. Intermediate: Trending + ranging. Advanced: All except chaos.
**Q: Can I use this on any timeframe?**
A: Best on Daily and 4H. Works on 1H with more noise. Not recommended <1H.
**Q: What if I'm in a trade and regime changes?**
A: Exit immediately (if using indicator) or let strategy handle it automatically.
**Q: How do I know if I'm over-optimizing?**
A: If results are perfect on one period but fail on another. Use walk-forward testing.
**Q: Should I always take 5/5 confluence trades?**
A: Yes, but they're rare (1-2/month). Don't wait only for these.
**Q: Can I combine this with other indicators?**
A: Yes, but keep it simple. RSI, MACD already included. Maybe add volume profile.
**Q: What assets work best?**
A: Liquid stocks, major crypto, futures. Avoid forex spot (use futures), penny stocks.
**Q: How long to hold positions?**
A: Trending: Days to weeks. Ranging: Hours to days. Breakout: Days. Let the regime guide you.
---
## FINAL THOUGHTS
This system gives you:
- ✅ Clear market context (regime)
- ✅ High-probability entries (confluence)
- ✅ Defined exits (automatic signals)
- ✅ Adaptable tactics (regime-specific)
- ✅ Backtestable results (strategy version)
**Success requires:**
- 📚 Understanding each regime
- 🎯 Following the signals
- 💪 Discipline to wait
- 🧠 Emotional control
- 📊 Proper risk management
**Start your journey:**
1. Load the indicator
2. Watch for 1 week (no trading)
3. Identify regime patterns
4. Paper trade for 1 month
5. Go live with small size
6. Scale up as you gain confidence
**Remember:** The market will always be here. There's no rush. Master one regime at a time, and you'll be profitable in all conditions!
Good luck! 🚀

SMT (ICT Concepts)Overview
Smart Money Technique (SMT) Divergence is a price action analysis method derived from Inner Circle Trader (ICT) methodology. This indicator automatically detects SMT divergences by comparing price movements across correlated financial instruments, identifying moments when assets that typically move together begin to diverge - a phenomenon often associated with potential price reversals.
An SMT divergence occurs when one instrument makes a new swing high or low while a correlated instrument fails to confirm that move. This failure to confirm suggests that the instrument may be positioning for a reversal, as the divergence indicates a lack of conviction in the current price direction across related markets.
Theoretical Foundation
What is SMT Divergence?
In correlated markets, instruments tend to move in tandem. For example, the E-mini S&P 500 (ES) and E-mini Nasdaq 100 (NQ) futures typically make swing highs and lows together due to their shared exposure to U.S. equity markets. When this correlation breaks down at key swing points, it creates an SMT divergence.
Bullish SMT Divergence:
The chart instrument creates a lower low compared to a previous swing low, while the correlated comparison instrument creates a higher low (or fails to make a lower low). This divergence at the lows suggests potential buying pressure and a possible bullish reversal.
Bearish SMT Divergence:
The chart instrument creates a higher high compared to a previous swing high, while the correlated comparison instrument creates a lower high (or fails to make a higher high). This divergence at the highs suggests potential selling pressure and a possible bearish reversal.
Why SMT Divergences Matter
SMT divergences are considered significant because they may indicate:
Accumulation or distribution occurring in one instrument but not the other
Relative strength or weakness between correlated assets
Potential exhaustion of the current trend
Early warning signs before major reversals
Indicator Features
Multi-Timeframe SMT Detection
This indicator provides simultaneous SMT detection on two timeframes:
Current Timeframe (CTF) Detection:
The indicator scans for SMT divergences on the chart's active timeframe using multiple pivot lookback periods (3, 5, 8, 13, 21, and 34 bars). This multi-period approach ensures detection of both short-term and intermediate swing points, reducing the likelihood of missing valid divergences while filtering out noise.
Higher Timeframe (HTF) Detection:
Simultaneously, the indicator monitors a higher timeframe for SMT divergences using pivot periods of 3, 5, 8, 13, and 21 HTF candles. Higher timeframe signals generally carry more significance as they represent larger market structure.
Automatic Timeframe Pairing:
When enabled, the indicator automatically selects an appropriate higher timeframe based on your chart's current timeframe:
Sub-1 minute charts pair with 5-minute
1-2 minute charts pair with 15-minute
3-4 minute charts pair with 30-minute
5 minute charts pair with 1-hour
6-9 minute charts pair with 1-hour
15 minute charts pair with 4-hour
16-59 minute charts pair with Daily
1-4 hour charts pair with Weekly
Daily charts pair with Monthly
Combined Signal Detection:
When an SMT divergence is detected on both the current timeframe and higher timeframe at the same price pivots, the indicator combines these into a single enhanced signal. Combined signals display both timeframes in the label and use the higher timeframe styling to emphasize their increased significance.
Automatic Symbol Correlation
The indicator includes comprehensive automatic symbol selection based on the instrument you are viewing. When Auto SMT is enabled, the indicator intelligently selects correlated comparison symbols.
Index Futures Correlations:
E-mini Contracts:
NQ (Nasdaq 100) compares with ES (S&P 500) and YM (Dow Jones)
ES (S&P 500) compares with NQ (Nasdaq 100) and YM (Dow Jones)
YM (Dow Jones) compares with NQ (Nasdaq 100) and ES (S&P 500)
RTY (Russell 2000) compares with ES (S&P 500) and NQ (Nasdaq 100)
Micro Contracts:
MNQ (Micro Nasdaq) compares with MES (Micro S&P) and MYM (Micro Dow)
MES (Micro S&P) compares with MNQ (Micro Nasdaq) and MYM (Micro Dow)
MYM (Micro Dow) compares with MNQ (Micro Nasdaq) and MES (Micro S&P)
M2K (Micro Russell) compares with MES (Micro S&P) and MNQ (Micro Nasdaq)
Metals Futures Correlations:
Standard Contracts:
GC (Gold) compares with SI (Silver) and PL (Platinum)
SI (Silver) compares with GC (Gold) and PL (Platinum)
PL (Platinum) compares with GC (Gold) and SI (Silver)
Micro Contracts:
MGC (Micro Gold) compares with SIL (Micro Silver) and PL (Platinum)
SIL (Micro Silver) compares with MGC (Micro Gold) and PL (Platinum)
Energy Futures Correlations:
CL (Crude Oil) compares with RB (RBOB Gasoline) and NG (Natural Gas)
RB (RBOB Gasoline) compares with CL (Crude Oil) and NG (Natural Gas)
NG (Natural Gas) compares with CL (Crude Oil) and RB (RBOB Gasoline)
MCL (Micro Crude) compares with RB (RBOB Gasoline) and NG (Natural Gas)
Major ETF Correlations:
SPY (S&P 500 ETF) compares with QQQ, DIA, and IWM
QQQ (Nasdaq 100 ETF) compares with SPY, DIA, and IWM
DIA (Dow Jones ETF) compares with SPY, QQQ, and IWM
IWM (Russell 2000 ETF) compares with SPY, QQQ, and DIA
Stock Sector Mapping:
When viewing individual stocks, the indicator automatically identifies the stock's sector and selects appropriate sector ETFs for comparison:
Technology Sector (AAPL, MSFT, GOOGL, NVDA, AMD, INTC, etc.):
Primary: QQQ (Nasdaq 100 ETF)
Secondary: XLK (Technology Select Sector SPDR)
Tertiary: SPY (S&P 500 ETF)
Financial Sector (JPM, BAC, GS, MS, WFC, etc.):
Primary: XLF (Financial Select Sector SPDR)
Secondary: KBE (SPDR S&P Bank ETF)
Tertiary: SPY (S&P 500 ETF)
Energy Sector (XOM, CVX, COP, SLB, etc.):
Primary: XLE (Energy Select Sector SPDR)
Secondary: USO (United States Oil Fund)
Tertiary: SPY (S&P 500 ETF)
Healthcare Sector (JNJ, UNH, PFE, MRK, LLY, etc.):
Primary: XLV (Health Care Select Sector SPDR)
Secondary: IBB (iShares Biotechnology ETF)
Tertiary: SPY (S&P 500 ETF)
Consumer Discretionary Sector (TSLA, HD, NKE, MCD, etc.):
Primary: XLY (Consumer Discretionary Select Sector SPDR)
Secondary: SPY (S&P 500 ETF)
Tertiary: QQQ (Nasdaq 100 ETF)
Consumer Staples Sector (PG, KO, PEP, WMT, COST, etc.):
Primary: XLP (Consumer Staples Select Sector SPDR)
Secondary: SPY (S&P 500 ETF)
Tertiary: QQQ (Nasdaq 100 ETF)
Industrial Sector (CAT, BA, HON, UPS, etc.):
Primary: XLI (Industrial Select Sector SPDR)
Secondary: SPY (S&P 500 ETF)
Tertiary: QQQ (Nasdaq 100 ETF)
Materials Sector (LIN, APD, SHW, FCX, NEM, etc.):
Primary: XLB (Materials Select Sector SPDR)
Secondary: GLD (SPDR Gold Shares)
Tertiary: SPY (S&P 500 ETF)
Utilities Sector (NEE, DUK, SO, etc.):
Primary: XLU (Utilities Select Sector SPDR)
Secondary: SPY (S&P 500 ETF)
Tertiary: QQQ (Nasdaq 100 ETF)
Real Estate Sector (AMT, PLD, CCI, etc.):
Primary: XLRE (Real Estate Select Sector SPDR)
Secondary: VNQ (Vanguard Real Estate ETF)
Tertiary: SPY (S&P 500 ETF)
Communication Services Sector (NFLX, DIS, CMCSA, VZ, T, etc.):
Primary: XLC (Communication Services Select Sector SPDR)
Secondary: SPY (S&P 500 ETF)
Tertiary: QQQ (Nasdaq 100 ETF)
Forex Correlations:
EURUSD compares with GBPUSD
GBPUSD compares with EURUSD
Cryptocurrency Correlations:
BTCUSD compares with ETHUSD
ETHUSD compares with BTCUSD
Three-Symbol Comparison
The indicator supports comparison against up to three symbols simultaneously. When multiple comparison symbols show divergence at the same pivot point, all diverging symbols are displayed in the label, providing stronger confluence. For example, if NQ shows divergence with both ES and YM at the same swing high, the label will display "ES1! + YM1!" indicating divergence confirmation from multiple correlated instruments.
Invalidation Logic
SMT divergences are not indefinitely valid. The indicator includes automatic invalidation logic based on price action following the divergence signal.
Invalidation Rules:
Bearish SMT: Invalidates when price trades above the high of the confirmation pivot (right side of the divergence)
Bullish SMT: Invalidates when price trades below the low of the confirmation pivot (right side of the divergence)
The invalidation level is set at the confirmation bar (the second pivot that completes the SMT pattern), not the extreme of both pivots. This approach aligns with the concept that once price exceeds the confirmation point, the divergence setup is no longer valid.
Invalidation Display Options:
Users can choose to show or hide invalidated SMT signals separately for current timeframe and higher timeframe divergences. When shown, invalidated signals can be displayed with different line styles and widths to visually distinguish them from active signals. Separate limits prevent excessive invalidated signals from cluttering the chart (maximum 15 invalidated signals per timeframe type).
Input Settings
General Settings
Enable SMT Detection:
Master toggle to enable or disable all SMT divergence detection. When disabled, no SMT signals will be calculated or displayed.
Direction:
Filter which divergence types to display:
Both: Display both bullish and bearish SMT divergences
Bullish: Display only bullish SMT divergences (divergence at lows)
Bearish: Display only bearish SMT divergences (divergence at highs)
Symbol Settings
Enable Auto SMT:
When enabled, the indicator automatically selects correlated comparison symbols based on the chart instrument using the correlation mappings described above. When disabled, manual symbol inputs are used.
Symbol 1 (with enable toggle):
First comparison symbol. Enabled by default. When Auto SMT is disabled, enter the desired symbol manually.
Symbol 2 (with enable toggle):
Second comparison symbol. Enabled by default. When Auto SMT is disabled, enter the desired symbol manually.
Symbol 3 (with enable toggle):
Third comparison symbol. Disabled by default. Enable for additional confirmation from a third correlated instrument.
Current Timeframe SMT Settings
Show Current TF SMTs:
Toggle visibility of SMT divergences detected on the chart's current timeframe.
Bullish Color:
Color for bullish SMT divergence lines and labels on the current timeframe.
Bearish Color:
Color for bearish SMT divergence lines and labels on the current timeframe.
Line Style:
Style for current timeframe SMT lines (solid, dashed, or dotted).
Line Width:
Width of current timeframe SMT lines (1-4 pixels).
Show Labels:
Toggle visibility of labels on current timeframe SMT divergences.
Label Style:
Normal: Displays full information including timeframe and diverging symbol names
+/-: Displays minimal "+" or "-" characters with full information available in hover tooltip
Label Size:
Size of current timeframe SMT labels (Tiny, Small, Normal, or Large).
Show Invalidated:
Toggle visibility of invalidated current timeframe SMT signals.
Invalidated Line Style:
Line style for invalidated current timeframe SMT signals.
Invalidated Line Width:
Line width for invalidated current timeframe SMT signals.
Higher Timeframe SMT Settings
Show Higher TF SMTs:
Toggle visibility of SMT divergences detected on the higher timeframe.
Auto Timeframe:
When enabled, automatically selects an appropriate higher timeframe based on the chart's current timeframe. When disabled, uses the manually specified timeframe.
Manual Timeframe:
When Auto Timeframe is disabled, specify the higher timeframe to scan for SMT divergences.
Bullish Color:
Color for bullish SMT divergence lines and labels on the higher timeframe.
Bearish Color:
Color for bearish SMT divergence lines and labels on the higher timeframe.
Line Style:
Style for higher timeframe SMT lines (solid, dashed, or dotted).
Line Width:
Width of higher timeframe SMT lines (1-4 pixels).
Show Labels:
Toggle visibility of labels on higher timeframe SMT divergences.
Label Style:
Normal: Displays full information including timeframe and diverging symbol names
+/-: Displays minimal "+" or "-" characters with full information available in hover tooltip
Label Size:
Size of higher timeframe SMT labels (Tiny, Small, Normal, or Large).
Show Invalidated:
Toggle visibility of invalidated higher timeframe SMT signals.
Invalidated Line Style:
Line style for invalidated higher timeframe SMT signals.
Invalidated Line Width:
Line width for invalidated higher timeframe SMT signals.
Visual Representation
Line Display
SMT divergences are displayed as lines connecting the two pivot points that form the divergence:
For bearish SMT: A line connects the previous swing high to the current (higher) swing high
For bullish SMT: A line connects the previous swing low to the current (lower) swing low
The line color indicates the divergence type (bullish or bearish) and whether it was detected on the current timeframe or higher timeframe.
Label Display
Labels are positioned at the midpoint of the SMT line and display:
The timeframe on which the divergence was detected
The symbol(s) that showed divergence with the chart instrument
When using the "+/-" label style, labels show only "+" for bullish or "-" for bearish divergences, with full information accessible via hover tooltip.
All labels use monospace font formatting for consistent visual appearance.
Combined Signals
When the same divergence is detected on both current and higher timeframes, the signals are combined into a single display using higher timeframe styling. The label shows both timeframes (e.g., "M2 + M15") and all diverging symbols, indicating strong multi-timeframe confluence.
Practical Application Guidelines
Signal Interpretation
SMT divergences should be interpreted within the broader market context. Consider the following when evaluating signals:
Market Structure: SMT divergences occurring at key structural levels (previous highs/lows, order blocks, fair value gaps) tend to be more significant.
Timeframe Confluence: Signals appearing on multiple timeframes simultaneously suggest stronger institutional involvement.
Symbol Confluence: Divergences confirmed by multiple comparison symbols indicate broader market disagreement with the current price direction.
Time of Day: SMT divergences during high-volume trading sessions may carry more weight than those during low-liquidity periods.
Limitations and Considerations
Correlation Variability: Correlations between instruments can strengthen or weaken over time. The automatic symbol selection is based on typical correlations but may not always reflect current market conditions.
Pivot Detection Lag: Pivots are only confirmed after subsequent price action, meaning SMT signals appear with some delay after the actual swing point forms.
False Signals: Not all SMT divergences result in reversals. Use additional confirmation methods and proper risk management.
Data Requirements: The indicator requires sufficient historical data and may not function properly on instruments with limited price history.
Technical Notes
The indicator uses multiple pivot detection periods to identify swing points across different scales
Higher timeframe candle tracking is performed on the lower timeframe chart for precise pivot bar indexing
A deduplication system prevents the same divergence from being detected multiple times across different pivot periods
Array-based storage manages active and invalidated SMT signals with automatic cleanup to prevent memory issues
Maximum label and line counts are set to 500 each to accommodate extended analysis periods
Disclaimer
This indicator is provided for educational and informational purposes only. It is designed to assist traders in identifying potential SMT divergences based on historical price data and should not be considered as financial advice or a recommendation to buy or sell any financial instrument.
Trading financial markets involves substantial risk of loss and is not suitable for all investors. Past performance of any trading methodology, including concepts discussed in this indicator, does not guarantee future results. Users should conduct their own research and analysis before making any trading decisions.
The automatic symbol correlations and sector mappings are based on general market relationships and may not accurately reflect current or future correlations. Users are encouraged to verify correlations independently and adjust comparison symbols as needed.
Always use appropriate risk management techniques, including but not limited to position sizing and stop-loss orders. Never risk more capital than you can afford to lose.

Razzere Cloned! EzAlgo V.8.1showBuySell = input(true, "Show Buy & Sell", group="BUY & SELL SIGNALS")
hassasiyet = input.float(3, "Hassasiyet (1-6)", 0.1, 99999, group="BUY & SELL SIGNALS")
percentStop = input.float(1, "Stop Loss % (0 to Disable)", 0, group="BUY & SELL SIGNALS")
offsetSignal = input.float(5, "Signals Offset", 0, group="BUY & SELL SIGNALS")
showRibbon = input(true, "Show Trend Ribbon", group="TREND RIBBON")
smooth1 = input.int(5, "Smoothing 1", 1, group="TREND RIBBON")
smooth2 = input.int(8, "Smoothing 2", 1, group="TREND RIBBON")
showreversal = input(true, "Show Reversals", group="REVERSAL SIGNALS")
showPdHlc = input(false, "Show P.D H/L/C", group="PREVIOUS DAY HIGH LOW CLOSE")
lineColor = input.color(color.yellow, "Line Colors", group="PREVIOUS DAY HIGH LOW CLOSE")
lineWidth = input.int(1, "Width Lines", group="PREVIOUS DAY HIGH LOW CLOSE")
lineStyle = input.string("Solid", "Line Style", )
labelSize = input.string("normal", "Label Text Size", )
labelColor = input.color(color.yellow, "Label Text Colors")
showEmas = input(false, "Show EMAs", group="EMA")
srcEma1 = input(close, "Source EMA 1")
lenEma1 = input.int(7, "Length EMA 1", 1)
srcEma2 = input(close, "Source EMA 2")
lenEma2 = input.int(21, "Length EMA 2", 1)
srcEma3 = input(close, "Source EMA 3")
lenEma3 = input.int(144, "Length EMA 3", 1)
showSwing = input(false, "Show Swing Points", group="SWING POINTS")
prdSwing = input.int(10, "Swing Point Period", 2, group="SWING POINTS")
colorPos = input(color.new(color.green, 50), "Positive Swing Color")
colorNeg = input(color.new(color.red, 50), "Negative Swing Color")
showDashboard = input(true, "Show Dashboard", group="TREND DASHBOARD")
locationDashboard = input.string("Middle Right", "Table Location", , group="TREND DASHBOARD")
tableTextColor = input(color.white, "Table Text Color", group="TREND DASHBOARD")
tableBgColor = input(#2A2A2A, "Table Background Color", group="TREND DASHBOARD")
sizeDashboard = input.string("Normal", "Table Size", , group="TREND DASHBOARD")
showRevBands = input.bool(true, "Show Reversal Bands", group="REVERSAL BANDS")
lenRevBands = input.int(30, "Length", group="REVERSAL BANDS")
// Fonksiyonlar
smoothrng(x, t, m) =>
wper = t * 2 - 1
avrng = ta.ema(math.abs(x - x ), t)
smoothrng = ta.ema(avrng, wper) * m
rngfilt(x, r) =>
rngfilt = x
rngfilt := x > nz(rngfilt ) ? x - r < nz(rngfilt ) ? nz(rngfilt ) : x - r : x + r > nz(rngfilt ) ? nz(rngfilt ) : x + r
percWidth(len, perc) => (ta.highest(len) - ta.lowest(len)) * perc / 100
securityNoRep(sym, res, src) => request.security(sym, res, src, barmerge.gaps_off, barmerge.lookahead_on)
swingPoints(prd) =>
pivHi = ta.pivothigh(prd, prd)
pivLo = ta.pivotlow (prd, prd)
last_pivHi = ta.valuewhen(pivHi, pivHi, 1)
last_pivLo = ta.valuewhen(pivLo, pivLo, 1)
hh = pivHi and pivHi > last_pivHi ? pivHi : na
lh = pivHi and pivHi < last_pivHi ? pivHi : na
hl = pivLo and pivLo > last_pivLo ? pivLo : na
ll = pivLo and pivLo < last_pivLo ? pivLo : na
f_chartTfInMinutes() =>
float _resInMinutes = timeframe.multiplier * (
timeframe.isseconds ? 1 :
timeframe.isminutes ? 1. :
timeframe.isdaily ? 60. * 24 :
timeframe.isweekly ? 60. * 24 * 7 :
timeframe.ismonthly ? 60. * 24 * 30.4375 : na)
f_kc(src, len, hassasiyet) =>
basis = ta.sma(src, len)
span = ta.atr(len)
wavetrend(src, chlLen, avgLen) =>
esa = ta.ema(src, chlLen)
d = ta.ema(math.abs(src - esa), chlLen)
ci = (src - esa) / (0.015 * d)
wt1 = ta.ema(ci, avgLen)
wt2 = ta.sma(wt1, 3)
f_top_fractal(src) => src < src and src < src and src > src and src > src
f_bot_fractal(src) => src > src and src > src and src < src and src < src
f_fractalize (src) => f_top_fractal(src) ? 1 : f_bot_fractal(src) ? -1 : 0
f_findDivs(src, topLimit, botLimit) =>
fractalTop = f_fractalize(src) > 0 and src >= topLimit ? src : na
fractalBot = f_fractalize(src) < 0 and src <= botLimit ? src : na
highPrev = ta.valuewhen(fractalTop, src , 0)
highPrice = ta.valuewhen(fractalTop, high , 0)
lowPrev = ta.valuewhen(fractalBot, src , 0)
lowPrice = ta.valuewhen(fractalBot, low , 0)
bearSignal = fractalTop and high > highPrice and src < highPrev
bullSignal = fractalBot and low < lowPrice and src > lowPrev
// Bileşen...
source = close
smrng1 = smoothrng(source, 27, 1.5)
smrng2 = smoothrng(source, 55, hassasiyet)
smrng = (smrng1 + smrng2) / 2
filt = rngfilt(source, smrng)
up = 0.0, up := filt > filt ? nz(up ) + 1 : filt < filt ? 0 : nz(up )
dn = 0.0, dn := filt < filt ? nz(dn ) + 1 : filt > filt ? 0 : nz(dn )
bullCond = bool(na), bullCond := source > filt and source > source and up > 0 or source > filt and source < source and up > 0
bearCond = bool(na), bearCond := source < filt and source < source and dn > 0 or source < filt and source > source and dn > 0
lastCond = 0, lastCond := bullCond ? 1 : bearCond ? -1 : lastCond
bull = bullCond and lastCond == -1
bear = bearCond and lastCond == 1
countBull = ta.barssince(bull)
countBear = ta.barssince(bear)
trigger = nz(countBull, bar_index) < nz(countBear, bar_index) ? 1 : 0
ribbon1 = ta.sma(close, smooth1)
ribbon2 = ta.sma(close, smooth2)
rsi = ta.rsi(close, 21)
rsiOb = rsi > 70 and rsi > ta.ema(rsi, 10)
rsiOs = rsi < 30 and rsi < ta.ema(rsi, 10)
dHigh = securityNoRep(syminfo.tickerid, "D", high )
dLow = securityNoRep(syminfo.tickerid, "D", low )
dClose = securityNoRep(syminfo.tickerid, "D", close )
ema1 = ta.ema(srcEma1, lenEma1)
ema2 = ta.ema(srcEma2, lenEma2)
ema3 = ta.ema(srcEma3, lenEma3)
= swingPoints(prdSwing)
ema = ta.ema(close, 144)
emaBull = close > ema
equal_tf(res) => str.tonumber(res) == f_chartTfInMinutes() and not timeframe.isseconds
higher_tf(res) => str.tonumber(res) > f_chartTfInMinutes() or timeframe.isseconds
too_small_tf(res) => (timeframe.isweekly and res=="1") or (timeframe.ismonthly and str.tonumber(res) < 10)
securityNoRep1(sym, res, src) =>
bool bull_ = na
bull_ := equal_tf(res) ? src : bull_
bull_ := higher_tf(res) ? request.security(sym, res, src, barmerge.gaps_off, barmerge.lookahead_on) : bull_
bull_array = request.security_lower_tf(syminfo.tickerid, higher_tf(res) ? str.tostring(f_chartTfInMinutes()) + (timeframe.isseconds ? "S" : "") : too_small_tf(res) ? (timeframe.isweekly ? "3" : "10") : res, src)
if array.size(bull_array) > 1 and not equal_tf(res) and not higher_tf(res)
bull_ := array.pop(bull_array)
array.clear(bull_array)
bull_
TF1Bull = securityNoRep1(syminfo.tickerid, "1" , emaBull)
TF3Bull = securityNoRep1(syminfo.tickerid, "3" , emaBull)
TF5Bull = securityNoRep1(syminfo.tickerid, "5" , emaBull)
TF15Bull = securityNoRep1(syminfo.tickerid, "15" , emaBull)
TF30Bull = securityNoRep1(syminfo.tickerid, "30" , emaBull)
TF60Bull = securityNoRep1(syminfo.tickerid, "60" , emaBull)
TF120Bull = securityNoRep1(syminfo.tickerid, "120" , emaBull)
TF240Bull = securityNoRep1(syminfo.tickerid, "240" , emaBull)
TF480Bull = securityNoRep1(syminfo.tickerid, "480" , emaBull)
TFDBull = securityNoRep1(syminfo.tickerid, "1440", emaBull)
= f_kc(close, lenRevBands, 3)
= f_kc(close, lenRevBands, 4)
= f_kc(close, lenRevBands, 5)
= f_kc(close, lenRevBands, 6)
= wavetrend(hlc3, 9, 12)
= f_findDivs(wt2, 15, -40)
= f_findDivs(wt2, 45, -65)
wtDivBull = wtDivBull1 or wtDivBull2
wtDivBear = wtDivBear1 or wtDivBear2
// Renkler
cyan = #00DBFF, cyan30 = color.new(cyan, 70)
pink = #E91E63, pink30 = color.new(pink, 70)
red = #FF5252, red30 = color.new(red , 70)
// Plotlar
off = percWidth(300, offsetSignal)
plotshape(showBuySell and bull ? low - off : na, "Buy Label" , shape.labelup , location.absolute, cyan, 0, "Buy" , color.white, size=size.normal)
plotshape(showBuySell and bear ? high + off : na, "Sell Label", shape.labeldown, location.absolute, pink, 0, "Sell", color.white, size=size.normal)
plotshape(ta.crossover(wt1, wt2) and wt2 <= -53, "Mild Buy" , shape.xcross, location.belowbar, cyan, size=size.tiny)
plotshape(ta.crossunder(wt1, wt2) and wt2 >= 53, "Mild Sell", shape.xcross, location.abovebar, pink, size=size.tiny)
plotshape(wtDivBull, "Divergence Buy ", shape.triangleup , location.belowbar, cyan, size=size.tiny)
plotshape(wtDivBear, "Divergence Sell", shape.triangledown, location.abovebar, pink, size=size.tiny)
barcolor(up > dn ? cyan : pink)
plotshape(showreversal and rsiOs, "Reversal Buy" , shape.diamond, location.belowbar, cyan30, size=size.tiny)
plotshape(showreversal and rsiOb, "Reversal Sell", shape.diamond, location.abovebar, pink30, size=size.tiny)
lStyle = lineStyle == "Solid" ? line.style_solid : lineStyle == "Dotted" ? line.style_dotted : line.style_dashed
lSize = labelSize == "small" ? size.small : labelSize == "normal" ? size.normal : size.large
dHighLine = showPdHlc ? line.new(bar_index, dHigh, bar_index + 1, dHigh , xloc.bar_index, extend.both, lineColor, lStyle, lineWidth) : na, line.delete(dHighLine )
dLowLine = showPdHlc ? line.new(bar_index, dLow , bar_index + 1, dLow , xloc.bar_index, extend.both, lineColor, lStyle, lineWidth) : na, line.delete(dLowLine )
dCloseLine = showPdHlc ? line.new(bar_index, dClose, bar_index + 1, dClose, xloc.bar_index, extend.both, lineColor, lStyle, lineWidth) : na, line.delete(dCloseLine )
dHighLabel = showPdHlc ? label.new(bar_index + 100, dHigh , "P.D.H", xloc.bar_index, yloc.price, #000000, label.style_none, labelColor, lSize) : na, label.delete(dHighLabel )
dLowLabel = showPdHlc ? label.new(bar_index + 100, dLow , "P.D.L", xloc.bar_index, yloc.price, #000000, label.style_none, labelColor, lSize) : na, label.delete(dLowLabel )
dCloseLabel = showPdHlc ? label.new(bar_index + 100, dClose, "P.D.C", xloc.bar_index, yloc.price, #000000, label.style_none, labelColor, lSize) : na, label.delete(dCloseLabel )
plot(showEmas ? ema1 : na, "EMA 1", color.green , 2)
plot(showEmas ? ema2 : na, "EMA 2", color.purple, 2)
plot(showEmas ? ema3 : na, "EMA 3", color.yellow, 2)
plotshape(showSwing ? hh : na, "", shape.triangledown, location.abovebar, color.new(color.green, 50), -prdSwing, "HH", colorPos, false)
plotshape(showSwing ? hl : na, "", shape.triangleup , location.belowbar, color.new(color.green, 50), -prdSwing, "HL", colorPos, false)
plotshape(showSwing ? lh : na, "", shape.triangledown, location.abovebar, color.new(color.red , 50), -prdSwing, "LH", colorNeg, false)
plotshape(showSwing ? ll : na, "", shape.triangleup , location.belowbar, color.new(color.red , 50), -prdSwing, "LL", colorNeg, false)
srcStop = close
atrBand = srcStop * (percentStop / 100)
atrStop = trigger ? srcStop - atrBand : srcStop + atrBand
lastTrade(src) => ta.valuewhen(bull or bear, src, 0)
entry_y = lastTrade(srcStop)
stop_y = lastTrade(atrStop)
tp1_y = (entry_y - lastTrade(atrStop)) * 1 + entry_y
tp2_y = (entry_y - lastTrade(atrStop)) * 2 + entry_y
tp3_y = (entry_y - lastTrade(atrStop)) * 3 + entry_y
labelTpSl(y, txt, color) =>
label labelTpSl = percentStop != 0 ? label.new(bar_index + 1, y, txt, xloc.bar_index, yloc.price, color, label.style_label_left, color.white, size.normal) : na
label.delete(labelTpSl )
labelTpSl(entry_y, "Entry: " + str.tostring(math.round_to_mintick(entry_y)), color.gray)
labelTpSl(stop_y , "Stop Loss: " + str.tostring(math.round_to_mintick(stop_y)), color.red)
labelTpSl(tp1_y, "Take Profit 1: " + str.tostring(math.round_to_mintick(tp1_y)), color.green)
labelTpSl(tp2_y, "Take Profit 2: " + str.tostring(math.round_to_mintick(tp2_y)), color.green)
labelTpSl(tp3_y, "Take Profit 3: " + str.tostring(math.round_to_mintick(tp3_y)), color.green)
lineTpSl(y, color) =>
line lineTpSl = percentStop != 0 ? line.new(bar_index - (trigger ? countBull : countBear) + 4, y, bar_index + 1, y, xloc.bar_index, extend.none, color, line.style_solid) : na
line.delete(lineTpSl )
lineTpSl(entry_y, color.gray)
lineTpSl(stop_y, color.red)
lineTpSl(tp1_y, color.green)
lineTpSl(tp2_y, color.green)
lineTpSl(tp3_y, color.green)
var dashboard_loc = locationDashboard == "Top Right" ? position.top_right : locationDashboard == "Middle Right" ? position.middle_right : locationDashboard == "Bottom Right" ? position.bottom_right : locationDashboard == "Top Center" ? position.top_center : locationDashboard == "Middle Center" ? position.middle_center : locationDashboard == "Bottom Center" ? position.bottom_center : locationDashboard == "Top Left" ? position.top_left : locationDashboard == "Middle Left" ? position.middle_left : position.bottom_left
var dashboard_size = sizeDashboard == "Large" ? size.large : sizeDashboard == "Normal" ? size.normal : sizeDashboard == "Small" ? size.small : size.tiny
var dashboard = showDashboard ? table.new(dashboard_loc, 2, 15, tableBgColor, #000000, 2, tableBgColor, 1) : na
dashboard_cell(column, row, txt, signal=false) => table.cell(dashboard, column, row, txt, 0, 0, signal ? #000000 : tableTextColor, text_size=dashboard_size)
dashboard_cell_bg(column, row, col) => table.cell_set_bgcolor(dashboard, column, row, col)
if barstate.islast and showDashboard
dashboard_cell(0, 0 , "EzAlgo")
dashboard_cell(0, 1 , "Current Position")
dashboard_cell(0, 2 , "Current Trend")
dashboard_cell(0, 3 , "Volume")
dashboard_cell(0, 4 , "Timeframe")
dashboard_cell(0, 5 , "1 min:")
dashboard_cell(0, 6 , "3 min:")
dashboard_cell(0, 7 , "5 min:")
dashboard_cell(0, 8 , "15 min:")
dashboard_cell(0, 9 , "30 min:")
dashboard_cell(0, 10, "1 H:")
dashboard_cell(0, 11, "2 H:")
dashboard_cell(0, 12, "4 H:")
dashboard_cell(0, 13, "8 H:")
dashboard_cell(0, 14, "Daily:")
dashboard_cell(1, 0 , "V.8.1")
dashboard_cell(1, 1 , trigger ? "Buy" : "Sell", true), dashboard_cell_bg(1, 1, trigger ? color.green : color.red)
dashboard_cell(1, 2 , emaBull ? "Bullish" : "Bearish", true), dashboard_cell_bg(1, 2, emaBull ? color.green : color.red)
dashboard_cell(1, 3 , str.tostring(volume))
dashboard_cell(1, 4 , "Trends")
dashboard_cell(1, 5 , TF1Bull ? "Bullish" : "Bearish", true), dashboard_cell_bg(1, 5 , TF1Bull ? color.green : color.red)
dashboard_cell(1, 6 , TF3Bull ? "Bullish" : "Bearish", true), dashboard_cell_bg(1, 6 , TF3Bull ? color.green : color.red)
dashboard_cell(1, 7 , TF5Bull ? "Bullish" : "Bearish", true), dashboard_cell_bg(1, 7 , TF5Bull ? color.green : color.red)
dashboard_cell(1, 8 , TF15Bull ? "Bullish" : "Bearish", true), dashboard_cell_bg(1, 8 , TF15Bull ? color.green : color.red)
dashboard_cell(1, 9 , TF30Bull ? "Bullish" : "Bearish", true), dashboard_cell_bg(1, 9 , TF30Bull ? color.green : color.red)
dashboard_cell(1, 10, TF60Bull ? "Bullish" : "Bearish", true), dashboard_cell_bg(1, 10, TF60Bull ? color.green : color.red)
dashboard_cell(1, 11, TF120Bull ? "Bullish" : "Bearish", true), dashboard_cell_bg(1, 11, TF120Bull ? color.green : color.red)
dashboard_cell(1, 12, TF240Bull ? "Bullish" : "Bearish", true), dashboard_cell_bg(1, 12, TF240Bull ? color.green : color.red)
dashboard_cell(1, 13, TF480Bull ? "Bullish" : "Bearish", true), dashboard_cell_bg(1, 13, TF480Bull ? color.green : color.red)
dashboard_cell(1, 14, TFDBull ? "Bullish" : "Bearish", true), dashboard_cell_bg(1, 14, TFDBull ? color.green : color.red)
plot(showRevBands ? upperKC1 : na, "Rev.Zone Upper 1", red30)
plot(showRevBands ? upperKC2 : na, "Rev.Zone Upper 2", red30)
plot(showRevBands ? upperKC3 : na, "Rev.Zone Upper 3", red30)
plot(showRevBands ? upperKC4 : na, "Rev.Zone Upper 4", red30)
plot(showRevBands ? lowerKC4 : na, "Rev.Zone Lower 4", cyan30)
plot(showRevBands ? lowerKC3 : na, "Rev.Zone Lower 3", cyan30)
plot(showRevBands ? lowerKC2 : na, "Rev.Zone Lower 2", cyan30)
plot(showRevBands ? lowerKC1 : na, "Rev.Zone Lower 1", cyan30)
fill(plot(showRibbon ? ribbon1 : na, "", na, editable=false), plot(showRibbon ? ribbon2 : na, "", na, editable=false), ribbon1 > ribbon2 ? cyan30 : pink30, "Ribbon Fill Color")
// Alarmlar
alert01 = ta.crossover(ribbon1, ribbon2)
alert02 = bull
alert03 = wtDivBull
alert04 = wtDivBear
alert05 = bull or bear
alert06 = ta.crossover(wt1, wt2) and wt2 <= -53
alert07 = ta.crossunder(wt1, wt2) and wt2 >= 53
alert08 = ta.crossunder(ribbon1, ribbon2)
alert09 = rsiOb or rsiOs
alert10 = bear
alert11 = ta.cross(ribbon1, ribbon2)
alerts(sym) =>
if alert02 or alert03 or alert04 or alert06 or alert07 or alert10
alert_text = alert02 ? "Buy Signal EzAlgo" : alert03 ? "Strong Buy Signal EzAlgo" : alert04 ? "Strong Sell Signal EzAlgo" : alert06 ? "Mild Buy Signal EzAlgo" : alert07 ? "Mild Sell Signal EzAlgo" : "Sell Signal EzAlgo"
alert(alert_text, alert.freq_once_per_bar_close)
alerts(syminfo.tickerid)
alertcondition(alert01, "Blue Trend Ribbon Alert", "Blue Trend Ribbon, TimeFrame={{interval}}")
alertcondition(alert02, "Buy Signal", "Buy Signal EzAlgo")
alertcondition(alert03, "Divergence Buy Alert", "Strong Buy Signal EzAlgo, TimeFrame={{interval}}")
alertcondition(alert04, "Divergence Sell Alert", "Strong Sell Signal EzAlgo, TimeFrame={{interval}}")
alertcondition(alert05, "Either Buy or Sell Signal", "EzAlgo Signal")
alertcondition(alert06, "Mild Buy Alert", "Mild Buy Signal EzAlgo, TimeFrame={{interval}}")
alertcondition(alert07, "Mild Sell Alert", "Mild Sell Signal EzAlgo, TimeFrame={{interval}}")
alertcondition(alert08, "Red Trend Ribbon Alert", "Red Trend Ribbon, TimeFrame={{interval}}")
alertcondition(alert09, "Reversal Signal", "Reversal Signal")
alertcondition(alert10, "Sell Signal", "Sell Signal EzAlgo")
alertcondition(alert11, "Trend Ribbon Color Change Alert", "Trend Ribbon Color Change, TimeFrame={{interval}}")
