Bear Power Strategy Backtest Bear Power Indicator
To get more information please see "Bull And Bear Balance Indicator"
by Vadim Gimelfarb.
In den Scripts nach "bear" suchen

Bearish Engulfing Backtest This is a bearish candlestick reversal pattern formed by two candlesticks.
Following an uptrend, the first candlestick is a up candlestick which is
followed by a down candlestick which has a long real body that engulfs or
contains the real body of the prior bar. The Engulfing pattern is the reverse
of the Harami pattern.
WARNING:
- For purpose educate only
- This script to change bars colors.

Bear & Bull Zone Signal StrategySince I love to mix and match, here is something fresh and that actually works on the breakout of Ethereum without losing your ass on lagging indicators.
It blends some of the nice parts of my previous scripts while moving to big boy pants with a twist on the Fibonacci retracement using SMA and EMA at multiple levels to do a sanity check.
Is it too good to be true? Nope, just what happens when a Solution Architect starts messing around with crypto and applies engineering and mathematics to the mix. You get a strategy that really doesn't have high profit losses when you tweak it just the right way.
What's the right tweak you ask?
1. Start with a 30 minute timeframe and set your window start date to the date the market began the bear or bull run
2. Make sure you can see your strategy performance window (not the graph one)
3. Set Stop Loss and Target Profit to 50%
4. Use your mouse wheel or up and down arrows and mess around with the RSI, go down one at a time but no lower than 7. Whichever value displayed the highest long or short gain is the one to pick.
5. Now select long or short only based on whichever one shows the highest gain.
6. Now go to K and D, leave K as 3 and check what happens when D is 4 or 5. Leave D at the value that gives you the highest gain.
7. Now go to EMA Fast and Slow Lengths. Leave Fast at 5 and check what happens when the Slow is moved up to 11 or 12, do the gains go up. If not, check what happens when Slow is moved down to 9, 8, or 7. Whichever gives you the highest gain, leave it there. Now go mess with the fast length, keep in mind that fast must always be less than slow. So check values down to 3 and up to 6. Same concept, mo money...leave it be.
8. Now go mess with the Target Profit, I start at 5, hit enter, then go to 7, hit enter, then 9...up by 2 until I get to 21 to make sure I don't hastily pick a low one and always keep in mind between which values the gain switched from high to low. For example, in this example I published at 11 it was $5k and at 13 it was $3700 for the gains. So after I got up to 21 I went back to 11 and started going up by 0.01 steps until the value dropped, which was at 11.19 so I set it at 11.18.
9. Now stop loss is trickier, you've maximized the gains, which means if you set the stop loss at a low value you will sacrifice gains. Typically by this point your loss is less than 10% with this script. So, my approach is to find the value where the stop loss doesn't change what I've tweaked already. In this example, I did the same start at 5 and go up by 2 and saw that when I went to 17 it stopped changing. So I started going back down by 0.5 and saw at 15.5 the gains went lower again. Now I started going back up in steps of 0.01 and at 15.98 it went back to the high gain I already tweaked for. I kept stop loss there and unleashed the strategy on ETH.
So far so good, no bad trades and it's been behaving pretty well.

Bearish&Bullish Engulfing (created by LucaBono)Questo indicatore (o price action pattern) stampa sul grafico delle frecce o barre colorate (modificabili dalle impostazioni) quando si verificano entrambi i segnali del Bearish e Bullish Engulfing ufficiali, ovvero quando il corpo della candela è più ampio dell'intera candela precedente.
Il segnale LONG si effettua quando il massimo della Bullish bar viene rotto dalla candela successiva.
Il segnale SHORT viceversa si effettua alla rottura del minimo.
E' più facile trovare questo tipo di segnali su timefrime giornaliero e mercati come azioni, futures e titoli che non stanno aperti 24h.
Consiglio sempre di accompagnare questi segnali ad altri tipi di segnali o analisi per maggiorare le probabilità di successo e di tenuta del trade.
This indicator (or price action pattern) prints on the graph arrows or colored bars (which can be changed from the settings) when both official Bearish and Bullish Engulfing signals occur, ie when the body of the candle is wider than the entire previous candle.
The LONG signal is made when the maximum of the Bullish bar is broken by the next candle.
The SHORT signal, on the other hand, is performed when the minimum is broken.
It is easier to find this type of signals on daily timefrime and markets like stocks, futures and stocks that are not open 24h.
I always advise to accompany these signals to other types of signals or analyzes to increase the chances of success and stability of the trade.

Bearish Harami Backtest This is a bearish reversal pattern formed by two candlesticks in which a short
real body is contained within the prior session's long real body. Usually the
second real body is the opposite color of the first real body. The Harami pattern
is the reverse of the Engulfing pattern.
WARNING:
- For purpose educate only
- This script to change bars colors.

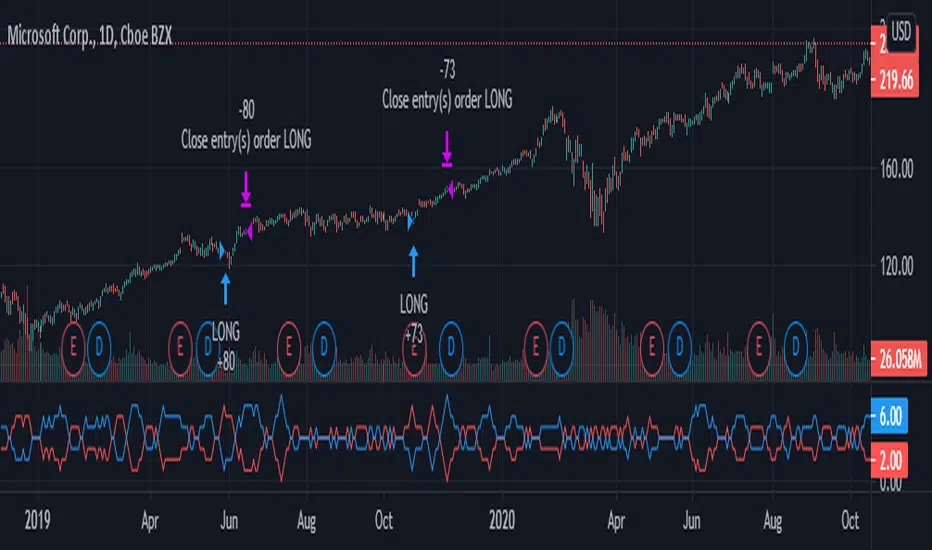
inwCoin Bullish/Bearish Divergence - Risk% StrategyEnglish
=========
inwCoin RSI Bullish/ Bearish Divergence Startegy.
RSI Bullish and Bearish divergence is a popular strategy that most people use to find the "reversal pattern" and bet on it.
...But is it really profitable in long run?
To find the answer, I write this strategy to test this hypothesis and the result is interesting.
------
How it work?
------
As you know, the main logic of bullish / bearish divergence are..
Buy Signal : RSI higher low in Oversold zone and price lower low
Sell Signal : RSI lower high in Overbought zone and price lower high
I also add some parameters to my strategy
1) Use stop loss + specific stop loss level
2) lookback period = RSI / Price lookback period to find divergence
----------
The result
----------
Not working at all.
It working ok in some period of time like in sideway market
But when uptrend established, it can't make any profit ( well, it's mean reversion strategy after all haha )
Also, when market keep crashing like in Nov 2018.
This strategy got stop out so many times before you can make 1 profitable trade....
But that trade won't last long because you have to take profit when you got bearish divergence signal.
----------
Conclusion
----------
Combine with trend following strategy.
This strategy might be able to fill the gap of sideway market.
But don't depend solely on this strategy because in long run, it can't beat the market.

Bullish and Bearish Engulfing StrategyI've been trying to put a stop loss in the High or Low of the last second bar after I open a position but in this example the only way to close it, is with the opposite action. Does anyone know how to put a stop loss and order with just stop loss and close when there is a bullish or bearish engulfing bar?

Combo 2/20 EMA & Bear Power This is combo strategies for get a cumulative signal.
First strategy
This indicator plots 2/20 exponential moving average. For the Mov
Avg X 2/20 Indicator, the EMA bar will be painted when the Alert criteria is met.
Second strategy
Bear Power Indicator
To get more information please see "Bull And Bear Balance Indicator"
by Vadim Gimelfarb.
WARNING:
- For purpose educate only
- This script to change bars colors.
Bull and Bear Fear Expert by Walter Downs StrategyBull and Bear Fear Expert by Walter Downs Strategy

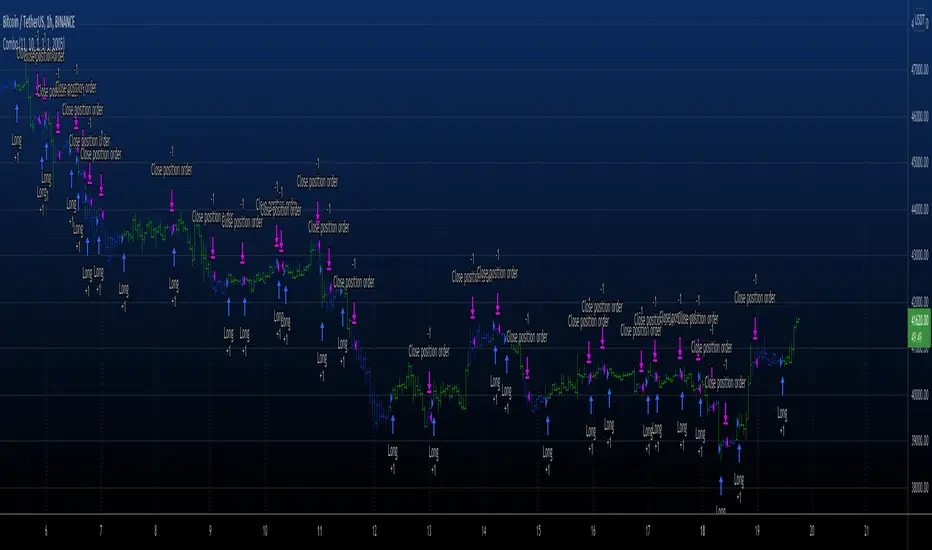
Combo Backtest 123 Reversal & Bear Power This is combo strategies for get
a cumulative signal. Result signal will return 1 if two strategies
is long, -1 if all strategies is short and 0 if signals of strategies is not equal.
First strategy
This System was created from the Book "How I Tripled My Money In The
Futures Market" by Ulf Jensen, Page 183. This is reverse type of strategies.
The strategy buys at market, if close price is higher than the previous close
during 2 days and the meaning of 9-days Stochastic Slow Oscillator is lower than 50.
The strategy sells at market, if close price is lower than the previous close price
during 2 days and the meaning of 9-days Stochastic Fast Oscillator is higher than 50.
Second strategy
Bear Power Indicator
To get more information please see "Bull And Bear Balance Indicator"
by Vadim Gimelfarb.
WARNING:
- For purpose educate only
- This script to change bars colors.

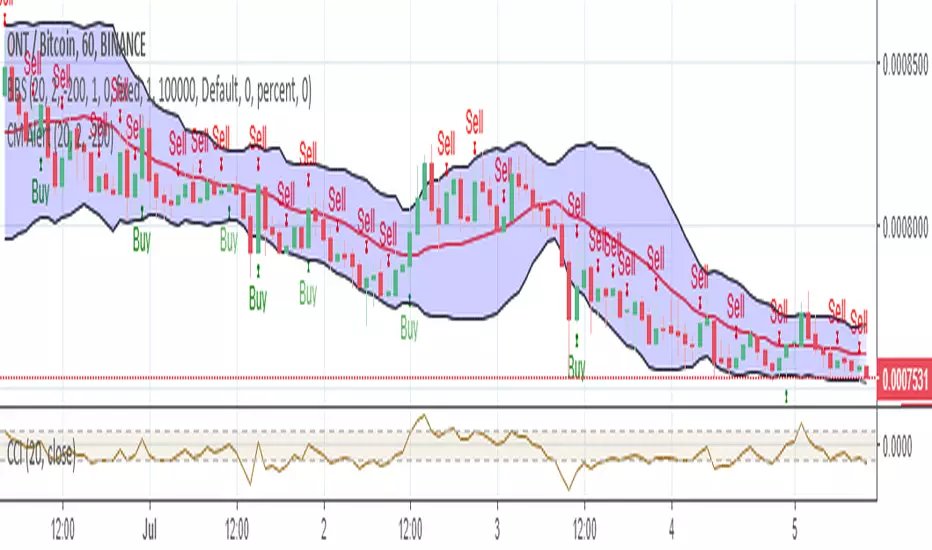
Bollinger Bear SniperThis script uses Bollinger Band but with different interpretation. The upper Bollinger Band is the resistant level, the lower Bollinger Band is the base or support level. The Commodity Channel Index (CCI) and the Bollinger Bandwidth helps us avoid high risk.
The script identifies candles that are marking bold upward moves in prices and fires buy signal. Sales signals are fired when the candle closes in positive. The idea is to buy and sell on the same candle or next positively closed candle. This is anti-bear-anti-bags strategy. You either make profit or loss holding no bag. When you gain more than lose you are in business. This script is set to gain more than lose. We however offer no guarantee, expressed or implied. We are NOT responsible.
Bull And Bear Balance Strategy Backtest This new indicator analyzes the balance between bullish and
bearish sentiment.
One can cay that it is an improved analogue of Elder Ray indicator.
To get more information please see "Bull And Bear Balance Indicator"
by Vadim Gimelfarb.
This modified strategy backtest from HPotter

Short Swing Bearish MACD Cross (By Coinrule)This strategy is oriented towards shorting during downside moves, whilst ensuring the asset is trading in a higher timeframe downtrend, and exiting after further downside.
This script can work well on coins you are planning to hodl for long-term and works especially well whilst using an automated bot that can execute your trades for you. It allows you to hedge your investment by allocating a % of your coins to trade with, whilst not risking your entire holding. This mitigates unrealised losses from hodling as it provides additional cash from the profits made. You can then choose to hodl this cash, or use it to reinvest when the market reaches attractive buying levels. Alternatively, you can use this when trading contracts on futures markets where there is no need to already own the underlying asset prior to shorting it.
ENTRY
This script utilises the MACD indicator accompanied by the Exponential Moving Average (EMA) 450 to enter trades. The MACD is a trend following momentum indicator and provides identification of short-term trend direction. In this variation it utilises the 11-period as the fast and 26-period as the slow length EMAs, with signal smoothing set at 9.
The EMA 450 is used as additional confirmation to prevent the script from shorting when price is above this long-term moving average. Once price is above the EMA 450 the script will not open any shorts - preventing the rule from attempting to short uptrends. Due to this, this strategy is ideal for setting and forgetting.
The script will enter trades based on two conditions:
1) When the MACD signals a bearish cross. This occurs when the EMA 11 crosses below the EMA 26 within the MACD signalling the start of a potential downtrend.
2) Price has closed below the EMA 450. Price closing below this long-term EMA signals that the asset is in a sustained downtrend. Price breaking above this could indicate a bullish strength in which shorting would not be profitable.
EXIT
This script utilises a set take-profit and stop-loss from the entry of the trade. The take profit is set at 8% and the stop loss of 4%, providing a risk reward ratio of 2. This indicates the script will be profitable if it has a win ratio greater than 33%.
Take-Profit Exit: -8% price decrease from entry price.
OR
Stop-Loss Exit: +4% price increase from entry price.
Based on backtesting results across a selection of assets, the 45-minute and 1-hour timeframes are the best for this strategy.
The strategy assumes each order is using 30% of the available coins to make the results more realistic and to simulate you only ran this strategy on 30% of your holdings. A trading fee of 0.1% is also taken into account and is aligned to the base fee applied on Binance.
The backtesting data was recorded from December 1st 2021, just as the market was beginning its downtrend. We therefore recommend analysing the market conditions prior to utilising this strategy as it operates best on weak coins during downtrends and bearish conditions, however the EMA 450 condition should mitigate entries during bullish market conditions.

Bears Bulls Impulse Backtest (Simple) [Loxx]Simple backtest for Bears Bulls Impulse found here:
What this backtest includes:
-Customization of inputs for MACD calculation
-Take profit 1 (TP1), and Stop-loss (SL), calculated using standard RMA-smoothed true range
-Activation of TP1 after entry candle closes
-Signal-cross entry signals
-Longs and shorts
Happy trading!

Bearish Wick Reversal█ STRATEGY OVERVIEW
The "Bearish Wick Reversal Strategy" identifies potential bullish reversals following significant bearish price rejection (long lower wicks). This counter-trend approach enters long positions when bearish candles show exaggerated downside wicks relative to closing prices, then exits on bullish confirmation signals. Includes optional EMA trend filtering for improved reliability.
█ What is a Bearish Wick?
A price rejection pattern where:
Bearish candle (close < open) forms with extended lower wick
Wick represents failed selloff: Low drops significantly below close
Measured as: (Low - Close)/Close × 100 (Negative percentage indicates downward extension)
█ SIGNAL GENERATION
1. LONG ENTRY CONDITION
Bearish candle forms with close < open
Lower wick exceeds user-defined threshold (Default: -1% of close price)
The signal occurs within the specified time window
If enabled, the close price must also be above the 200-period EMA (Exponential Moving Average)
2. EXIT CONDITION
A Sell Signal is generated when the current closing price exceeds the highest high of the previous seven bars (`close > _highest `). This indicates that the price has shown strength, potentially confirming the reversal and prompting the strategy to exit the position.
█ PERFORMANCE OVERVIEW
Ideal Market: Volatile instruments with frequent price rejections
Key Risk: False signals in sustained bearish trends
Optimization Tip: Test various thresholds
Filter Impact: EMA reduces trades but improves win rate and reduces drawdown

Bearish Bars Uptrend StrategyThe strategy is based on the number of bearish bars or bullish bars of the last 8 bars. Additionally it uses a filter of the moving average of 240 bars.
The idea of the strategy is based on pullbacks in uptrends. The buy signal is given when there are 7 bearish bars of the last 8 bars and the price is above the moving average. The operation is closed when there are 7 bulls of the last 8 bars.
The strategy in the majority of assets has a hit rate of around 60% in daily timefrime. Although since it does not have a stop and the closing signal may not occur even if the asset is going down, there are trades that can be losers with 70% to 80% negative performance. That is why money management is essential to be able to take advantage of the system correctly.
Short Selling EMA Cross (By Coinrule)BINANCE:AVAXUSDT
This short selling script works best in periods of downtrends and general bearish market conditions, with the ultimate goal to sell as the the price decreases further and buy back before a rebound.
This script can work well on coins you are planning to hodl for long-term and works especially well whilst using an automated bot that can execute your trades for you. It allows you to hedge your investment by allocating a % of your coins to trade with, whilst not risking your entire holding. This mitigates unrealised losses from hodling as it provides additional cash from the profits made. You can then choose to to hodl this cash, or use it to reinvest when the market reaches attractive buying levels.
Entry
The exponential moving average ( EMA ) 20 and EMA 50 have been used for the variables determining the entry to the short. EMAs can operate better than simple moving averages due to the additional weighting placed on the most recent data points, whereas simple moving averages weight all the data the same. This means that price is tracked more closely and the most recent volatile moves can be captured and exploited more efficiently using EMAs.
Our backtesting data revealed that the most profitable timeframe was the 30-minute timeframe, this also enabled a good frequency of trades and high profitability.
A fast (shorter term) exponential moving average , in this strategy the EMA 20, crossing under a slow (longer term) moving average, in this example the EMA 50, signals the price of an asset has started to trend to the downside, as the most recent data signals price is declining compared to earlier data. The entry acts on this principle and executes when the EMA 20 crosses under the EMA 50.
Enter Short: EMA 20 crosses under EMA 50.
Exit
This script utilises a take profit and stop loss for the exit. The take profit is set at -8% and the stop loss is set at +16% from the entry price. This would normally be a poor trade due to the risk:reward equalling 0.5. However, when looking at the backtesting data, the high profitability of the strategy (93.33%) leads to increased confidence and showcases the high probability of success according to historical data.
The take profit (-8%) and the stop loss (+16%) of the strategy are widely placed to ensure the move is captured without being stopped out due to relief rallies. The stop loss also plays a role of mitigating losses and minimising risk of being stuck in a short position once there has been a fundamental trend reversal and the market has become bullish .
Exit Short: -8% price decrease from entry price.
OR
Exit Short: +16% price increase from entry price.
Tip: Research what coins have consistent and large token unlocks / highly inflationary tokenomics, and target these during bear markets to short as they will most likely have substantial selling pressure that outweighs demand - leading to declining prices.
The strategy assumes each order is using 30% of the available coins to make the results more realistic and to simulate you only ran this strategy on 30% of your holdings. A trading fee of 0.1% is also taken into account and is aligned to the base fee applied on Binance.
The backtesting data was recorded from December 1st 2021, just as the market was beginning its downtrend. We therefore recommend analysing the market conditions prior to utilising this strategy as it operates best on weak coins during downtrends and bearish conditions.

BTC Precognition - Mtrl_ScientistHello Everyone,
I have been interested in algorithmic trading for a while now, and have picked up coding in Python/C++ 2 years ago, which made it possible for me to understand Pine Script (Trading View's proprietary language) fairly easily. I got interested in Bitcoin in 2013, but have only started actually investing in mid 2017. Making money during a bull run is easy but it's really the bear market that teaches you a lesson. So I went about and tried to avoid losses in future bear markets by digging into the analysis of financial time series. I looked around and found useful books, examples of pine script code, technical analyses from fellow chartists and sought out to combine it all into algorithms that can help prevent losses during the next bear market.
I came up with several profitable scripts, but let this be the first one I'm actually sharing with you guys. It draws data from all major Bitcoin exchanges (Hence this script will ONLY work for BTCUSD ) and is based on CVI, Fractal Adaptive Moving Avergage ( FRAMA ), and some calculus operations to make sense of their relationship.
I tried to tidy the final version up as much as possible, so that it becomes straightforward to use. All you need to look at is when the bar becomes green/red, the bar height is just the integrated area since it's crossed the 0-line and can serve as a threshold on lower time frames to avoid noise.
I've got a degree in Chemistry, so don't take this as financial advice, but please do let me know what you think!
Note:
- This is a re-upload because the first version got pulled due to linking to Twitter
- Script works best with Hekin Ashi candles
Planned features:
- Reduce amount of signals on lower time frames
- Make it work better with normal candles
Suggestions?

Price Action StrategyThe **Price Action Strategy** is a tool designed to capture potential market reversals by utilizing classic reversal candlestick patterns such as Hammer, Shooting Star, Doji, and Pin Bar near dinamic support and resistance levels.
***Note to moderators
- The moving average was removed from the strategy because it was not suitable for the strategy and not participating in the entry or exit criteria.
- The moving average length has been replaced/renamed by the support/resistance lenght.
- The bullish engulfing and bearish engulfing patterns were also removed because in practice they were not working as entry criteria, since the candle price invariably closes far from the support/resistance level even considering the sensitivity range. There was no change in the backtest results after removing these patterns.
### Key Elements of the Strategy
1. Support and Resistance Levels
- Support and resistance are pivotal price levels where the asset has previously struggled to move lower (support) or higher (resistance). These levels act as psychological barriers where buying interest (at support) or selling interest (at resistance) often increases, potentially causing price reversals.
- In this strategy, support is calculated as the lowest low and resistance as the highest high over a 16-period length. When the price nears these levels, it indicates possible zones for a reversal, and the strategy looks for specific candlestick patterns to confirm an entry.
2. Candlestick Patterns
- This strategy uses classic reversal patterns, including:
- **Hammer**: Indicates a buy signal, suggesting rejection of lower prices.
- **Shooting Star**: Suggests a sell signal, showing rejection of higher prices.
- **Doji**: Reflects indecision and potential reversal.
- **Pin Bar**: Represents price rejection with a long shadow, often signaling a reversal.
By combining these reversal patterns with the proximity to dinamic support or resistance levels, the strategy aims to capture potential reversal movements.
3. Sensitivity Level
- The sensitivity parameter adjusts the acceptable range (Default 0.018 = 1.8%) around support and resistance levels within which reversal patterns can trigger trades (i.e. the closing price of the candle must occur within the specified range defined by the sensitivity parameter). A higher sensitivity value expands this range, potentially leading to less accurate signals, as it may allow for more false positives.
4. Entry Criteria
- **Buy (Long)**: A Hammer, Doji, or Pin Bar pattern near support.
- **Sell (Short)**: A Shooting Star, Doji, or Pin Bar near resistance.
5. Exit criteria
- Take profit = 9.5%
- Stop loss = 16%
6. No Repainting
- The Price Action Strategy is not subject to repainting.
7. Position Sizing by Equity and risk management
- This strategy has a default configuration to operate with 35% of the equity. The stop loss is set to 16% from the entry price. This way, the strategy is putting at risk about 16% of 35% of equity, that is, around 5.6% of equity for each trade. The percentage of equity and stop loss can be adjusted by the user according to their risk management.
8. Backtest results
- This strategy was subjected to deep backtest and operations in replay mode on **1000000MOGUSDT.P**, with the inclusion of transaction fees at 0.12% and slipagge of 5 ticks, and the past results have shown consistent profitability. Past results are no guarantee of future results. The strategy's backtest results may even be due to overfitting with past data.
9. Chart Visualization
- Support and resistance levels are displayed as green (support) and red (resistance) lines.
- Only the candlestick pattern that generated the entry signal to triger the trade is identified and labeled on the chart. During the operation, the occurrence of new Doji, Pin Bar, Hammer and Shooting Star patterns will not be demonstrated on the chart, since the exit criteria are based on percentage take profit and stop loss.
Doji:
Pin Bar and Doji
Shooting Star and Doji
Hammer
10. Default settings
Chart timeframe: 20 min
Moving average lenght: 16
Sensitivity: 0.018
Stop loss (%): 16
Take Profit (%): 9.5
BYBIT:1000000MOGUSDT.P

Inverse MACD + DMI Scalping with Volatility Stop (By Coinrule)This script is focused on shorting during downtrends and utilises two strength based indicators to provide confluence that the start of a short-term downtrend has occurred - catching the opportunity as soon as possible.
This script can work well on coins you are planning to hodl for long-term and works especially well whilst using an automated bot that can execute your trades for you. It allows you to hedge your investment by allocating a % of your coins to trade with, whilst not risking your entire holding. This mitigates unrealised losses from hodling as it provides additional cash from the profits made. You can then choose to hodl this cash, or use it to reinvest when the market reaches attractive buying levels.
Alternatively, you can use this when trading contracts on futures markets where there is no need to already own the underlying asset prior to shorting it.
ENTRY
The trading system uses the Momentum Average Convergence Divergence (MACD) indicator and the Directional Movement Index (DMI) indicator to confirm when the best time is for selling. Combining these two indicators prevents trading during uptrends and reduces the likelihood of getting stuck in a market with low volatility.
The MACD is a trend following momentum indicator and provides identification of short-term trend direction. In this variation it utilises the 12-period as the fast and 26-period as the slow length EMAs, with signal smoothing set at 9.
The DMI indicates what way price is trending and compares prior lows and highs with two lines drawn between each - the positive directional movement line (+DI) and the negative directional movement line (-DI). The trend can be interpreted by comparing the two lines and what line is greater. When the negative DMI is greater than the positive DMI, there are more chances that the asset is trading in a sustained downtrend, and vice versa.
The system will enter trades when two conditions are met:
1) The MACD histogram turns bearish.
2) When the negative DMI is greater than the positive DMI.
EXIT
The strategy comes with a fixed take profit combined with a volatility stop, which acts as a trailing stop to adapt to the trend's strength. Depending on your long-term confidence in the asset, you can edit the fixed take profit to be more conservative or aggressive.
The position is closed when:
Take-Profit Exit: +8% price decrease from entry price.
OR
Stop-Loss Exit: Price crosses above the volatility stop.
In general, this approach suits medium to long term strategies. The backtesting for this strategy begins on 1 April 2022 to 18 July 2022 in order to demonstrate its results in a bear market. Back testing it further from the beginning of 2022 onwards further also produces good returns.
Pairs that produce very strong results include SOLUSDT on the 45m timeframe, MATICUSDT on the 2h timeframe, and AVAUSDT on the 1h timeframe. Generally, the back testing suggests that it works best on the 45m/1h timeframe across most pairs.
A trading fee of 0.1% is also taken into account and is aligned to the base fee applied on Binance.

Relativity BEARS FOREX 50X 4H AlgorithmHello, this script is the correction of my old script related to Forex. (Bear market)
Old script :
4H was chosen as the time frame.
Thus, larger pips are at our disposal and we benefit more from the hedge effect of the leverage.
Commissions per trade have been removed to get more realistic commissions.
Because every wrong trade deletes all the 1% position size.
(with leverage effect)
Use the links below to obtain access to this indicator :

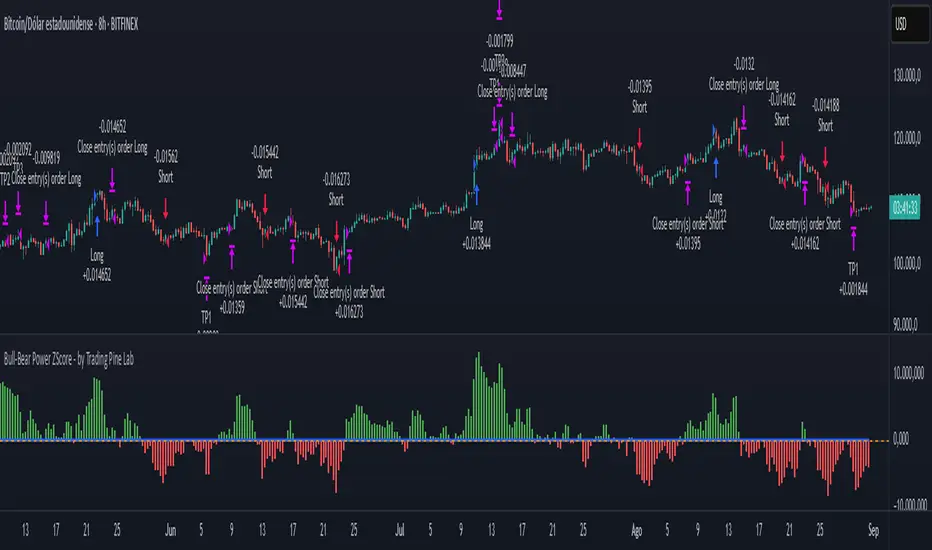
Bull-Bear Power ZScore - by Trading Pine Lab🇬🇧
The Bull-Bear Power ZScore Strategy is an advanced trading framework that integrates Bull-Bear Power (BBP) with a statistical Z-Score model.
BBP measures the relative strength of buyers vs. sellers against an EMA baseline, while the Z-Score standardizes this relationship to detect statistically significant breakouts.
This dual-layer approach provides early trend detection while reducing noise from raw momentum signals.
Entries are triggered when the Z-Score crosses above or below its threshold (long above +T, short below –T). Exits occur when the Z-Score crosses back to zero, ensuring trades close when momentum fades.
A dynamic multi-level take-profit system is integrated, using ATR-based targets (TP1, TP2, TP3) that automatically adapt to **volume context** (high/medium/low) and **percentile analysis** (distribution of price and volume).
This ensures profit targets stretch in strong environments and tighten in weaker conditions, optimizing both risk and reward.
All parameters are fully configurable:
-Bull-Bear Power Settings: EMA length, Z-Score length, Z-Score threshold.
-Take Profit Settings: enable/disable TP system, ATR period, TP1–TP3 multipliers, TP1–TP3 position sizes.
-Volume Analysis: volume MA period, high/medium/low multipliers, adjustment factors.
-Percentile Analysis: percentile lookback period, high/medium/low thresholds, adjustment factors.
WODIsMA Strategy 3 MA Crossover & Bull-Bear Trend ConfirmationWODIsMA Strategy is a versatile trading strategy designed to leverage the strength of moving averages and volatility indicators to provide clear trading signals for both long and short positions. This strategy is suitable for traders looking for a systematic approach to trading with adjustable parameters to fit various market conditions and personal trading styles.
Key Features
Customizable Moving Averages:
The strategy allows users to select different types of moving averages (SMA, EMA, SMMA, WMA, VWMA) for short-term, mid-term, long-term, and bull-bear trend identification.
Each moving average can be customized with different lengths, sources (e.g., close, high, low), timeframes, and colors.
Position Management:
Users can specify the percentage of capital to use per trade and the percentage to close per partial exit.
The strategy supports both long and short positions with the ability to enable or disable each direction.
Volatility Filter:
Incorporates a volatility filter to ensure trades are only taken when market volatility is above a user-defined threshold, enhancing the strategy's effectiveness in dynamic market conditions.
Bull-Bear Trend Line:
Option to enable a bull-bear trend line that helps identify the overall market trend. Trades are taken based on the relationship between the long-term moving average and the bull-bear trend line.
Partial Exits and Full Close Logic:
The strategy includes logic for partial exits based on the crossing of mid-term and long-term moving averages.
Ensures that positions are fully closed when adverse conditions are detected, such as the price crossing below the bull-bear trend line.
Stop Loss Management:
Implements user-defined stop loss levels to manage risk effectively. The stop loss is dynamically adjusted based on the entry price and user input.
Detailed Description
Moving Average Calculation: The strategy calculates up to six different moving averages, each with customizable parameters. These moving averages help identify the short-term, mid-term, long-term trends, and overall market direction.
Trading Signals:
Long Signal: A long position is opened when the short-term moving average is above the long-term moving average, and the mid-term moving average crosses above the long-term moving average.
Short Signal: A short position is opened when the short-term moving average is below the long-term moving average, and the mid-term moving average crosses below the long-term moving average.
Volatility Condition: The strategy includes a volatility filter that activates trades only when volatility exceeds a specified threshold, ensuring trades are made in favorable market conditions.
Bull-Bear Trend Confirmation: When enabled, trades are filtered based on the relationship between the long-term moving average and the bull-bear trend line, adding another layer of confirmation.
Stop Loss and Exits:
The strategy manages risk by placing stop loss orders based on user-defined percentages.
Positions are partially or fully closed based on the crossing of moving averages and the relationship with the bull-bear trend line.
Originality and Usefulness
This strategy is original as it combines multiple moving averages and volatility indicators in a structured manner to provide reliable trading signals. Its versatility allows traders to adjust the parameters to match their trading preferences and market conditions. The inclusion of a volatility filter and bull-bear trend line adds significant value by reducing false signals and ensuring trades are taken in the direction of the overall market trend. The detailed descriptions and customizable settings make this strategy accessible and understandable for traders, even those unfamiliar with the underlying Pine Script code.
By providing clear entry, exit, and risk management rules, the WODIsMA Strategy enhances the trader's ability to navigate different market environments, making it a valuable addition to the TradingView community scripts.
