Imbalance RSI Divergence Strategy# Imbalance RSI Divergence Strategy - User Guide
## What is This Strategy?
This strategy identifies **imbalance** zones in the market and combines them with **RSI divergence** to generate trading signals. It aims to capitalize on price gaps left by institutional investors and large volume movements.
### Main Settings
- **RSI Period (14)**: Period used for RSI calculation. Lower values = more sensitive, higher values = more stable signals.
- **ATR Period (10)**: Period for volatility measurement using Average True Range.
- **ATR Stop Loss Multiplier (2.0)**: How many ATR units to use for stop loss calculation.
- **Risk:Reward Ratio (4.0)**: Risk-reward ratio. 2.0 = 2 units of reward for 1 unit of risk.
- **Use RSI Divergence Filter (true)**: Enables/disables the RSI divergence filter.
### Imbalance Filters
- **Minimum Imbalance Size (ATR) (0.3)**: Minimum imbalance size in ATR units to filter out small imbalances.
- **Enable Lookback Limit (false)**: Activates historical lookback limitations.
- **Maximum Lookback Bars (300)**: Maximum number of bars to look back.
### Visual Settings
- **Show Imbalance Size**: Displays imbalance size in ATR units.
- **Show RSI Divergence Lines**: Shows/hides divergence lines.
- **Divergence Line Colors**: Colors for bullish/bearish divergence lines.
### Volatility-Based Adjustments
- **Low volatility markets**:
- Minimum Imbalance Size: 0.2-0.4 ATR
- ATR Stop Loss Multiplier: 1.5-2.0
- **High volatility markets**:
- Minimum Imbalance Size: 0.5-1.0 ATR
- ATR Stop Loss Multiplier: 2.5-3.5
### Risk Tolerance
- **Conservative approach**:
- Risk:Reward Ratio: 2.0-3.0
- RSI Divergence Filter: Enabled
- Minimum Imbalance Size: Higher (0.5+ ATR)
- **Aggressive approach**:
- Risk:Reward Ratio: 4.0-6.0
- Minimum Imbalance Size: Lower (0.2-0.3 ATR)
###Market Conditions
- **Trending markets**: Higher RSI Period (21-28)
- **Sideways markets**: Lower RSI Period (10-14)
- **Volatile markets**: Higher ATR Multiplier
## Recommended Testing Procedure
1. **Start with default settings** and backtest on 3-6 months of historical data
2. **Adjust RSI Period** to see which value produces better results
3. **Optimize ATR Multiplier** for stop loss levels
4. **Test different Risk:Reward ratios** comparatively
5. **Fine-tune Minimum Imbalance Size** to improve signal quality
## Important Considerations
- **False positive signals**: Imbalances may be less reliable during low volatility periods
- **Market openings**: First hours often produce more imbalances but can be riskier
- **News events**: Consider disabling strategy during major news releases
- **Backtesting**: Test across different market conditions (trending, sideways, volatile)
## Recommended Settings for Beginners
**Safe settings for new users:**
- RSI Period: 14
- ATR Period: 14
- ATR Stop Loss Multiplier: 2.5
- Risk:Reward Ratio: 3.0
- Minimum Imbalance Size: 0.5 ATR
- RSI Divergence Filter: Enabled
## Advanced Tips
### Signal Quality Improvement
- **Combine with market structure**: Look for imbalances near key support/resistance levels
- **Volume confirmation**: Higher volume during imbalance formation increases reliability
- **Multiple timeframe analysis**: Confirm signals on higher timeframes
### Risk Management
- **Position sizing**: Never risk more than 1-2% of account per trade
- **Maximum drawdown**: Set overall stop loss for the strategy
- **Market hours**: Consider avoiding low liquidity periods
### Performance Monitoring
- **Win rate**: Track percentage of profitable trades
- **Average R:R**: Monitor actual risk-reward achieved vs. target
- **Maximum consecutive losses**: Set alerts for strategy review
This strategy works best when combined with proper risk management and market analysis. Always backtest thoroughly before using real money and adjust parameters based on your specific market and trading style.
In den Scripts nach "bar" suchen

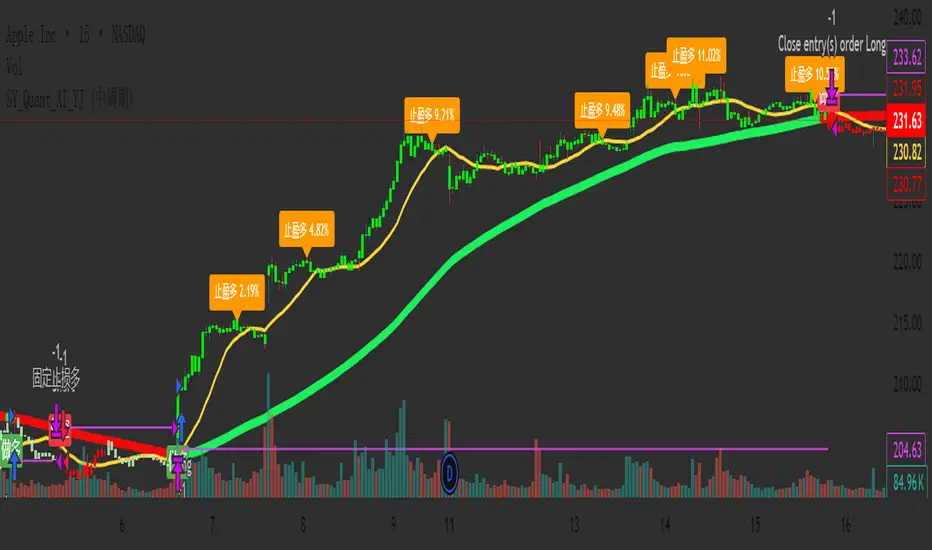
SY_Quant_AI_YJ✅ Improved and Compliant Description (for SY_Quant_AI_YJ)
Strategy Name: SY_Quant_AI_YJ
Type: Visual Trend System + MACD Cycle Filter + Smart Alerts
Status: Invite-Only / Visualization & Alerts Only (No order execution)
📌 Overview:
SY_Quant_AI_YJ is a trend-following visual strategy and alert system designed to help traders detect directional bias, time entries with MACD cross logic, and receive structured JSON-format push alerts. It combines Supertrend, EMA/SMA structures, and MACD cycles to build a coherent and actionable trend view, enhanced by visual stop-loss guidance and profit-taking alerts.
🔍 Core Logic:
This script integrates technical components into a multi-step trend confirmation framework:
Supertrend (ATR-based): Serves as the primary trend filter, reducing noise and false breakouts.
EMA-55, SMA-15, SMA-80: Help establish short- to mid-term trend structure.
MACD Cycle Crosses: Configurable for long, medium, or short cycles to adapt to different market phases.
Bar Coloring System: Highlights trend strength (e.g., green for strong bullish, red for bearish), assisting in quick decision-making.
Signal Confirmation: Entry signals (long/short) are confirmed by trend alignment, price structure, and MACD cycle phase.
⚙️ Default Settings:
Supertrend: ATR period 15, multiplier 3.1
MACD Mode: Selectable via dropdown (Long, Medium, Short Cycle)
Stop-Loss Logic: Automatically tied to Supertrend value at entry bar
Signal Filtering: Consecutive same-direction entries are blocked to avoid redundancy
No trading simulation: Entries and exits are visual only; alerts replace real trade execution
📈 Usage:
Long/Short signals are displayed using labelup / labeldown markers (“做多” / “做空”)
JSON-format alerts are triggered for:
✅ Entry zones (including stop-loss and entry range)
✅ Profit-taking when MACD reverses and position is floating in profit
Stop-loss guide lines plotted dynamically during active positions
Suitable for use on 15-minute to 4-hour charts
⚠️ Disclaimer:
This strategy does not simulate or execute trades. It is designed for monitoring and decision support only. All signals are informational and should be used alongside proper risk management and independent analysis. Past visual or alert performance does not guarantee future results.
🔑 Access:
To gain access to this invite-only script, please send a private message or contact us via the designated link. Access is reviewed and granted manually per user request.
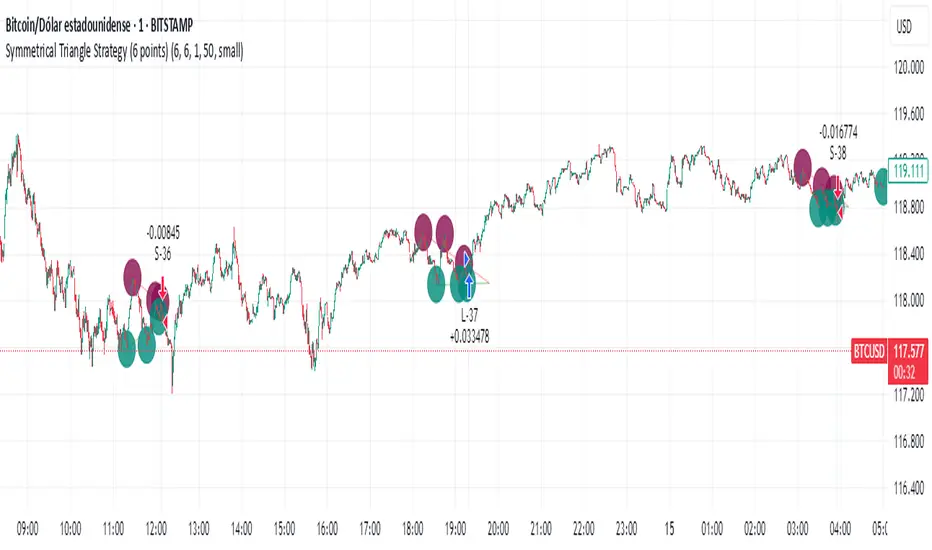
Simple Symmetrical Triangle Strategy (6 points)Overview
This strategy identifies triangle patterns formed by a series of key high and low price points. A trade is triggered when the price breaks out from the pattern's final confirmation points: a buy signal occurs on a close above the last high point, and a sell signal on a close below the last low point. To ensure relevance, any pattern that doesn't break out within 10 bars is automatically discarded.
This helps filter out patterns that lose momentum and focuses only on the most imminent breakouts.
How It Works
1. Pattern Detection: The script continuously scans for a sequence of three declining highs (points H1, H2, H3) and three rising lows (points L1, L2, L3) to form a triangle.
2. Entry Logic: The logic is straightforward and based on breaking the last confirmed pivot:
* Long Entry: A buy order is executed if the price closes above the level of the last high (H3).
* Short Entry: A sell order is executed if the price closes below the level of the last low (L3).
3. Pattern Expiration: A triangle only remains "active" for 10 bars after its formation. If a breakout doesn't occur within this window, the pattern is removed from analysis, avoiding trades on prolonged, unresolved consolidations.
Key Features
* Automatic Detection: Identifies and draws triangles for you.
* Simple Breakout Logic: Easy to understand, trades by following the price action.
* Time Filter: Its main advantage is discarding patterns that do not resolve quickly.
* Customizable: You can adjust the sensitivity of the pivot detection in the settings.
Important Disclaimer
This strategy is designed as an entry system and DOES NOT INCLUDE A STOP LOSS OR TAKE PROFIT.
Automation Ready
Want to automate this or ANY strategy on your broker or MetaTrader (MT4/MT5) without keeping your computer on or needing a VPS? You can use WebhookTrade.
No Wick Strategy (No-wick candles) — by Sh1n1gam1**No Wick Strategy - Momentum Trading System**
This strategy identifies and trades "no wick" or "minimal wick" candles, which often indicate strong directional momentum and conviction in the market.
**STRATEGY CONCEPT:**
The No Wick Strategy capitalizes on candles that show strong directional commitment - bullish candles with little to no bottom wick (buyers in control from the start) and bearish candles with little to no top wick (sellers dominating from the open).
**HOW IT WORKS:**
📈 **LONG ENTRIES:**
- Identifies bullish candles with minimal/no bottom wick
- Places buy limit order slightly below the signal candle's open
- Enters only during specified trading session
📉 **SHORT ENTRIES:**
- Identifies bearish candles with minimal/no top wick
- Places sell limit order slightly above the signal candle's close
- Enters only during specified trading session
**KEY FEATURES:**
✅ Customizable trading session (New York timezone)
✅ Flexible wick threshold (0% for strict, up to X% for flexibility)
✅ ATR-based stop loss for dynamic risk management
✅ Configurable risk-reward ratio via TP multiplier
✅ Auto-cancellation of unfilled orders after X bars
✅ Body size filters (minimum and maximum)
✅ Visual signals and pending order levels
✅ Position status display
**RISK MANAGEMENT:**
- Stop Loss: Based on ATR multiplier
- Take Profit: Multiple of stop loss distance
- One position at a time
- No pyramiding or position flipping
**RECOMMENDED TIMEFRAMES:**
- M1 and M5 for scalping
- M15 and H1 for day trading
- H4 and Daily for swing trading
**MARKETS:**
Suitable for forex pairs, indices (NQ, ES), commodities, and liquid stocks.
**DEFAULT SETTINGS:**
- Trading Session: 09:30-11:00 ET (NY morning session)
- ATR SL Multiplier: 1.5
- TP Multiplier: 2.0 (2:1 RR ratio)
- Wick Threshold: 5%
- Order Cancellation: 5 bars
**TIPS FOR OPTIMIZATION:**
1. Adjust trading session to match your market's most active hours
2. Test different wick thresholds (0-10%) based on market volatility
3. Optimize body size filters for your specific instrument
4. Backtest different ATR multipliers for your risk tolerance
5. Consider market conditions - works best in trending markets
**IMPORTANT NOTES:**
- Uses limit orders for better entry prices
- Does not close opposing positions (no position flipping)
- Respects trading session boundaries strictly
- All times are in America/New_York timezone
**AUTHOR:** Sh1n1gam1
**VERSION:** 1.0
**SUPPORT:** Comments and suggestions welcome!
Happy Trading! 📊

Parallax Momentum MNQ Strategy# 📈 Parallax Momentum MNQ Strategy
## Overview
The Parallax Momentum MNQ Strategy is a sophisticated support/resistance breakout system specifically designed for Micro Nasdaq futures (MNQ) trading (also works on minis). This strategy combines dynamic level detection with momentum confirmation to identify high-probability entry opportunities while maintaining strict risk management protocols.
## 🎯 Key Features
### Core Strategy Logic
- **Dynamic Support/Resistance Detection**: Automatically identifies key levels using configurable lookback periods
- **Momentum Confirmation**: Volume-based filtering ensures trades align with market momentum
- **ATR-Based Risk Management**: Adaptive stop losses and take profits based on market volatility
- **Dual Entry System**: Both long and short opportunities with limit order execution
### Risk Management
- **ATR-Adaptive Stops**: Stop losses and take profits automatically adjust to market volatility
- **Reward-to-Risk Ratios**: Configurable R:R ratios with default 2:1 minimum
- **Maximum Loss Protection**: Optional daily loss limits to prevent overtrading
- **Session Time Filtering**: Trade only during specified market hours
### Strategy Modes
- **Conservative Mode**: 0.8x risk multiplier for cautious trading
- **Balanced Mode**: Standard 1.0x risk multiplier (default)
- **Aggressive Mode**: 1.2x risk multiplier for active trading
## 📊 Visual Features
### Dashboard Display
- Real-time strategy status and performance metrics
- Current support/resistance levels and ATR values
- Live risk-to-reward ratios for potential trades
- Win rate, profit factor, and drawdown statistics
- Adjustable dashboard size and positioning
### Chart Indicators
- Support and resistance lines with labels
- ATR-based levels (+/-1 ATR and +/-2 ATR)
- Dynamic visual updates as levels change
- Configurable line extensions and styling
## ⚙️ Configuration Options
### Entry Filters
- **Volume Filter**: Optional volume confirmation above SMA
- **Session Time Filter**: 12-hour format time restrictions
- **ATR vs Fixed Stops**: Choose between adaptive or fixed tick-based exits
### Risk Controls
- **ATR Period**: Default 14-period ATR calculation
- **Stop Loss Multiplier**: ATR-based stop distance (default 1.5x)
- **Take Profit Multiplier**: ATR-based target distance (default 1.5x)
- **Secondary Take Profit**: Optional TP2 with position scaling
## 📋 How It Works
### Entry Conditions
**Long Trades**: Triggered when price closes above support buffer but low touches support level, with volume and session confirmation
**Short Trades**: Triggered when price closes below resistance buffer but high touches resistance level, with volume and session confirmation
### Exit Strategy
- **Primary Take Profit**: ATR-based target with 2:1 R:R minimum
- **Stop Loss**: ATR-based protective stop
- **Optional TP2**: Extended target for partial profit taking
- **One Trade at a Time**: No overlapping positions
## 🎛️ Default Settings
- **Lookback Period**: 20 bars for support/resistance detection
- **ATR Period**: 14 bars for volatility calculation
- **Stop Loss**: 1.5x ATR from entry
- **Take Profit**: 1.5x ATR with 2:1 reward-to-risk ratio
- **Session**: 7:30 AM - 2:00 PM (configurable)
## ⚠️ Important Notes
### Risk Disclaimer
- This strategy is for educational and informational purposes only
- Past performance does not guarantee future results
- Always use proper position sizing and risk management
- Test thoroughly on historical data before live trading
- Consider market conditions and volatility when using
### Best Practices
- Backtest on sufficient historical data
- Start with conservative mode for new users
- Monitor performance regularly and adjust parameters as needed
- Use appropriate position sizing for your account
- Consider broker commissions and slippage in live trading
## 🔧 Customization
The strategy offers extensive customization options including:
- Adjustable time sessions with AM/PM format
- Configurable ATR and risk parameters
- Optional maximum daily loss limits
- Dashboard size and position controls
- Visual element toggles and styling
## 📈 Ideal For
- MNQ (Micro Nasdaq) futures traders
- Intraday momentum strategies
- Traders seeking systematic entry/exit rules
- Risk-conscious traders wanting automated stops
- Both beginner and experienced algorithmic traders
---
**Version**: Pine Script v5 Compatible
**Timeframe**: Works on multiple timeframes (test on 1m, 3m, 5m, 15m)
**Market**: Optimized for MNQ but adaptable to other instruments
**Strategy Type**: Trend following with momentum confirmation

Modular Range-Trading Strategy (V9.2)# 模块化震荡行情策略 (V9.2)
# Modular Range-Trading Strategy (V9.2)
## 策略简介 | Strategy Overview
该策略基于布林带 (Bollinger Bands)、RSI、MACD、ADX 等经典指标的组合,通过多逻辑模块化结构识别震荡区间的价格反转机会,支持多空双向操作,并在相同逻辑下允许智能加仓,适用于震荡市场的回测和研究。
This strategy combines classic indicators such as Bollinger Bands, RSI, MACD, and ADX to identify price reversal opportunities within ranging markets. It features a modular multi-logic structure, allowing both long and short trades with intelligent pyramiding under the same logic. It is designed for backtesting and research in range-bound conditions.
---
## 功能特点 | Key Features
- **多逻辑结构**:支持多套震荡逻辑(动能确认均值回归、布林带极限反转等)。
- **加仓与仓位互斥**:同逻辑下可智能加仓,不同逻辑间自动互斥,避免冲突。
- **回测可调时间范围**:可自定义回测起止时间,精准评估策略表现。
- **指标可视化**:布林带、RSI、MACD 及动态 ATR 止损线实时绘图。
- **K线收盘确认信号**:通过 `barstate.isconfirmed` 控制信号,避免未收盘的虚假信号。
- **Multi-logic structure**: Supports multiple range-trading logics (e.g., momentum-based mean reversion, Bollinger Band reversals).
- **Pyramiding with mutual exclusion**: Allows intelligent pyramiding within the same logic while preventing conflicts between different logics.
- **Adjustable backtesting range**: Customizable start and end dates for accurate performance evaluation.
- **Visual indicators**: Real-time plotting of Bollinger Bands, RSI, MACD, and dynamic ATR stop lines.
- **Close-bar confirmation**: Uses `barstate.isconfirmed` to avoid false signals before bar close.
---
## 使用说明 | Usage
1. 将该脚本添加到 TradingView 图表。
2. 在参数中设置回测时间段和指标参数。
3. 仅用于学习与策略研究,请勿直接用于实盘交易。
1. Add this script to your TradingView chart.
2. Configure backtesting dates and indicator parameters as needed.
3. For educational and research purposes only. **Not for live trading.**
---
## ⚠️ 免责声明 | Disclaimer
本策略仅供学习和研究使用,不构成任何形式的投资建议。
作者不参与任何实盘交易、资金管理或收益分成,也不保证策略盈利能力。
严禁将本脚本用于任何非法集资、私募募资或与虚拟货币相关的金融违法活动。
使用本策略即表示您自行承担所有风险与法律责任。
This strategy is for educational and research purposes only and does not constitute investment advice.
The author does not participate in live trading, asset management, or profit sharing, nor guarantee profitability.
The use of this script in illegal fundraising, private placements, or cryptocurrency-related financial activities is strictly prohibited.
By using this strategy, you accept all risks and legal responsibilities.
---

ICT OTE StrategyStrategy Overview
This strategy is designed to automate a specific trading setup based on the concepts of Inner Circle Trader (ICT). Its primary goal is to identify significant market structure swings, frame a Fibonacci retracement over the most recent price leg, and execute a trade when the price pulls back to a key user-defined level. It is a counter-trend entry strategy, meaning it looks to enter a trade during a pullback within an established trend.
How It Works: Step-by-Step
1. Swing Detection:
The strategy first identifies significant swing highs and swing lows.
A swing high is confirmed only if it's higher than a specific number of bars to its left and right (defined by "Left Strength" and "Right Strength" in the settings).
The same logic applies to swing lows, which must be lower than the bars around them. This filtering ensures only structurally important turning points are considered.
2. Defining the Trading Range:
Once a new swing is confirmed, the strategy defines the most recent dealing range.
If a new swing high forms, the range is drawn from the previous swing low up to this new high. This is considered a bullish leg.
If a new swing low forms, the range is drawn from the previous swing high down to this new low. This is considered a bearish leg.
3. Fibonacci Retracement & Trade Setup:
An automatic Fibonacci retracement tool is drawn over this newly defined dealing range. The 0.0 level is placed at the end of the move, and the 1.0 level is at the beginning.
The strategy then prepares to enter a trade based on this range.
4. Trade Execution:
Entry: A limit order is placed at a specific Fibonacci level within the range, waiting for the price to retrace. The default entry is the 0.618 level, but this can be changed in the settings.
For a bullish leg, it places a LONG (Buy) order, anticipating that the price will bounce from the retracement level.
For a bearish leg, it places a SHORT (Sell) order, anticipating that the price will be rejected from the retracement level.
Stop Loss: The Stop Loss is automatically placed at the 1.0 level of the Fibonacci range. This is the point where the original trade idea is invalidated.
Take Profit: The Take Profit is automatically placed at the 0.0 level of the Fibonacci range. This is the target at the end of the price leg.
Key Features & Customization
Automated Trade Logic: The entire process, from identifying the setup to placing the entry, stop loss, and take profit, is fully automated.
Visual Aid: The script draws the swing points and the Fibonacci retracement on the chart, so you can visually confirm the setups the strategy is taking.
Customizable Entry: You can change the "Entry Level" in the settings to test different Fibonacci levels, such as the Optimal Trade Entry (OTE) at 0.705.
Toggle Visuals: You can turn the Fibonacci drawing on or off to keep your chart clean while still allowing the strategy to run in the background.

CryptoPulseStoch AICryptoPulseStoch AI Strategy
This strategy combines Bollinger Bands, multi-timeframe EMAs (200 and 50), and Stochastic Oscillator for crypto trading signals on the 1-minute timeframe. Long entries trigger on Stochastic %K/%D crossovers in oversold zones with price breaking the lower Bollinger Band and an upward EMA trend; shorts on crossunders in overbought zones with price breaking the upper Bollinger Band and a downward EMA trend. Includes ATR-based risk management, position sizing, and R:R targets. Overlay on any chart; supports leverage (100% margin). Visual lines/labels for TP/SL/entries; alerts for webhooks.
- **Account Balance (Default: 10000)**: Initial balance for calculating risk and position size; increase for larger accounts.
- **BB Length (Default: 20)**: Periods for Bollinger Bands basis and deviation; shorter for more signals, longer for smoothing.
- **BB Multiplier (Default: 2.0)**: Std dev factor for band width; higher widens bands, reducing false breakouts.
- **Stochastic %K Length (Default: 14)**: Periods for Stochastic Oscillator %K calculation; adjust for sensitivity.
- **Stochastic Smooth K (Default: 1)**: Smoothing period for %K; higher values reduce noise.
- **Stochastic Smooth D (Default: 3)**: Smoothing period for %D; higher values smooth the signal line.
- **Overbought Level (Default: 70)**: Stochastic threshold for bearish signals; lower for more frequent signals.
- **Oversold Level (Default: 30)**: Stochastic threshold for bullish signals; higher for more frequent signals.
- **Risk Per Trade (%) (Default: 2.0)**: Account percentage risked per trade; lower for conservative sizing.
- **Risk:Reward Ratio (Default: 6.0)**: Target profit multiple of risk; higher aims for bigger wins.
- **SL Multiplier (Default: 9.0)**: ATR factor for stop loss distance; adjust based on volatility.
- **TP Multiplier (Default: 6.0)**: ATR factor for take profit distance, scaled by R:R; adjust for target distance.
- **Line Length (bars) (Default: 25)**: Bars to extend TP/SL/entry lines; longer for better visibility.
- **Label Position (Default: left)**: Text placement relative to lines (left/right); choose for chart clarity.
- **ATR Period (Default: 14)**: Periods for ATR volatility measure; affects SL, TP, and position size.
- **EMA Timeframe (Default: 5 min)**: Resolution for EMA 200/50 calculation; use lower TFs for finer trend confirmation.
- **Visuals**: BB plots (blue basis, green upper, red lower); EMA200 (red), EMA50 (green); Stochastic %K (blue), %D (orange); red/green lines/labels for sell/buy entries, SL (red), TP (green).
- **Alerts**: Conditions for buy/sell signals with webhook messages for integration (e.g., Bitget).

CryptoPulse AI### CryptoPulse AI Strategy
This strategy combines Bollinger Bands, multi-timeframe EMAs (200 and 50), and candlestick wick detection for crypto trading signals. Long entries trigger on downward wicks breaking lower BB with upward EMA trend; shorts on upward wicks breaking upper BB with downward EMA trend. Includes ATR-based risk management, position sizing, and R:R targets. Overlay on any chart; supports leverage (100% margin). Visual lines/labels for TP/SL/entries; alerts for webhooks.
- **Account Balance (Default: 10000)**: Initial balance for calculating risk and position size; increase for larger accounts.
- **BB Length (Default: 20)**: Periods for Bollinger Bands basis and deviation; shorter for more signals, longer for smoothing.
- **BB Multiplier (Default: 2.0)**: Std dev factor for band width; higher widens bands, reducing false breakouts.
- **Wick to Body Ratio (Default: 1.1)**: Min wick size vs. body for valid signals (1.1 = 10% larger); higher requires stronger wicks.
- **Risk Per Trade (%) (Default: 2.0)**: Account percentage risked per trade; lower for conservative sizing.
- **Risk:Reward Ratio (Default: 6.0)**: Target profit multiple of risk; higher aims for bigger wins.
- **SL Multiplier (Default: 9.0)**: ATR factor for stop loss distance; adjust based on volatility.
- **Line Length (bars) (Default: 25)**: Bars to extend TP/SL/entry lines; longer for better visibility.
- **Label Position (Default: left)**: Text placement relative to lines (left/right); choose for chart clarity.
- **ATR Period (Default: 14)**: Periods for ATR volatility measure; affects SL and position size.
- **EMA Timeframe (Default: 5 min)**: Resolution for EMA 200/50 calculation; use lower TFs for finer trend confirmation.
- **Visuals**: BB plots (blue basis, green upper, red lower); EMA200 (red), EMA50 (green); red/green lines/labels for sell/buy entries, SL (red), TP (green).
- **Alerts**: Conditions for buy/sell signals with webhook messages for integration (e.g., Bitget).

Trading Report Generator from CSVMany people use the Trading Panel. Unfortunately, it doesn't have a Performance Report. However, TradingView has strategies, and they have a Performance Report :-D
What if we combine the first and second? It's easy!
This script is a special strategy that parses transactions in csv format from Paper Trading (and it will also work for other brokers) and “plays” them. As a result, we get a Performance Report for a specific instrument based on our real trades in Paper or another broker.
How to use it :
First, we need to get a CSV file with transactions. To do this, go to the Trading Panel and connect the desired broker. Select the History tab, then the Filled sub-tab, and configure the columns there, leaving only: Side, Qty, Fill Price, Closing Time. After that, open the Export data dialog, select History, and click Export. Open the downloaded CSV file in a regular text editor (Notepad or similar). It will contain a text like this:
Symbol,Side,Qty,Fill Price,Closing Time
FX:EURUSD,Buy,1000,1.0938700000000001,2023-04-05 14:29:23
COINBASE:ETHUSD,Sell,1,1332.05,2023-01-11 17:41:33
CME_MINI:ESH2023,Sell,1,3961.75,2023-01-11 17:30:40
CME_MINI:ESH2023,Buy,1,3956.75,2023-01-11 17:08:53
Next select all the text (Ctrl+A) and copy it to the clipboard.
Now apply the "Trading Report Generator from CSV" strategy to the chart with the desired symbol and TF, open the settings/input dialog, paste the contents of the clipboard into the single text input field of the strategy, and click Ok.
That's it.
In the Strategy Tester, we see a detailed Performance Report based on our real transactions.
P.S. The CSV file may contain transactions for different instruments, for example, you may have transactions for CRYPTO:BTCUSD and NASDAQ:AAPL. To view the report is based on CRYPTO:BTCUSD trades, simply change the symbol on the chart to CRYPTO:BTCUSD. To view the report is based on NASDAQ:AAPL trades, simply change the symbol on the chart to NASDAQ:AAPL. No changes to the strategy are required.
How it works :
At the beginning of the calculation, we parse the csv once, create trade objects (Trade) and sort them in chronological order. Next, on each bar, we check whether we have trades for the time period of the next bar. If there are, we place a limit order for each trade, with limit price == Fill Price of the trade. Here, we assume that if the trade is real, its execution price will be within the bar range, and the Pine strategy engine will execute this order at the specified limit price.

Opening-Range BreakoutNote: Default trading date range looks mediocre. Set date range to "Entire History" to see full effect of the strategy. 50.91% profitable trades, 1.178 profit factor, steady profits and limited drawdown. Total P&L: $154,141.18, Max Drawdown: $18,624.36. High R^2
█ Overview
The Opening-Range Breakout strategy is a mechanical, session‑based day‑trading system designed to capture the initial burst of directional momentum immediately following the market open. It defines a user‑configurable “opening range” window, measures its high and low boundaries, then places breakout stop orders at those levels once the range closes. Built‑in filters on minimum range width, reward‑to‑risk ratios, and optional reversal logic help refine entries and manage risk dynamically.
█ How It Works
Opening‑Range Formation
Between 9:30–10:15 AM ET (configurable), the script tracks the highest high and lowest low to form the day’s opening range box.
On the first bar after the range window closes, the range high (OR_high) and low (OR_low) are “locked in.”
Range‑Width Filter
To avoid false breakouts in low‑volatility mornings, the range must be at least X% of the current price (default 0.35%).
If the measured opening-range width < minimum threshold, no orders are placed that day.
Entry & Order Placement
Long: a stop‑buy order at the opening‑range high.
Short: a stop‑sell order at the opening‑range low.
Only one side can trigger (or both if reverse logic is enabled after a losing trade).
Risk Management
Once triggered, each trade uses an ATR‑style stop-loss defined as a percentage retracement of the range (default 50% of range width).
Profit target is set at a configurable Reward/Risk Ratio (default 1.1×).
Optional: Reverse on Stop‑Loss – if the initial breakout loses, immediately reverse into the opposite side on the same day.
Session Exit
Any open positions are closed at the end of the regular trading day (default 3:45 PM ET window end, with hard flat at session close).
Visual cues are provided via green (range high) and red (range low) step‑line plots directly on the chart, allowing you to see the range box and breakout triggers in real time.
█ Why It Works
Early Momentum Capture: The first 15 – 60 minutes of trading encapsulate overnight news digestion and institutional order flow, creating a well‑defined volatility “range.”
Mechanical Discipline: Clear, rule‑based entries and exits remove emotional guesswork, ensuring consistency.
Volatility Filtering: By requiring a minimum range width, the system avoids choppy, low‑range days where false breakouts are common.
Dynamic Sizing: Stops and targets scale with the opening range, adapting automatically to each day’s volatility environment.
█ How to Use
Set Your Instruments & Timeframe
-Apply to any futures contract on a 1‑ to 5‑minute chart.
-Ensure chart timezone is set to America/New_York.
Configure Inputs
-Opening‑Range Window: e.g. “0930-1015” for a 45‑minute range.
-Min. OR Width (%): e.g. 0.35 for 0.35% of current price.
-Reward/Risk Ratio: e.g. 1.1 for a modest profit target above your stop.
-Max OR Retracement %: e.g. 50 to set stop at 50% of range width.
-One Trade Per Day: toggle to limit to a single breakout.
-Reverse on Stop Loss: toggle to flip direction after a losing breakout.
Monitor the Chart
-Watch the green and red range boundaries form during the session open.
-Orders will automatically submit on the first bar after the range window closes, conditioned on your filters.
Review & Adjust
-Backtest across multiple months to validate performance on your preferred contract.
-Tweak range duration, minimum width, and R/R multiple to fit your risk tolerance and desired win‑rate vs. expectancy balance.
█ Settings Reference
Input Defaults
Opening‑Range Window - Time window to form OR (HHMM-HHMM) - 0930–1015
Regular Trading Day - Full session for EOD flat (HHMM-HHMM) - 0930–1545
Min. OR Width (%) - Minimum OR size as % of close to trigger orders - 0.35
Reward/Risk Ratio - Profit target multiple of stop‑loss distance - 1.1
Max OR Retracement (%) - % of OR width to use as stop‑loss distance - 50
One Trade Per Day - Limit to a single breakout order per day - false
Reverse on Stop Loss - Reverse direction immediately after a losing trade - true
Disclaimer
This strategy description and any accompanying code are provided for educational purposes only and do not constitute financial advice or a solicitation to trade. Futures trading involves substantial risk, including possible loss of capital. Past performance is not indicative of future results. Traders should assess their own risk tolerance and conduct thorough backtesting and forward-testing before committing real capital.

EMA Grid + Martingale Strategy (Long-Only) with CooldownTitle:
EMA Grid + Martingale Strategy (Long-Only) with Cooldown
Short Summary:
A long-only strategy combining EMA trend filters, grid-based entries, optional martingale sizing, and a cooldown feature to manage position timing and exits.
Full Description:
This strategy uses a 4-EMA trend confirmation system to detect bullish momentum, then deploys a grid-style entry method with optional martingale position sizing. It includes a cooldown mechanism to prevent reentry too soon after a completed trade cycle.
How It Works
1. Trend Confirmation: Two EMA groups (fast/slow) determine whether market conditions are bullish.
2. Initial Entry: A new position is entered when both EMA groups confirm an uptrend and no position is currently active.
3. Grid Entries: Additional long entries are placed when price drops by a defined pip distance from the last entry, respecting the maximum number of entries.
4. Martingale Sizing (Optional): Grid orders can increase in size with each level using a customizable multiplier.
5. Weighted-Average Exit: All positions close once price reaches or exceeds the average entry price plus a buffer.
6. Cooldown Timer: After closing a position set, the strategy waits a defined number of bars before opening a new grid.
Key Features
• 4 customizable EMAs for trend confirmation.
• Dynamic grid-style long entries based on pip intervals.
• Optional martingale-style position sizing.
• Weighted-average price exit logic with buffer control.
• Cooldown bar period to limit overtrading.
• Suitable for optimization and backtesting with full control over inputs.
Use Cases
• Designed for trending markets where pullbacks present entry opportunities.
• Helps manage staged entries while avoiding premature reentry.
• Ideal for testing martingale and grid-based strategies with exit precision.
Note: This strategy is for testing and educational purposes only. It does not guarantee profits and is not financial advice.

HSI1! First 30m Candle Strategy (15m Chart)## HSI1! First 30-Minute Candle Breakout Strategy (15m Chart) — Description
### Overview
This strategy is designed for trading **Hang Seng Index (HSI) Futures** on a 15-minute chart. It uses the price range established during the first 30 minutes of the Hong Kong main session (09:15–09:44:59) to define key breakout levels for a systematic trade entry each day.
### How the Strategy Works
#### 1. Reference Candle Period
- **Aggregation Window:** The strategy monitors the first two 15-minute bars of the session (09:15:00–09:44:59 HKT).
- **Range Capture:** It records the highest and lowest prices (the "reference high/low") during this window.
#### 2. Trade Setup
- After the 09:45 bar completes, the reference range is locked in.
- Throughout the rest of the trading day (within session hours), the strategy looks for breakouts beyond the reference range.
#### 3. Entry Rules
- **Long Entry (Buy):**
- Triggered if price rises to or above the reference high.
- Only entered if the user's settings permit "Buy Only" or "Both".
- **Short Entry (Sell):**
- Triggered if price falls to or below the reference low.
- Only entered if the user's settings permit "Sell Only" or "Both".
- **Single trade per day:**
- Once any trade executes, no additional trades are opened until the next session.
#### 4. Exit Rules
- **Take Profit (TP):**
- Target profit is set to a distance equal to the initial range added above the long entry (or subtracted below the short entry).
- Example: For a 100-point range, a long trade targets entry + 100 points.
- **Stop Loss (SL):**
- Longs are stopped out if price falls back to the session's reference low; shorts are stopped out if price rallies to the reference high.
#### 5. Session Control
- Active only within the regular day session (09:15–12:00 and 13:00–16:00 HKT).
- Trade tracking resets each new trading day.
#### 6. Trade Direction Manual Setting
- A user input allows restriction to "Buy Only", "Sell Only" or "Both" directions, providing discretion over daily bias.
### Example Workflow
| Step | Action |
|---------------------------|-------------------------------------------------------------------------|
| 09:15–09:44 | Aggregate first two 15m candles; record daily high/low |
| After 09:45 | Wait for a breakout (price crossing either the high or the low) |
| Long trade triggered | Enter at the reference high, target is "high + range", SL is at the low |
| Short trade triggered | Enter at the reference low, target is "low - range", SL at the high |
| Trade management | No more trades for the day, regardless of further breakouts |
| End of session (if open) | Trades may be closed per further logic or left to strategy to handle |
### Key Features and Benefits
- **Discipline:** Only one trade per day, minimizing overtrading.
- **Clarity:** Transparent entry/exit rules; no discretionary execution.
- **Flexibility:** User can bias system to buy-only, sell-only, or allow both, depending on trend or personal view.
- **Simple Risk Control:** Pre-defined stop loss and profit target for every trade.
- **Works best in:** Trending, breakout-prone markets with a history of impulsive moves early in the session.
This strategy is ideal for systematic traders looking to capture the Hang Seng's early session momentum, with robust rule-based management and minimal intervention.

Divergence Strategy [Trendoscope®]🎲 Overview
The Divergence Strategy is a sophisticated TradingView strategy that enhances the Divergence Screener by adding automated trade signal generation, risk management, and trade visualization. It leverages the screener’s robust divergence detection to identify bullish, bearish, regular, and hidden divergences, then executes trades with precise entry, stop-loss, and take-profit levels. Designed for traders seeking automated trading solutions, this strategy offers customizable trade parameters and visual feedback to optimize performance across various markets and timeframes.
For core divergence detection features, including oscillator options, trend detection methods, zigzag pivot analysis, and visualization, refer to the Divergence Screener documentation. This description focuses on the strategy-specific enhancements for automated trading and risk management.
🎲 Strategy Features
🎯Automated Trade Signal Generation
Trade Direction Control : Restrict trades to long-only or short-only to align with market bias or strategy goals, preventing conflicting orders.
Divergence Type Selection : Choose to trade regular divergences (bullish/bearish), hidden divergences, or both, targeting reversals or trend continuations.
Entry Type Options :
Cautious : Enters conservatively at pivot points and exits quickly to minimize risk exposure.
Confident : Enters aggressively at the latest price and holds longer to capture larger moves.
Mixed : Combines conservative entries with delayed exits for a balanced approach.
Market vs. Stop Orders: Opt for market orders for instant execution or stop orders for precise price entry.
🎯 Enhanced Risk Management
Risk/Reward Ratio : Define a risk-reward ratio (default: 2.0) to set profit targets relative to stop-loss levels, ensuring consistent trade sizing.
Bracket Orders : Trades include entry, stop-loss, and take-profit levels calculated from divergence pivot points, tailored to the entry type and risk-reward settings.
Stop-Loss Placement : Stops are strategically set (e.g., at recent pivot or last price point) based on entry type, balancing risk and trade validity.
Order Cancellation : Optionally cancel pending orders when a divergence is broken (e.g., price moves past the pivot in the wrong direction), reducing invalid trades. This feature is toggleable for flexibility.
🎯 Trade Visualization
Target and Stop Boxes : Displays take-profit (lime) and stop-loss (orange) levels as boxes on the price chart, extending 10 bars forward for clear visibility.
Dynamic Trade Updates : Trade visualizations are added, updated, or removed as trades are executed, canceled, or invalidated, ensuring accurate feedback.
Overlay Integration : Trade levels overlay the price chart, complementing the screener’s oscillator-based divergence lines and labels.
🎯 Strategy Default Configuration
Capital and Sizing : Set initial capital (default: $1,000,000) and position size (default: 20% of equity) for realistic backtesting.
Pyramiding : Allows up to 4 concurrent trades, enabling multiple divergence-based entries in trending markets.
Commission and Margin : Accounts for commission (default: 0.01%) and margin (100% for long/short) to reflect trading costs.
Performance Optimization : Processes up to 5,000 bars dynamically, balancing historical analysis and real-time execution.
🎲 Inputs and Configuration
🎯Trade Settings
Direction : Select Long or Short (default: Long).
Divergence : Trade Regular, Hidden, or Both divergence types (default: Both).
Entry/Exit Type : Choose Cautious, Confident, or Mixed (default: Cautious).
Risk/Reward : Set the risk-reward ratio for profit targets (default: 2.0).
Use Market Order : Enable market orders for immediate entry (default: false, uses limit orders).
Cancel On Break : Cancel pending orders when divergence is broken (default: true).
🎯Inherited Settings
The strategy inherits all inputs from the Divergence Screener, including:
Oscillator Settings : Oscillator type (e.g., RSI, CCI), length, and external oscillator option.
Trend Settings : Trend detection method (Zigzag, MA Difference, External), MA type, and length.
Zigzag Settings : Zigzag length (fixed repaint = true).
🎲 Entry/Exit Types for Divergence Scenarios
The Divergence Strategy offers three Entry/Exit Type options—Cautious, Confident, and Mixed—which determine how trades are entered and exited based on divergence pivot points. This section explains how these settings apply to different divergence scenarios, with placeholders for screenshots to illustrate each case.
The divergence pattern forms after 3 pivots. The stop and entry levels are formed on one of these levels based on Entry/Exit types.
🎯Bullish Divergence (Reversal)
A bullish divergence occurs when price forms a lower low, but the oscillator forms a higher low, signaling a potential upward reversal.
💎 Cautious:
Entry : At the pivot high point for a conservative entry.
Exit : Stop-loss at the last pivot point (previous low that is higher than the current pivot low); take-profit at risk-reward ratio. Canceled if price breaks below the pivot (if Cancel On Break is enabled).
Behavior : Enters after confirmation and exits quickly to limit downside risk.
💎Confident:
Entry : At the last pivot low, (previous low which is higher than the current pivot low) for an aggressive entry.
Exit : Stop-loss at recent pivot low, which is the lowest point; take-profit at risk-reward ratio. Canceled if price breaks below the pivot. (lazy exit)
Behavior : Enters early to capture trend continuation, holding longer for gains.
💎Mixed:
Entry : At the pivot high point (conservative).
Exit : Stop-loss at the recent pivot point that has resulted in lower low (lazy exit). Canceled if price breaks below the pivot.
Behavior : Balances entry caution with extended holding for trend continuation.
🎯Bearish Divergence (Reversal)
A bearish divergence occurs when price forms a higher high, but the oscillator forms a lower high, indicating a potential downward reversal.
💎Cautious:
Entry : At the pivot low point (lower high) for a conservative short entry.
Exit : Stop-loss at the previous pivot high point (previous high); take-profit at risk-reward ratio. Canceled if price breaks above the pivot (if Cancel On Break is enabled).
Behavior : Enters conservatively and exits quickly to minimize risk.
💎Confident:
Entry : At the last price point (previous high) for an aggressive short entry.
Exit : Stop-loss at the pivot point; take-profit at risk-reward ratio. Canceled if price breaks above the pivot.
Behavior : Enters early to maximize trend continuation, holding longer.
💎Mixed:
Entry : At the previous piot high point (conservative).
Exit : Stop-loss at the last price point (delayed exit). Canceled if price breaks above the pivot.
Behavior : Combines conservative entry with extended holding for downtrend gains.
🎯Bullish Hidden Divergence (Continuation)
A bullish hidden divergence occurs when price forms a higher low, but the oscillator forms a lower low, suggesting uptrend continuation. In case of Hidden bullish divergence, b]Entry is always on the previous pivot high (unless it is a market order)
💎Cautious:
Exit : Stop-loss at the recent pivot low point (higher than previous pivot low); take-profit at risk-reward ratio. Canceled if price breaks below the pivot (if Cancel On Break is enabled).
Behavior : Enters after confirmation and exits quickly to limit downside risk.
💎Confident:
Exit : Stop-loss at previous pivot low, which is the lowest point; take-profit at risk-reward ratio. Canceled if price breaks below the pivot. (lazy exit)
Behavior : Enters early to capture trend continuation, holding longer for gains.
🎯Bearish Hidden Divergence (Continuation)
A bearish hidden divergence occurs when price forms a lower high, but the oscillator forms a higher high, suggesting downtrend continuation. In case of Hidden Bearish divergence, b]Entry is always on the previous pivot low (unless it is a market order)
💎Cautious:
Exit : Stop-loss at the latest pivot high point (which is a lower high); take-profit at risk-reward ratio. Canceled if price breaks above the pivot (if Cancel On Break is enabled).
Behavior : Enters conservatively and exits quickly to minimize risk.
💎Confident/Mixed:
Exit : Stop-loss at the previous pivot high point; take-profit at risk-reward ratio. Canceled if price breaks above the pivot.
Behavior : Uses the late exit point to hold longer.
🎲 Usage Instructions
🎯Add to Chart:
Add the Divergence Strategy to your TradingView chart.
The oscillator and divergence signals appear in a separate pane, with trade levels (target/stop boxes) overlaid on the price chart.
🎯Configure Settings:
Adjust trade settings (direction, divergence type, entry type, risk-reward, market orders, cancel on break).
Modify inherited Divergence Screener settings (oscillator, trend method, zigzag length) as needed.
Enable/disable alerts for divergence notifications.
🎯Interpret Signals:
Long Trades: Triggered on bullish or bullish hidden divergences (if allowed), shown with green/lime lines and labels.
Short Trades: Triggered on bearish or bearish hidden divergences (if allowed), shown with red/orange lines and labels.
Monitor lime (target) and orange (stop) boxes for trade levels.
Review strategy performance metrics (e.g., profit/loss, win rate) in the strategy tester.
🎯Backtest and Optimize:
Use TradingView’s strategy tester to evaluate performance on historical data.
Fine-tune risk-reward, entry type, position sizing, and cancellation settings to suit your market and timeframe.
For questions, suggestions, or support, contact Trendoscope via TradingView or official support channels. Stay tuned for updates and enhancements to the Divergence Strategy!

US30 Stealth StrategyOnly works on US30 (CAPITALCOM) 5 Minute chart
📈 Core Concept:
This is a trend-following strategy that captures strong market continuations by entering on:
The 3rd swing in the current trend,
Confirmed by a volume-verified engulfing candle,
With adaptive SL/TP and position sizing based on risk.
🧠 Entry Logic:
✅ Trend Filter
Uses a 50-period Simple Moving Average (SMA).
Buy only if price is above SMA → Uptrend
Sell only if price is below SMA → Downtrend
✅ Swing Count Logic
For buy: Wait for the 3rd higher low
For sell: Wait for the 3rd lower high
Uses a 5-bar lookback to detect highs/lows
This ensures you’re not buying early — but after trend is confirmed with structure.
✅ Engulfing Candle Confirmation
Bullish engulfing for buys
Bearish engulfing for sells
Candle must engulf previous bar completely (body logic)
✅ Volume Filter
Current candle volume must be greater than the 20-period volume average
Ensures trades only occur with institutional participation
✅ MA Slope Filter
Requires the slope of the 50 SMA over the last 3 candles to exceed 0.1
Avoids chop or flat trends
Adds momentum confirmation to the trade
✅ Session Filter (Time Filter)
Trades only executed between:
2:00 AM to 11:00 PM Oman Time (UTC+4)
Helps avoid overnight chop and illiquidity
📊 Position Sizing & Risk Management
✅ Smart SL (Adaptive Stop Loss)
SL is based on full size of the signal candle (including wick)
But if candle is larger than 25 points, SL is cut to half the size
This prevents oversized risk from long signals during volatile moves.

Canuck Trading Trader StrategyCanuck Trading Trader Strategy
Overview
The Canuck Trading Trader Strategy is a high-performance, trend-following trading system designed for NASDAQ:TSLA on a 15-minute timeframe. Optimized for precision and profitability, this strategy leverages short-term price trends to capture consistent gains while maintaining robust risk management. Ideal for traders seeking an automated, data-driven approach to trading Tesla’s volatile market, it delivers strong returns with controlled drawdowns.
Key Features
Trend-Based Entries: Identifies short-term trends using a 2-candle lookback period and a minimum trend strength of 0.2%, ensuring responsive trade signals.
Risk Management: Includes a configurable 3.0% stop-loss to cap losses and a 2.0% take-profit to lock in gains, balancing risk and reward.
High Precision: Utilizes bar magnification for accurate backtesting, reflecting realistic trade execution with 1-tick slippage and 0.1 commission.
Clean Interface: No on-chart indicators, providing a distraction-free trading experience focused on performance.
Flexible Sizing: Allocates 10% of equity per trade with support for up to 2 simultaneous positions (pyramiding).
Performance Highlights
Backtested from March 1, 2024, to June 20, 2025, on NASDAQ:TSLA (15-minute timeframe) with $1,000,000 initial capital:
Net Profit: $2,279,888.08 (227.99%)
Win Rate: 52.94% (3,039 winning trades out of 5,741)
Profit Factor: 3.495
Max Drawdown: 2.20%
Average Winning Trade: $1,050.91 (0.55%)
Average Losing Trade: $338.20 (0.18%)
Sharpe Ratio: 2.468
Note: Past performance is not indicative of future results. Always validate with your own backtesting and forward testing.
Usage Instructions
Setup:
Apply the strategy to a NASDAQ:TSLA 15-minute chart.
Ensure your TradingView account supports bar magnification for accurate results.
Configuration:
Lookback Candles: Default is 2 (recommended).
Min Trend Strength: Set to 0.2% for optimal trade frequency.
Stop Loss: Default 3.0% to cap losses.
Take Profit: Default 2.0% to secure gains.
Order Size: 10% of equity per trade.
Pyramiding: Allows up to 2 orders.
Commission: Set to 0.1.
Slippage: Set to 1 tick.
Enable "Recalculate After Order is Filled" and "Recalculate on Every Tick" in backtest settings.
Backtesting:
Run backtests over March 1, 2024, to June 20, 2025, to verify performance.
Adjust stop-loss (e.g., 2.5%) or take-profit (e.g., 1–3%) to suit your risk tolerance.
Live Trading:
Use with a compatible broker or TradingView alerts for automated execution.
Monitor execution for slippage or latency, especially given the high trade frequency (5,741 trades).
Validate in a demo account before deploying with real capital.
Risk Disclosure
Trading involves significant risk and may result in losses exceeding your initial capital. The Canuck Trading Trader Strategy is provided for educational and informational purposes only. Users are responsible for their own trading decisions and should conduct thorough testing before using in live markets. The strategy’s high trade frequency requires reliable execution infrastructure to minimize slippage and latency.

Long/Short/Exit/Risk management Strategy # LongShortExit Strategy Documentation
## Overview
The LongShortExit strategy is a versatile trading system for TradingView that provides complete control over entry, exit, and risk management parameters. It features a sophisticated framework for managing long and short positions with customizable profit targets, stop-loss mechanisms, partial profit-taking, and trailing stops. The strategy can be enhanced with continuous position signals for visual feedback on the current trading state.
## Key Features
### General Settings
- **Trading Direction**: Choose to trade long positions only, short positions only, or both.
- **Max Trades Per Day**: Limit the number of trades per day to prevent overtrading.
- **Bars Between Trades**: Enforce a minimum number of bars between consecutive trades.
### Session Management
- **Session Control**: Restrict trading to specific times of the day.
- **Time Zone**: Specify the time zone for session calculations.
- **Expiration**: Optionally set a date when the strategy should stop executing.
### Contract Settings
- **Contract Type**: Select from common futures contracts (MNQ, MES, NQ, ES) or custom values.
- **Point Value**: Define the dollar value per point movement.
- **Tick Size**: Set the minimum price movement for accurate calculations.
### Visual Signals
- **Continuous Position Signals**: Implement 0 to 1 visual signals to track position states.
- **Signal Plotting**: Customize color and appearance of position signals.
- **Clear Visual Feedback**: Instantly see when entry conditions are triggered.
### Risk Management
#### Stop Loss and Take Profit
- **Risk Type**: Choose between percentage-based, ATR-based, or points-based risk management.
- **Percentage Mode**: Set SL/TP as a percentage of entry price.
- **ATR Mode**: Set SL/TP as a multiple of the Average True Range.
- **Points Mode**: Set SL/TP as a fixed number of points from entry.
#### Advanced Exit Features
- **Break-Even**: Automatically move stop-loss to break-even after reaching specified profit threshold.
- **Trailing Stop**: Implement a trailing stop-loss that follows price movement at a defined distance.
- **Partial Profit Taking**: Take partial profits at predetermined price levels:
- Set first partial exit point and percentage of position to close
- Set second partial exit point and percentage of position to close
- **Time-Based Exit**: Automatically exit a position after a specified number of bars.
#### Win/Loss Streak Management
- **Streak Cutoff**: Automatically pause trading after a series of consecutive wins or losses.
- **Daily Reset**: Option to reset streak counters at the start of each day.
### Entry Conditions
- **Source and Value**: Define the exact price source and value that triggers entries.
- **Equals Condition**: Entry signals occur when the source exactly matches the specified value.
### Performance Analytics
- **Real-Time Stats**: Track important performance metrics like win rate, P&L, and largest wins/losses.
- **Visual Feedback**: On-chart markers for entries, exits, and important events.
### External Integration
- **Webhook Support**: Compatible with TradingView's webhook alerts for automated trading.
- **Cross-Platform**: Connect to external trading systems and notification platforms.
- **Custom Order Execution**: Implement advanced order flows through external services.
## How to Use
### Setup Instructions
1. Add the script to your TradingView chart.
2. Configure the general settings based on your trading preferences.
3. Set session trading hours if you only want to trade specific times.
4. Select your contract specifications or customize for your instrument.
5. Configure risk parameters:
- Choose your preferred risk management approach
- Set appropriate stop-loss and take-profit levels
- Enable advanced features like break-even, trailing stops, or partial profit taking as needed
6. Define entry conditions:
- Select the price source (such as close, open, high, or an indicator)
- Set the specific value that should trigger entries
### Entry Condition Examples
- **Example 1**: To enter when price closes exactly at a whole number:
- Long Source: close
- Long Value: 4200 (for instance, to enter when price closes exactly at 4200)
- **Example 2**: To enter when an indicator reaches a specific value:
- Long Source: ta.rsi(close, 14)
- Long Value: 30 (triggers when RSI equals exactly 30)
### Best Practices
1. **Always backtest thoroughly** before using in live trading.
2. **Start with conservative risk settings**:
- Small position sizes
- Reasonable stop-loss distances
- Limited trades per day
3. **Monitor and adjust**:
- Use the performance table to track results
- Adjust parameters based on how the strategy performs
4. **Consider market volatility**:
- Use ATR-based stops during volatile periods
- Use fixed points during stable markets
## Continuous Position Signals Implementation
The LongShortExit strategy can be enhanced with continuous position signals to provide visual feedback about the current position state. These signals can help you track when the strategy is in a long or short position.
### Adding Continuous Position Signals
Add the following code to implement continuous position signals (0 to 1):
```pine
// Continuous position signals (0 to 1)
var float longSignal = 0.0
var float shortSignal = 0.0
// Update position signals based on your indicator's conditions
longSignal := longCondition ? 1.0 : 0.0
shortSignal := shortCondition ? 1.0 : 0.0
// Plot continuous signals
plot(longSignal, title="Long Signal", color=#00FF00, linewidth=2, transp=0, style=plot.style_line)
plot(shortSignal, title="Short Signal", color=#FF0000, linewidth=2, transp=0, style=plot.style_line)
```
### Benefits of Continuous Position Signals
- Provides clear visual feedback of current position state (long/short)
- Signal values stay consistent (0 or 1) until condition changes
- Can be used for additional calculations or alert conditions
- Makes it easier to track when entry conditions are triggered
### Using with Custom Indicators
You can adapt the continuous position signals to work with any custom indicator by replacing the condition with your indicator's logic:
```pine
// Example with moving average crossover
longSignal := fastMA > slowMA ? 1.0 : 0.0
shortSignal := fastMA < slowMA ? 1.0 : 0.0
```
## Webhook Integration
The LongShortExit strategy is fully compatible with TradingView's webhook alerts, allowing you to connect your strategy to external trading platforms, brokers, or custom applications for automated trading execution.
### Setting Up Webhooks
1. Create an alert on your chart with the LongShortExit strategy
2. Enable the "Webhook URL" option in the alert dialog
3. Enter your webhook endpoint URL (from your broker or custom trading system)
4. Customize the alert message with relevant information using TradingView variables
### Webhook Message Format Example
```json
{
"strategy": "LongShortExit",
"action": "{{strategy.order.action}}",
"price": "{{strategy.order.price}}",
"quantity": "{{strategy.position_size}}",
"time": "{{time}}",
"ticker": "{{ticker}}",
"position_size": "{{strategy.position_size}}",
"position_value": "{{strategy.position_value}}",
"order_id": "{{strategy.order.id}}",
"order_comment": "{{strategy.order.comment}}"
}
```
### TradingView Alert Condition Examples
For effective webhook automation, set up these alert conditions:
#### Entry Alert
```
{{strategy.position_size}} != {{strategy.position_size}}
```
#### Exit Alert
```
{{strategy.position_size}} < {{strategy.position_size}} or {{strategy.position_size}} > {{strategy.position_size}}
```
#### Partial Take Profit Alert
```
strategy.order.comment contains "Partial TP"
```
### Benefits of Webhook Integration
- **Automated Trading**: Execute trades automatically through supported brokers
- **Cross-Platform**: Connect to custom trading bots and applications
- **Real-Time Notifications**: Receive trade signals on external platforms
- **Data Collection**: Log trade data for further analysis
- **Custom Order Management**: Implement advanced order types not available in TradingView
### Compatible External Applications
- Trading bots and algorithmic trading software
- Custom order execution systems
- Discord, Telegram, or Slack notification systems
- Trade journaling applications
- Risk management platforms
### Implementation Recommendations
- Test webhook delivery using a free service like webhook.site before connecting to your actual trading system
- Include authentication tokens or API keys in your webhook URL or payload when required by your external service
- Consider implementing confirmation mechanisms to verify trade execution
- Log all webhook activities for troubleshooting and performance tracking
## Strategy Customization Tips
### For Scalping
- Set smaller profit targets (1-3 points)
- Use tighter stop-losses
- Enable break-even feature after small profit
- Set higher max trades per day
### For Day Trading
- Use moderate profit targets
- Implement partial profit taking
- Enable trailing stops
- Set reasonable session trading hours
### For Swing Trading
- Use longer-term charts
- Set wider stops (ATR-based often works well)
- Use higher profit targets
- Disable daily streak reset
## Common Troubleshooting
### Low Win Rate
- Consider widening stop-losses
- Verify that entry conditions aren't triggering too frequently
- Check if the equals condition is too restrictive; consider small tolerances
### Missing Obvious Trades
- The equals condition is extremely precise. Price must exactly match the specified value.
- Consider using floating-point precision for more reliable triggers
### Frequent Stop-Outs
- Try ATR-based stops instead of fixed points
- Increase the stop-loss distance
- Enable break-even feature to protect profits
## Important Notes
- The exact equals condition is strict and may result in fewer trade signals compared to other conditions.
- For instruments with decimal prices, exact equality might be rare. Consider the precision of your value.
- Break-even and trailing stop calculations are based on points, not percentage.
- Partial take-profit levels are defined in points distance from entry.
- The continuous position signals (0 to 1) provide valuable visual feedback but don't affect the strategy's trading logic directly.
- When implementing continuous signals, ensure they're aligned with the actual entry conditions used by the strategy.
---
*This strategy is for educational and informational purposes only. Always test thoroughly before using with real funds.*

Daily Bias on 5 minutes Reversal StrategyThis strategy combines higher-timeframe bias (daily and 1-hour) with 5-minute reversal signals to identify intraday trades. It aims to capitalize on false breakouts of the previous day's high/low, with strict risk management (Strict position sizing, max risk cap, and R:R enforcement), Avoids Over-Trading (1 trade/day rule prevents chasing), SL buffer adapts to volatility.
#1. This strategy does not utilize indicators. We will use the daily (D) price range and look for breakout attempts and rejections at the extreme points on the lower time frame (1h). If rejection occurs, it establishes our bias (bullish or bearish). For final confirmation, we move to the 5-minute timeframe to observe attempts to retest that daily price range. If significant rejection occurs again, that becomes our entry point.
#2. When rejection occurs, the 1-hour candle may form a new extreme point (low/high). Therefore, we will no longer use the daily price range as our trade exit point but instead the new extreme level established after the breakout attempt and price rejection.
To prevent premature trade exits, we also add an SL buffer using ATR while still capping the maximum acceptable risk per trade (as a percentage). Take profit is calculated using a risk-to-reward ratio, with a default setting of 1.5x.
#3. Key Input Parameters
a. Timeframes :
1. Daily TF ((Anchor for daily high/low (default: D).)
2. 1H Bias TF (Bias confirmation timeframe (default: 60))
3. Execution TF (Entry signal timeframe (default: 5, should match chart).
b. Trade Management
1. SL Buffer ATR Multiplier (Buffer beyond swing low/high (default: 6.0))
2. Min ATR Threshold (Minimum buffer size (default: 1.0))
3. Risk Reward Ratio (TP distance multiplier (default: 1.5))
4. Max Risk Allowed (Max risk % of entry (default: 3.0%))
Lookback Bars for SL Bars for swing low/high (default: 60))
c. Break Thresholds
1. 1H Candle Break Threshold (ATR multiplier for 1H break (default: 0.75))
2. 5M Candle Break Threshold (ATR multiplier for 5M break (default: 0.5))

DVPOOverview
The DVPO (Dynamic Volume Profile Oscillator) Strategy is a comprehensive and highly customizable trading tool designed for precision and control. It is built around a unique, volume-driven oscillator that identifies potential market entries by analyzing the relationship between price, volume, and volatility.
This strategy is not just another signal generator; it's a complete framework that includes dynamic entry logic, adaptive risk management (ATR Stop Loss and R:R-based Take Profit), and a powerful dashboard of 10+ optional confirmation filters to help you tailor the strategy to your specific instrument, timeframe, and trading style.
The Core Concept: The DVPO Oscillator
The heart of this strategy is the DVPO oscillator. Unlike standard oscillators like RSI or Stochastics, the DVPO's primary goal is to quantify how far the current price has deviated from its recent volume-weighted "fair value."
Here’s how it works conceptually:
Micro Volume Profile: The indicator first analyzes a recent period of bars (defined by Lookback Period) to build a mini-profile of price and volume.
Volume-Weighted Mean: From this profile, it calculates a volume-weighted average price (VWAP) and the average deviation from that mean. This establishes the central point of value for the recent period.
Deviation Measurement: The oscillator's value is derived from how far the current price is from this calculated mean, scaled by the observed price deviation and a user-defined Sensitivity. A value above the midline suggests the price is trading at a premium, while a value below suggests it's at a discount.
Adaptive Volatility Zones: Instead of using fixed overbought/oversold levels (e.g., 70/30), the DVPO calculates dynamic upper and lower zones using the standard deviation of the oscillator itself. These zones expand and contract based on recent market volatility.
An entry signal is triggered not just when the oscillator is "overbought" or "oversold," but when it breaks out of these adaptive volatility zones, signaling that a statistically significant price movement is underway.
📈 Long Entry Condition : The oscillator crosses above the dynamic upper zone.
📉 Short Entry Condition : The oscillator crosses below the dynamic lower zone.
Integrated Risk & Trade Management
A signal is useless without proper risk management. This strategy has professional-grade risk management built directly into its logic.
Stop Loss (ATR-Based): The Stop Loss is not a fixed percentage. It is calculated using the Average True Range (ATR), allowing it to adapt automatically to the market's current volatility. In volatile periods, the stop will be wider; in quiet periods, it will be tighter.
Take Profit (Risk/Reward Ratio): The Take Profit level is calculated based on a user-defined Risk/Reward Ratio. If you set a ratio of 2.0, the Take Profit target will be placed at twice the distance of the Stop Loss from your entry price.
Dynamic Position Sizing: The strategy can automatically calculate the trade quantity for you. It determines the position size based on your specified Capital Size and the % Risk Per Trade you are willing to accept, ensuring disciplined risk control on every trade.
The Filter Dashboard : Enhance Your Signal Quality
To help reduce false signals and adapt to different market conditions, the strategy includes a comprehensive dashboard of optional confirmation filters. An entry signal will only be executed if it aligns with all the filters you have activated.
Trend & Momentum Filters :
T3, VMA, & VWAP Trend Filters: Utilize a suite of advanced moving averages (T3, Variable Moving Average, and a session-based VWAP) to ensure your trades are aligned with the dominant trend.
ADX Filter: Confirms that the market has sufficient directional strength for a trend-following trade, helping to avoid entries during choppy conditions.
Kaufman Efficiency Filter: Uses the Kaufman Efficiency Ratio to measure market noise. It only allows trades when the market is trending efficiently.
Volume & Market State Filters :
Volume Flow (VFI): A sophisticated volume-based filter that confirms whether volume is supporting the price move.
TDFI (Trader's Dynamic Index): A market state indicator designed to identify when the market is primed for a strong, directional move.
Flat Market Detector: A unique filter that identifies and avoids trading in sideways or ranging markets where trend strategies typically underperform.
Trade Condition Filters :
Min TP / Max SL %: Filter out trades where the risk/reward profile doesn't meet your minimum requirements (e.g., ignore a trade if the ATR-based stop loss is more than 10% away from the price).
Session Filters: Allows you to enable or disable trading on specific days of the week and to set a Cooldown Period (a set number of bars to wait after a trade closes before looking for a new entry).
How To Use This Strategy
Start with the Core: Begin by configuring the DVPO Oscillator settings (Lookback Period, Sensitivity, Zone Width) and your Risk Management parameters (ATR Multiplier, RR Ratio, % Risk Per Trade). These form the foundation of the strategy.
Backtest and Observe: Use TradingView's Strategy Tester to see how the core signals perform on your chosen asset and timeframe.
Layer Filters Intelligently: Enable the confirmation filters one by one and re-run your backtest. Observe how each filter impacts performance (e.g., does the T3 filter increase profitability but reduce the number of trades?). The goal is to find the optimal balance between signal quality and frequency.
Visualize and Analyze: Use the Show Risk/Reward Area option to plot your entry, stop loss, and take profit levels directly on the chart for every trade, providing a clear visual representation of your trade plan.
Disclaimer: This strategy is provided for educational and analytical purposes only. Past performance is not indicative of future results. All trading involves risk, and you should conduct your own thorough backtesting and analysis before deploying any strategy in a live market.

Anomalous Holonomy Field Theory🌌 Anomalous Holonomy Field Theory (AHFT) - Revolutionary Quantum Market Analysis
Where Theoretical Physics Meets Trading Reality
A Groundbreaking Synthesis of Differential Geometry, Quantum Field Theory, and Market Dynamics
🔬 THEORETICAL FOUNDATION - THE MATHEMATICS OF MARKET REALITY
The Anomalous Holonomy Field Theory represents an unprecedented fusion of advanced mathematical physics with practical market analysis. This isn't merely another indicator repackaging old concepts - it's a fundamentally new lens through which to view and understand market structure .
1. HOLONOMY GROUPS (Differential Geometry)
In differential geometry, holonomy measures how vectors change when parallel transported around closed loops in curved space. Applied to markets:
Mathematical Formula:
H = P exp(∮_C A_μ dx^μ)
Where:
P = Path ordering operator
A_μ = Market connection (price-volume gauge field)
C = Closed price path
Market Implementation:
The holonomy calculation measures how price "remembers" its journey through market space. When price returns to a previous level, the holonomy captures what has changed in the market's internal geometry. This reveals:
Hidden curvature in the market manifold
Topological obstructions to arbitrage
Geometric phase accumulated during price cycles
2. ANOMALY DETECTION (Quantum Field Theory)
Drawing from the Adler-Bell-Jackiw anomaly in quantum field theory:
Mathematical Formula:
∂_μ j^μ = (e²/16π²)F_μν F̃^μν
Where:
j^μ = Market current (order flow)
F_μν = Field strength tensor (volatility structure)
F̃^μν = Dual field strength
Market Application:
Anomalies represent symmetry breaking in market structure - moments when normal patterns fail and extraordinary opportunities arise. The system detects:
Spontaneous symmetry breaking (trend reversals)
Vacuum fluctuations (volatility clusters)
Non-perturbative effects (market crashes/melt-ups)
3. GAUGE THEORY (Theoretical Physics)
Markets exhibit gauge invariance - the fundamental physics remains unchanged under certain transformations:
Mathematical Formula:
A'_μ = A_μ + ∂_μΛ
This ensures our signals are gauge-invariant observables , immune to arbitrary market "coordinate changes" like gaps or reference point shifts.
4. TOPOLOGICAL DATA ANALYSIS
Using persistent homology and Morse theory:
Mathematical Formula:
β_k = dim(H_k(X))
Where β_k are the Betti numbers describing topological features that persist across scales.
🎯 REVOLUTIONARY SIGNAL CONFIGURATION
Signal Sensitivity (0.5-12.0, default 2.5)
Controls the responsiveness of holonomy field calculations to market conditions. This parameter directly affects the threshold for detecting quantum phase transitions in price action.
Optimization by Timeframe:
Scalping (1-5min): 1.5-3.0 for rapid signal generation
Day Trading (15min-1H): 2.5-5.0 for balanced sensitivity
Swing Trading (4H-1D): 5.0-8.0 for high-quality signals only
Score Amplifier (10-200, default 50)
Scales the raw holonomy field strength to produce meaningful signal values. Higher values amplify weak signals in low-volatility environments.
Signal Confirmation Toggle
When enabled, enforces additional technical filters (EMA and RSI alignment) to reduce false positives. Essential for conservative strategies.
Minimum Bars Between Signals (1-20, default 5)
Prevents overtrading by enforcing quantum decoherence time between signals. Higher values reduce whipsaws in choppy markets.
👑 ELITE EXECUTION SYSTEM
Execution Modes:
Conservative Mode:
Stricter signal criteria
Higher quality thresholds
Ideal for stable market conditions
Adaptive Mode:
Self-adjusting parameters
Balances signal frequency with quality
Recommended for most traders
Aggressive Mode:
Maximum signal sensitivity
Captures rapid market moves
Best for experienced traders in volatile conditions
Dynamic Position Sizing:
When enabled, the system scales position size based on:
Holonomy field strength
Current volatility regime
Recent performance metrics
Advanced Exit Management:
Implements trailing stops based on ATR and signal strength, with mode-specific multipliers for optimal profit capture.
🧠 ADAPTIVE INTELLIGENCE ENGINE
Self-Learning System:
The strategy analyzes recent trade outcomes and adjusts:
Risk multipliers based on win/loss ratios
Signal weights according to performance
Market regime detection for environmental adaptation
Learning Speed (0.05-0.3):
Controls adaptation rate. Higher values = faster learning but potentially unstable. Lower values = stable but slower adaptation.
Performance Window (20-100 trades):
Number of recent trades analyzed for adaptation. Longer windows provide stability, shorter windows increase responsiveness.
🎨 REVOLUTIONARY VISUAL SYSTEM
1. Holonomy Field Visualization
What it shows: Multi-layer quantum field bands representing market resonance zones
How to interpret:
Blue/Purple bands = Primary holonomy field (strongest resonance)
Band width = Field strength and volatility
Price within bands = Normal quantum state
Price breaking bands = Quantum phase transition
Trading application: Trade reversals at band extremes, breakouts on band violations with strong signals.
2. Quantum Portals
What they show: Entry signals with recursive depth patterns indicating momentum strength
How to interpret:
Upward triangles with portals = Long entry signals
Downward triangles with portals = Short entry signals
Portal depth = Signal strength and expected momentum
Color intensity = Probability of success
Trading application: Enter on portal appearance, with size proportional to portal depth.
3. Field Resonance Bands
What they show: Fibonacci-based harmonic price zones where quantum resonance occurs
How to interpret:
Dotted circles = Minor resonance levels
Solid circles = Major resonance levels
Color coding = Resonance strength
Trading application: Use as dynamic support/resistance, expect reactions at resonance zones.
4. Anomaly Detection Grid
What it shows: Fractal-based support/resistance with anomaly strength calculations
How to interpret:
Triple-layer lines = Major fractal levels with high anomaly probability
Labels show: Period (H8-H55), Price, and Anomaly strength (φ)
⚡ symbol = Extreme anomaly detected
● symbol = Strong anomaly
○ symbol = Normal conditions
Trading application: Expect major moves when price approaches high anomaly levels. Use for precise entry/exit timing.
5. Phase Space Flow
What it shows: Background heatmap revealing market topology and energy
How to interpret:
Dark background = Low market energy, range-bound
Purple glow = Building energy, trend developing
Bright intensity = High energy, strong directional move
Trading application: Trade aggressively in bright phases, reduce activity in dark phases.
📊 PROFESSIONAL DASHBOARD METRICS
Holonomy Field Strength (-100 to +100)
What it measures: The Wilson loop integral around price paths
>70: Strong positive curvature (bullish vortex)
<-70: Strong negative curvature (bearish collapse)
Near 0: Flat connection (range-bound)
Anomaly Level (0-100%)
What it measures: Quantum vacuum expectation deviation
>70%: Major anomaly (phase transition imminent)
30-70%: Moderate anomaly (elevated volatility)
<30%: Normal quantum fluctuations
Quantum State (-1, 0, +1)
What it measures: Market wave function collapse
+1: Bullish eigenstate |↑⟩
0: Superposition (uncertain)
-1: Bearish eigenstate |↓⟩
Signal Quality Ratings
LEGENDARY: All quantum fields aligned, maximum probability
EXCEPTIONAL: Strong holonomy with anomaly confirmation
STRONG: Good field strength, moderate anomaly
MODERATE: Decent signals, some uncertainty
WEAK: Minimal edge, high quantum noise
Performance Metrics
Win Rate: Rolling performance with emoji indicators
Daily P&L: Real-time profit tracking
Adaptive Risk: Current risk multiplier status
Market Regime: Bull/Bear classification
🏆 WHY THIS CHANGES EVERYTHING
Traditional technical analysis operates on 100-year-old principles - moving averages, support/resistance, and pattern recognition. These work because many traders use them, creating self-fulfilling prophecies.
AHFT transcends this limitation by analyzing markets through the lens of fundamental physics:
Markets have geometry - The holonomy calculations reveal this hidden structure
Price has memory - The geometric phase captures path-dependent effects
Anomalies are predictable - Quantum field theory identifies symmetry breaking
Everything is connected - Gauge theory unifies disparate market phenomena
This isn't just a new indicator - it's a new way of thinking about markets . Just as Einstein's relativity revolutionized physics beyond Newton's mechanics, AHFT revolutionizes technical analysis beyond traditional methods.
🔧 OPTIMAL SETTINGS FOR MNQ 10-MINUTE
For the Micro E-mini Nasdaq-100 on 10-minute timeframe:
Signal Sensitivity: 2.5-3.5
Score Amplifier: 50-70
Execution Mode: Adaptive
Min Bars Between: 3-5
Theme: Quantum Nebula or Dark Matter
💭 THE JOURNEY - FROM IMPOSSIBLE THEORY TO TRADING REALITY
Creating AHFT was a mathematical odyssey that pushed the boundaries of what's possible in Pine Script. The journey began with a seemingly impossible question: Could the profound mathematical structures of theoretical physics be translated into practical trading tools?
The Theoretical Challenge:
Months were spent diving deep into differential geometry textbooks, studying the works of Chern, Simons, and Witten. The mathematics of holonomy groups and gauge theory had never been applied to financial markets. Translating abstract mathematical concepts like parallel transport and fiber bundles into discrete price calculations required novel approaches and countless failed attempts.
The Computational Nightmare:
Pine Script wasn't designed for quantum field theory calculations. Implementing the Wilson loop integral, managing complex array structures for anomaly detection, and maintaining computational efficiency while calculating geometric phases pushed the language to its limits. There were moments when the entire project seemed impossible - the script would timeout, produce nonsensical results, or simply refuse to compile.
The Breakthrough Moments:
After countless sleepless nights and thousands of lines of code, breakthrough came through elegant simplifications. The realization that market anomalies follow patterns similar to quantum vacuum fluctuations led to the revolutionary anomaly detection system. The discovery that price paths exhibit holonomic memory unlocked the geometric phase calculations.
The Visual Revolution:
Creating visualizations that could represent 4-dimensional quantum fields on a 2D chart required innovative approaches. The multi-layer holonomy field, recursive quantum portals, and phase space flow representations went through dozens of iterations before achieving the perfect balance of beauty and functionality.
The Balancing Act:
Perhaps the greatest challenge was maintaining mathematical rigor while ensuring practical trading utility. Every formula had to be both theoretically sound and computationally efficient. Every visual had to be both aesthetically pleasing and information-rich.
The result is more than a strategy - it's a synthesis of pure mathematics and market reality that reveals the hidden order within apparent chaos.
📚 INTEGRATED DOCUMENTATION
Once applied to your chart, AHFT includes comprehensive tooltips on every input parameter. The source code contains detailed explanations of the mathematical theory, practical applications, and optimization guidelines. This published description provides the overview - the indicator itself is a complete educational resource.
⚠️ RISK DISCLAIMER
While AHFT employs advanced mathematical models derived from theoretical physics, markets remain inherently unpredictable. No mathematical model, regardless of sophistication, can guarantee future results. This strategy uses realistic commission ($0.62 per contract) and slippage (1 tick) in all calculations. Past performance does not guarantee future results. Always use appropriate risk management and never risk more than you can afford to lose.
🌟 CONCLUSION
The Anomalous Holonomy Field Theory represents a quantum leap in technical analysis - literally. By applying the profound insights of differential geometry, quantum field theory, and gauge theory to market analysis, AHFT reveals structure and opportunities invisible to traditional methods.
From the holonomy calculations that capture market memory to the anomaly detection that identifies phase transitions, from the adaptive intelligence that learns and evolves to the stunning visualizations that make the invisible visible, every component works in mathematical harmony.
This is more than a trading strategy. It's a new lens through which to view market reality.
Trade with the precision of physics. Trade with the power of mathematics. Trade with AHFT.
I hope this serves as a good replacement for Quantum Edge Pro - Adaptive AI until I'm able to fix it.
— Dskyz, Trade with insight. Trade with anticipation.

Donchian x WMA Crossover (2025 Only, Adjustable TP, Real OHLC)Short Description:
Long-only breakout system that goes long when the Donchian Low crosses up through a Weighted Moving Average, and closes when it crosses back down (with an optional take-profit), restricted to calendar year 2025. All signals use the instrument’s true OHLC data (even on Heikin-Ashi charts), start with 1 000 AUD of capital, and deploy 100 % equity per trade.
Ideal parameters configured for Temple & Webster on ASX 30 minute candles. Adjust parameter to suit however best to download candle interval data and have GPT test the pine script for optimum parameters for your trading symbol.
Detailed Description
1. Strategy Concept
This strategy captures trend-driven breakouts off the bottom of a Donchian channel. By combining the Donchian Low with a WMA filter, it aims to:
Enter when volatility compresses and price breaks above the recent Donchian Low while the longer‐term WMA confirms upward momentum.
Exit when price falls back below that same WMA (i.e. when the Donchian Low crosses back down through WMA), but only if the WMA itself has stopped rising.
Optional Take-Profit: you can specify a profit target in decimal form (e.g. 0.01 = 1 %).
2. Timeframe & Universe
In-sample period: only bars stamped between Jan 1 2025 00:00 UTC and Dec 31 2025 23:59 UTC are considered.
Any resolution (e.g. 30 m, 1 h, D, etc.) is supported—just set your preferred timeframe in the TradingView UI.
3. True-Price Execution
All indicator calculations (Donchian Low, WMA, crossover checks, take-profit) are sourced from the chart’s underlying OHLC via request.security(). This guarantees that:
You can view Heikin-Ashi or other styled candles, but your strategy will execute on the real OHLC bars.
Chart styling never suppresses or distorts your backtest results.
4. Position Sizing & Equity
Initial capital: 1 000 AUD
Size per trade: 100 % of available equity
No pyramiding: one open position at a time
5. Inputs (all exposed in the “Inputs” tab):
Input Default Description
Donchian Length 7 Number of bars to calculate the Donchian channel low
WMA Length 62 Period of the Weighted Moving Average filter
Take Profit (decimal) 0.01 Exit when price ≥ entry × (1 + take_profit_perc)
6. How It Works
Donchian Low: ta.lowest(low, DonchianLength) over the specified look-back.
WMA: ta.wma(close, WMALength) applied to true closes.
Entry: ta.crossover(DonchianLow, WMA) AND barTime ∈ 2025.
Exit:
Cross-down exit: ta.crossunder(DonchianLow, WMA) and WMA is not rising (i.e. momentum has stalled).
Take-profit exit: price ≥ entry × (1 + take_profit_perc).
Calendar exit: barTime falls outside 2025.
7. Usage Notes
After adding to your chart, open the Strategy Tester tab to review performance metrics, list of trades, equity curve, etc.
You can toggle your chart to Heikin-Ashi for visual clarity without affecting execution, thanks to the real-OHLC calls.

Random State Machine Strategy📌 Random State Machine Strategy (Educational)
This strategy showcases a randomized entry model driven by a finite state machine, integrated with user-defined exit controls and a full-featured moving average filter.
🧠 Trade Entry Logic
Entries occur only when:
A random trigger occurs (~5% probability per bar)
The state machine accepts a new transition (sm.step())
Price is:
Above the selected MA for long entries
Below the selected MA for short entries
This ensures that entries are both stochastically driven and trend-aligned, avoiding frequent or arbitrary trades.
⚙️ How It Works
Randomized Triggers
A pseudo-random generator (seeded with time and volume) attempts to trigger state transitions.
Finite State Machine
Transitions are managed using the StateMachine from robbatt/lib_statemachine — credit to @robbatt for the modular FSM design.
Controlled Reset
The state machine resets every N bars (default: 100) if at least two transitions have occurred. This prevents stale or locked states.
Backtest Range
Define a specific test window using Start and End Date inputs.
Risk & Exits
Specify risk in points and a target risk/reward ratio. TP is auto-computed. Timed and MA-based exits can be toggled.
🧪 How to Use
Enable Long or Short trades
Choose your Moving Average type and length
Set Risk per trade and R/R ratio
Toggle TP/SL, timed exit, or MA cross exit
Adjust the State Reset Interval to suit your signal frequency
📘 Notes
Educational use only — not financial advice
Random logic is used to model structure, not predict movement
Thanks to @robbatt for the lib_statemachine integration

MMTools - Backtester❖ Overview
Backtester is a script implemented as a strategy, featuring multiple conditions and tools to offer an alternative way to work with Catcher. It supports both backtesting and algorithmic trading, allowing you to evaluate the indicator's performance on historical data for any instrument using the Strategy Tester.
❖ Settings
⚙️ Custom Conditions and Signals
This section is intended to provide flexibility when working with Catcher. (If you intend to use Catcher alone, this section can be disregarded). You may combine the primary indicator (Catcher) with additional custom indicators to define entry and exit signals. Simply add the custom indicator to your chart, display it and then select its name in the corresponding dropdown menu. By default, the 'Close' option is selected, meaning custom conditions are disabled.
Operator 'OR': An entry order is activated when either your custom signal or the primary signal occurs.
Operator 'AND': An entry order is activated only when both the custom and primary signals occur simultaneously.
If both 'AND' and 'OR' operators are used, enabling the 'Only Primary' option will apply the 'AND' operator only to the primary indicator.
Custom Exit: Allows the strategy to close a position based on a custom signal, in addition to standard exit conditions. The first condition met will trigger the exit.
Note: The strategy executes orders at the open of the next bar after the custom condition is met.
⚙️ Confirmation
When enabled, the strategy will enter a position only if a specified number of signals occur within a defined lookback period.
⚙️ Exits
Two types of exit mechanisms are available for take-profit and stop-loss:
Timeout: Sets a maximum duration (in bars) that a trade can remain open. If this limit is exceeded, the strategy will close the position.
Percentage-Based: Exit positions based on a specified percentage move.
⚙️ Start Date
Specifies the starting point for the backtest.
⚙️ Plotting
The green line represents the take-profit level, while the red line indicates the stop-loss level. Plotting is limited to the last 250 bars.
⚙️ Other Settings
Remember to configure additional parameters under the “Properties” tab, including commissions, slippage, and pyramiding. Default commission is set at 0.05%.
❖ Access
Please refer to the Author's Instructions field to request access to the script.
-----------------------------------------------------------
Disclaimer
The information provided by my scripts is for informational purposes only and does not constitute financial advice. Past performance is not indicative of future results. Always do your own research before making financial decisions.
