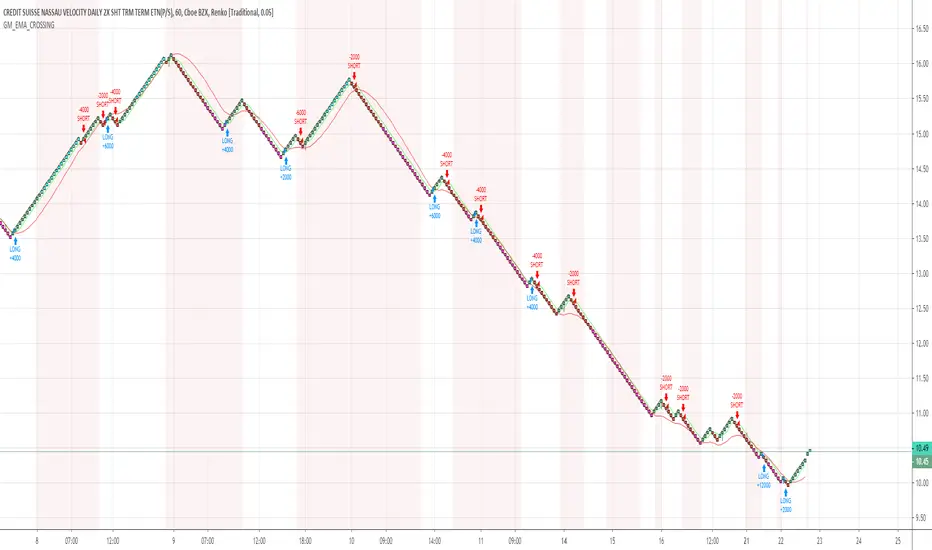
GM_EMA_CROSSINGThis is a simple Renko Strategy. The settings used were for Traditional (1.2) bars, tested on $SPX500USD. Around 70% profitable depending on timeframe, and bar size selected. Adjust the capital and suggested contract system depending on needs. The colored bars seen show blue for overbought conditions and pink for oversold conditions. If you like this strategy, please like and +rep!
In den Scripts nach "bar" suchen
Support-Resistance breakoutStrategy based on longing resistance breakout and shorting support breakout.
It defines highs and lows using fractal with 2 bars for confirming high/lows. So it has 2 bars lag.
It calculates the difference between sma with defined length (21 by default) of highs and of lows and uses it as alt SR level. This idea I took from synapticEx's indicator Nebula-Advanced-Dynamic-Support-Resistance.
Position enter is the breakout of SR, defined by fractals.
Position exit is: bar change in opposite to position direction > difference is sma of highs and of lows.
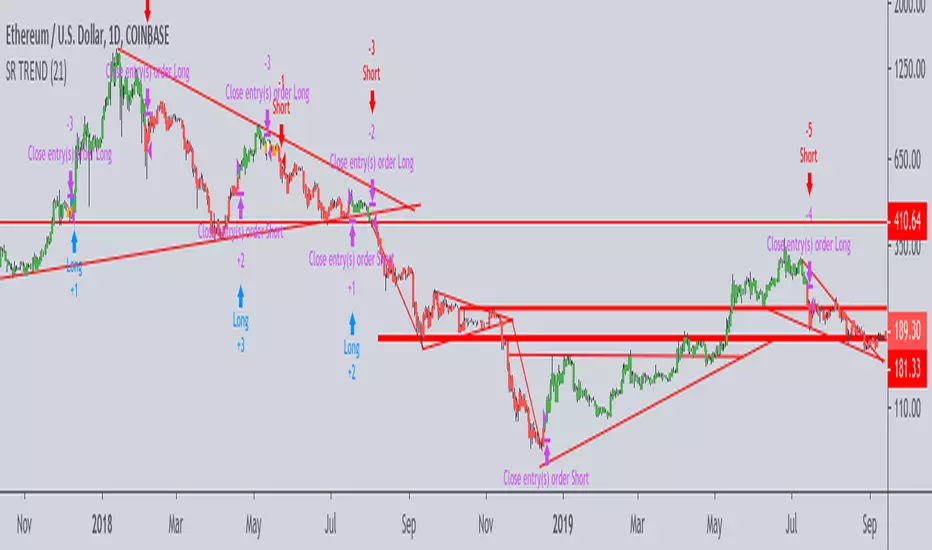
Trend SR based strategyIt is a logical continuation of my Trend SR based indicator
Algo of strategy is next
1)Detect SR levels
2)Calculate separate channels for SR made by highs and lows
3)it takes position if the current SR is breaking and close price is not in opposite channel zone
4)It closes position if prise leave current channel zone or as an option (stoploss) if SR is breaking in an opposite direction
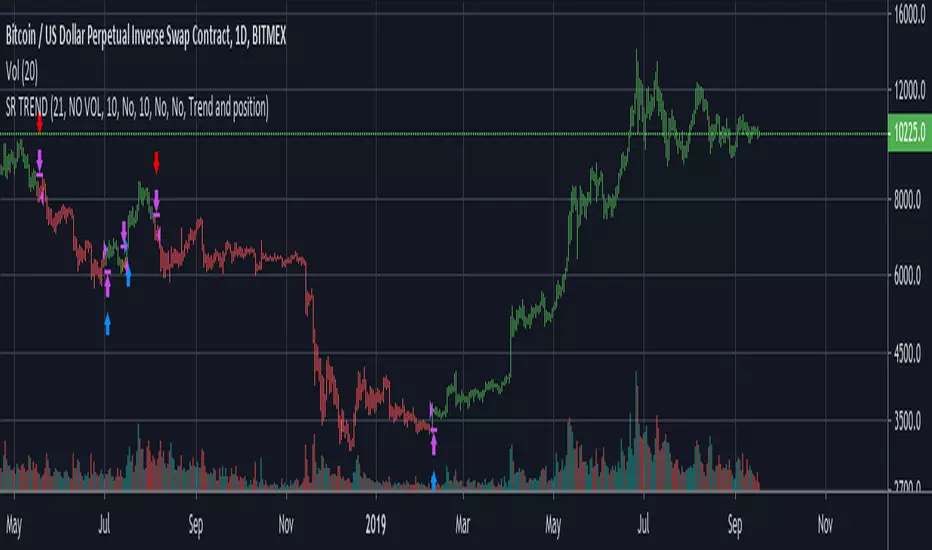
-uses //@version=4
-no volume needed for detecting SR breaking and entering a long position
-volume confirmation of SR breaking may be used in the option section
-volume has an option to use smoothing with MA: SMA, AHMA, VIDYA
-volume has option to use volume pump as confirmation of SR breaking (simple dev function)
-stoploss as option
-uses barstate.isconfirmed (returns true if the script is calculating the last (closing) update of the current bar) for entering position on current bar close
-as an option, all or only current SR levels detected by algo can be plotted
-option to plot SR as a channel - as FILTERED whole SR history, in a long or short position it plots only stoploss level and entering opposite position level, in no position it plots long and short entering levels
It works well on 1D
For using on 4h or lower timeframes - Volume confirmation with VIDYA or AHMA may give better results
For better work especially on LTF algo needs better detection of highs and lows, now it uses fractal filter of last bars
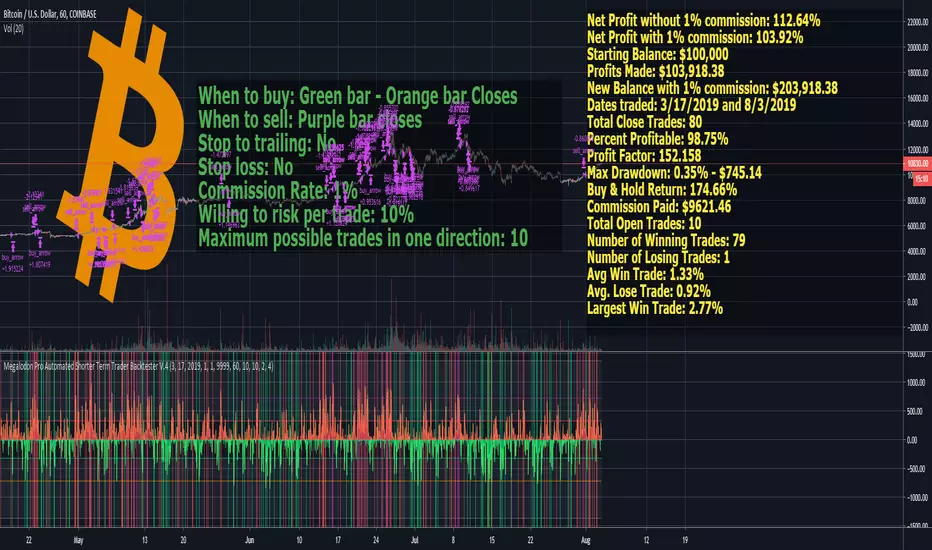
Megalodon Pro Automated Shorter Term Trader BacktesterSTRATEGY
When to buy: Green bar - Orange bar Closes
When to sell: Purple bar closes
Stop to trailing: No
Stop loss: No
Commission Rate: 1%
Willing to risk per trade: 10%
Maximum possible trades in one direction: 10
RESULTS
Net Profit without 1% commission: 112.64%
Net Profit with 1% commission: 103.92%
Starting Balance: $100,000
Profits Made: $103,918.38
New Balance with 1% commission: $203,918.38
Dates traded: 3/17/2019 and 8/3/2019
Total Close Trades: 80
Percent Profitable: 98.75%
Profit Factor: 152.158
Max Drawdown: 0.35% - $745.14
Buy & Hold Return: 174.66%
Commission Paid: $9621.46
Total Open Trades: 10
Number of Winning Trades: 79
Number of Losing Trades: 1
Avg Win Trade: 1.33%
Avg. Lose Trade: 0.92%
Largest Win Trade: 2.77%
Let me know what you guys think about the results?
Due to the tradingview's limitations on providing the shorter time frame price data, we had to provide a 60 minute time frame backtesting results.
The shorter time frames including 1 minute and 15 minutes backtesting results are way more accurate and precise than 60 minutes time frame results.
Megalodon Trading
Enlightening the Modern Investors
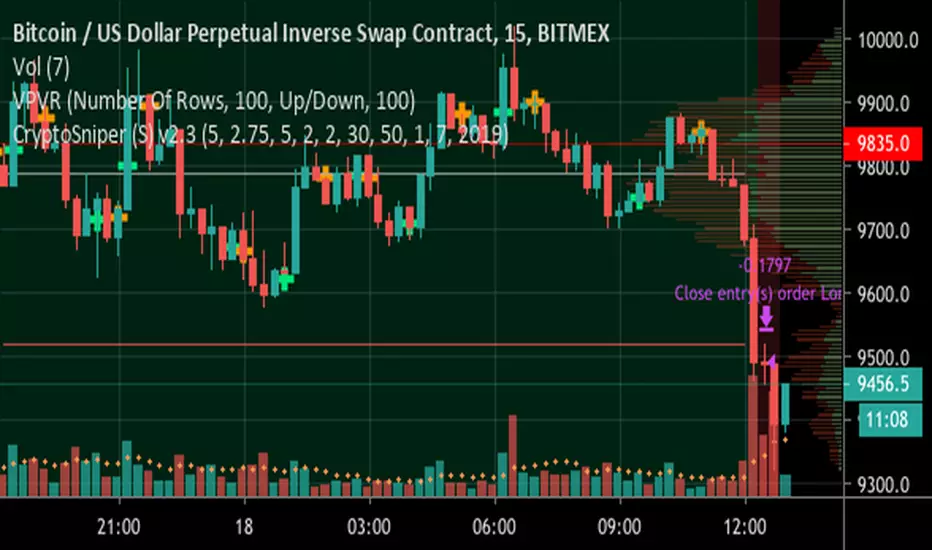
ck - CryptoSniper (Strategy) v2.1This strategy is radically different to the v1 script previously released.
It has ***NO REPAINTING*** - as such the algorithm had to change to remove it’s reliance on HMAs from future timeframes to establish trend, this is now accomplished with EMAs.
It is completely written in Pinescript v4.
It has integrated Stoploss and you can plot this & with the recommended Entry on the chart.
WARNING - This strategy has to be “tuned” to the instrument you are trading, for example, Bitcoin. The default settings work well for BTC/USD, XBT/USD on 15m chart timeframe but not for ETH/USD - it is possible the default settings will work with other crypto’s but I haven’t had time to test - if you find good settings PLEASE share them!
How to use:
1) Load up your favourite chart/instrument and select your favourite timeframe
2) Adjust the “signal” EMA and “baseline” EMA settings until you get the majority of uptrending moves highlighted with a green background and the majority of downtrending moves with a red background. The signal has to be faster (that is a lower number) than the baseline.
3) Adjust the “Sensitivity” - this will plot more green & orange Trigger points on the chart.
The strategy waits until in a trend, for example, a Long (green background) then waits for first green cross before opening a deal. It will Trigger a sell if the background turns red (downtrend) and a orange cross is printed.
4) Fine tuning:
A) Increase your profits by changing the Stoploss value - getting this right protects you from bad trades but also resets the indicator to provide another alert faster
B) You can increase the delay positions are opened or closed with the “Bar(s) offset to open position” and “Bar(s) offset to close position” settings. When you adjust these, 0 will buy/sell immediately when a Trigger cross is printed, 2 will wait until 2 bars/candles AFTER the Trigger cross prints to strat/close a position.
TIP: When adjusting indicator settings, load your chart and timeframe first.
Add the indicator/strategy (if you haven’t already).
Click the Strategy Tester tab at the bottom of the chart window so it is visible.
Open the strategy/indicator settings so you can see this wind AND the Strategy Tester display
Change a setting and click into a different setting input box, this will update the test results WITHOUT closing the settings window! This will save you a lot of time!
Write down any OK settings you find, you can come back later to fine tune them!
Please provide any feedback & let’s share the best settings for different crypto’s!
Bearish&Bullish Engulfing (created by LucaBono)Questo indicatore (o price action pattern) stampa sul grafico delle frecce o barre colorate (modificabili dalle impostazioni) quando si verificano entrambi i segnali del Bearish e Bullish Engulfing ufficiali, ovvero quando il corpo della candela è più ampio dell'intera candela precedente.
Il segnale LONG si effettua quando il massimo della Bullish bar viene rotto dalla candela successiva.
Il segnale SHORT viceversa si effettua alla rottura del minimo.
E' più facile trovare questo tipo di segnali su timefrime giornaliero e mercati come azioni, futures e titoli che non stanno aperti 24h.
Consiglio sempre di accompagnare questi segnali ad altri tipi di segnali o analisi per maggiorare le probabilità di successo e di tenuta del trade.
This indicator (or price action pattern) prints on the graph arrows or colored bars (which can be changed from the settings) when both official Bearish and Bullish Engulfing signals occur, ie when the body of the candle is wider than the entire previous candle.
The LONG signal is made when the maximum of the Bullish bar is broken by the next candle.
The SHORT signal, on the other hand, is performed when the minimum is broken.
It is easier to find this type of signals on daily timefrime and markets like stocks, futures and stocks that are not open 24h.
I always advise to accompany these signals to other types of signals or analyzes to increase the chances of success and stability of the trade.

GRID RELOADED 1.0Script for grid trading on Bitmex XBTUSD 5min
A quick description for the input parameters. I can detail privately the ones that are important:
Points between two same dir trades = how much the price must change before a new DCA can happen
Points between SHORTS = same for short trades
Global Take Profit points = take profit for all open positions expressed in the same units as the price
Global Stop Loss points = same as for profit
Take Profit points decrease per bar = this is how much the target global profit decreases each bar toward zero
Trend up to start a trade long = wait for the DEMA to show a long slope before opening new long positions
Max long position = max n. of long positions
Check trend on trade = wait for a positive/negative bar before long/short
Min Stochastic overbought/sold for trade = wait for the stochastic to be below/above this before long/short
Limit Orders long % below close price = place limit orders % before current price. the order could be left pending.
DEMA 1 Length = periods of DEMA for trends
HA Candles = toggle a pattern match to enter trades

EO_Momentum_OscillatorMomentum Oscillator works best with HA candles and works on all timeframes. Feel free to use it by adding to your favourites.
It plots a graphic showing whether to short or long, it starts with using shorter span of bars used for the calculation and then moves onto longer/more bars which can be seen in the last pane of the graph which shows 3 horizontal bars showing long or short. When all 3 confirm the same trend it can be taken as a strong signal.

EMAcrossover_RSI Buy/sell signal-TRXBTC_15min by rajista EMAcrossover_RSI Buy/sell signal Strategy
To be used in combination with Alerts script, both can be added to your tradingview charts (Chart time-frame should be set to 15min) like you add any other simple indicator.
Add this script to your favorites and once you have been granted access, you will be notified in your Tradingview notifications section, then you can go ahead and add these two scripts into your charts from your favorite section of Indicator menu in Tradingview.
Benefits of this strategy:
1> Fully automated buy/sell signals 24x7
2>Your trades will always be based on a certain entry and exit plan.
3>No emotions involved with these trading calls, so no chance of FOMO buying/Panic Sell
4>You can fully customize the settings with a simple click(customization details given below)
5>Its completely free of cost!!!
There are two parts of this automated trading call system:
1>Strategy script- Gives the buy/sell signals based on the settings provided.
2>Alert script- Gives Alert notifications in tradingview when a buy/sell call is made.
Principle of working is very simple to understand:
Stragey script makes:
Buy call - When the 9EMA crosses above the 21EMA or RSI level-20 is reached in 15min-Chart.
Sell call -When 9EMA crosses below the 21EMA or RSI level-70 is reached in 15min-Chart.
Above values of EMA's and RSI are default values , which can be changed easily in settings panel of Strategy script.
Alert Script allows you to add Alerts when these buy/sell calls are made.
To create a Buy call alert:
1> Click on the create alert icon in your chart (top-centre)
2>Click on Condition -drop down button and select EMAcross_rsi_Alerts
3>Below that bar you will see another bar titled "Buy"-click on its drop down menu and select "Crossing Down"
4>Below that bar right next to Value change 0 to 0.9.
5>Set expiration date for your alerts as per your wish
6>Ensure "Show Popup" and "Play sound" is checked
7>You can check option of sending the alert to your email also.
Finally click on create.
To create Sell Alert:
Repeat same process, except that, after step 2- Do this- change the "long" option to "short" by clicking on the drop down menu right next to the first bar.
Click on create, Finally both of your automated buy/sell call alerts will be configured.
I know its been 2-3 days since i tweeted about this strategy and now i am making it available, you can understand i had to put in a lot of working hours, towards creating the source code for the strategy script and then for alerts script and even more so towards finding the perfect default settings which can be used straight away by anyone, even if you are new in crypto trading, apart from the time which i dedicate to analyse charts and pass on the knowledge/info to you all.
My next post will be even more helpful to you people as i am currently testing "fully automated trading" yea you heard that right!! - This system will trade 24x7 for you guys/girls no matter wherever you are either you are sleeping or watching a movie, your trades would still be getting executed with a proper entery-exit plan on a crypto exchange.
SB_Elder Impulse SystemThe strategy is based on LazyBear's Elder Impulse System
Strategy(in layman terms):
Long: When the green bar in the Elder Impulse System's indicator shows up
Short: When the red bar in the Elder Impulse System's indicator shows up
Close trade/Profit booking: When the blue bar in the Elder Impulse System's indicator shows up
Original Idea:
Message in the script if you think of any modifications/ enhancements.
Donations/Tips... :) -
BTC: 1BjswGcRR6c23pka7qh5t5k56j46cuyyy2
ETH: 0x64fed71c9d6c931639c7ba4671aeb6b05e6b3781
LTC: LKT2ykQ8QSzzfTDB6Tnsf12xwYPjgq95h4

Noro's Trend SMA Strategy v1.4Trade strategy which uses only 2 SMA .
The slow SMA (blue) is used for definition of a trend
The fast SMA (red) is used for an entrance to the transaction
Recomended:
For H1
For crypto/fiat
Long = true (if it is profitable as a result of backtests)
Short = true (if it is profitable as a result of backtests)
Use Fast SMA = true
Fast SMA Period = 5
Slow SMA Period = 20
Bars = (2 for "BitCoin/Fiat" or 1 for "Fork/Fiat")
In the new version 1.4
- Parameters are added
Russian:
Перевожу на понятный. В новой версии 1.4 ничего не поменялось в логике, работает так же. Но добавлены новые параметры, можно поэкспериментировать с настройками, убедиться как что выгоднее.
Есть галка лонг и шорт. По умолчанию обе включены. Если убрать галку лонг, то исчезнут лонги вообще, если убрать шорт, то соответственно исчезнут шорты. По идее галку надо будет снимать если стратегия создает убыточные шорты, то их можно отключить. Смотреть в сводке показателей тестера стратегий профитны они или нет. По идее почти на всех парах крипто/фиат лучше ставить обе галки. Или убирайте галку шорт если не хотите шортить из религиозных соображений.
Добавлена галка отключающая быструю SMA. То есть если галку убрать то стратегия будет её игнорировать. Таким образом, параметр Fast SMA (который 5) перестанет влиять на результаты. Однако, скорее всего без этой галки станет только хуже. Но можете проверить. Позволяет убедиться что входить в сделку по быстрой SMA в среднем немного профитнее, чем входить где попало.
"Bars" - количество свечек одного цвета после после которых будет открываться сделка. По умолчанию 2. Можно от 0 до 3 ставить. Если 0 то цвет свечек игнорируется. Если 3, значит будет ждать 3 красных свечи подряд чтобы открыть лонг. Так же и с зелеными свечами для шорта. 2 - оптимально для пар типа биткойн/фиат. А для пар типа форк/фиат лучше ставить 1 свеча в параметре "Bars".

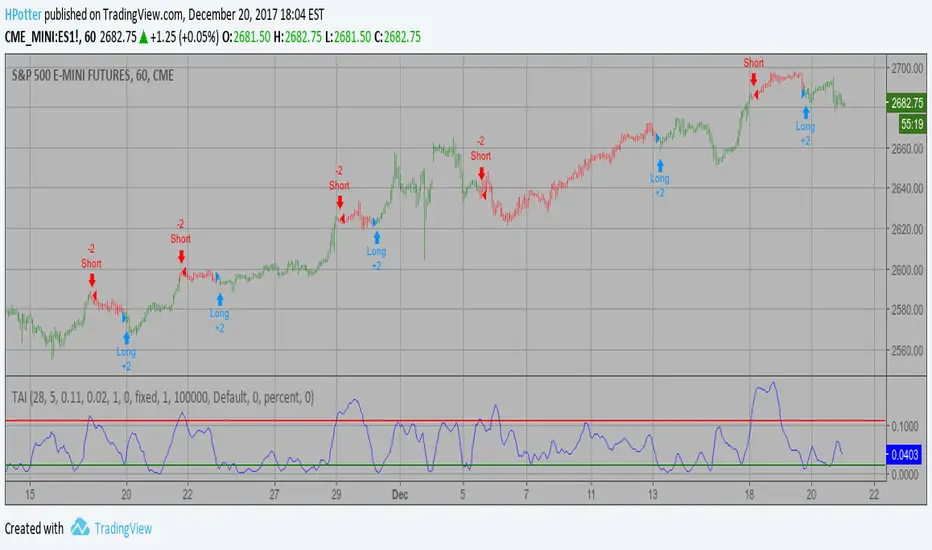
Trend Analysis Index Backtest In essence, it is simply the standard deviation of the last x bars of a
y-bar moving average. Thus, the TAI is a simple trend indicator when prices
trend with authority, the slope of the moving average increases, and when
prices meander in a trendless range, the slope of the moving average decreases.
You can change long to short in the Input Settings
WARNING:
- For purpose educate only
- This script to change bars colors.
Simply Stochastic Backtest This back testing strategy generates a long trade at the Open of the following
bar when the %K line crosses up UpBand line.
It generates a short trade at the Open of the following bar when the %K line
crosses down DownBand line.
You can change long to short in the Input Settings
WARNING:
- For purpose educate only
- This script to change bars colors.

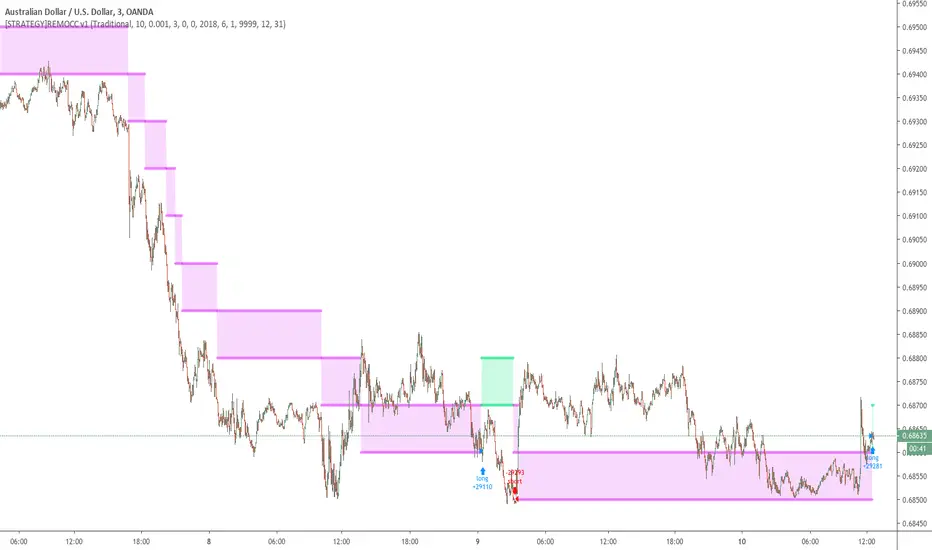
[STRATEGY]Renko Emulator OCC v1 by JustUncleLThis "Strategy" project has been created by request.
*** EXPERIMENTAL ***
*** USE AT YOUR OWN RISK ***
Description:
Strategy based around Renko Bar Chart emulator (ATR) with direction change used to signal long/short trades.
I have generally found that setting the strategy ATR resolution to 3-5x that of the chart you are viewing tends to yield the good results, regardless of which chart time used. Positions get taken automatically following THE Renko Bar after a crossover.
The emulated Renko bars can optionally be draw on the chart.
RSI Strategy with Auto Tuner (PF)# RSI Auto‑Tuner Strategy — How To Use
This document explains **how to use** the RSI Auto‑Tuner strategy. It intentionally avoids math and implementation details. Follow this as an operating guide.
---
## 1. What This Tool Is For
This strategy helps you:
* Discover **which RSI length works best** on a given ticker and timeframe
* Measure performance using **Profit Factor (PF)**
* Improve RSI performance on noisy markets by **transforming price first**
The auto‑tuner is a **research tool**, not a live trading signal generator.
---
## 2. Two Modes You Must Treat Differently
### Research Mode
Used to explore and discover parameters.
* Auto‑Tune: **ON**
* Parameters are allowed to change
* Results may look very good
* Overfitting risk is real
### Trading Mode
Used for forward testing or live trading.
* Auto‑Tune: **OFF**
* Parameters are fixed
* Behavior is stable and repeatable
* This is the only acceptable mode for live use
**Never trade live with Auto‑Tune enabled.**
---
## 3. Manual Mode (Trading Mode)
Use this after parameters are finalized.
Steps:
1. Set **Auto‑Tune = OFF**
2. Choose:
* Source (raw price or transformed price)
* RSI Length (manual, default 14)
* Oversold / Overbought levels
3. The strategy will:
* Enter long when RSI crosses up through Oversold
* Enter short when RSI crosses down through Overbought
* Flip positions on opposite signals
This mode is predictable and safe for forward testing.
---
## 4. Auto‑Tune Mode (Research Mode)
Use this to find optimal RSI lengths.
Steps:
1. Set **Auto‑Tune = ON**
2. Configure the search range:
* Minimum Length (default 5)
* Maximum Length (default 14)
* Step Size (default 1)
3. The strategy will:
* Internally simulate trades for each RSI length
* Track gross profit, gross loss, and trades
* Select the length with the highest Profit Factor
4. The best length is applied automatically
Auto‑Tune evaluates historical data only.
---
## 5. Using a Transform on Price (Critical)
RSI does **not** have to run on raw price.
You can significantly improve results by:
* Applying a **price transform** first
* Feeding the transformed series into the RSI Source input
Examples of transforms:
* Moving averages
* Low‑pass filters
* Butterworth filters
* Any smoother or denoiser
Why this works:
* Busy, wicky markets cause RSI to whipsaw
* Transforms remove micro‑noise
* RSI responds to structure instead of chaos
* Profit Factor often increases dramatically
Best practice:
* Auto‑tune on raw price
* Auto‑tune on transformed price
* Compare PF, trade count, and stability
---
## 6. Reading the Status Label
At the last bar, the on‑chart label shows:
* Whether Auto‑Tune is ON or OFF
* Whether candidates were built successfully
* Number of RSI lengths tested
* Best RSI length found
* Profit Factor and trade count
If Auto‑Tune is OFF, the label shows the manual length.
---
## 7. Recommended Workflow
1. Choose ticker and timeframe
2. Enable Auto‑Tune on **raw price**
3. Record best RSI length and PF
4. Enable Auto‑Tune on **transformed price**
5. Compare results
6. Lock parameters
7. Disable Auto‑Tune
8. Forward test
---
## 8. Warnings and Discipline
* High PF with few trades is unreliable
* Transforms can hide execution costs
* Always validate on a different period
* Auto‑Tune is a **lens**, not an edge
Treat this tool as a research microscope, not an autopilot.

OCC Strategy Optimized (MA 5 + Delayed TSL)# OCC Strategy Optimized (MA 5 + Delayed TSL) - User Guide
## Introduction
The **OCC Strategy Optimized** is an enhanced version of the classic **Open Close Cross (OCC)** strategy. This strategy is designed for high-precision trend following, utilizing the crossover logic of Open and Close moving averages to identify market shifts. This optimized version incorporates advanced risk management, multi-timeframe analysis, and a variety of moving average types to provide a robust trading solution for modern markets.
>
> **Special Thanks:** This strategy is based on the original work of **JustUncleL**, a renowned Pine Script developer. You can find their work and profile on TradingView here: (in.tradingview.com).
---
## Key Features
### 1. Optimized Core Logic
- **MA Period (Default: 5):** The strategy is tuned with a shorter MA length to reduce lag and capture trends earlier.
- **Crossing Logic:** Signals are generated when the Moving Average of the **Close** crosses the Moving Average of the **Open**.
### 2. Multi-Timeframe (MTF) Analysis
- **Alternate Resolution:** Use a higher timeframe (Resolution Multiplier) to filter out noise. By default, it uses $3 \times$ your current chart timeframe to confirm the trend.
- **Non-Repainting:** Includes an optional delay offset to ensure signals are confirmed and do not disappear (repaint) after the bar closes.
### 3. Advanced Risk Management
This script features a hierarchical exit system to protect your capital and lock in profits:
- **Fixed Stop Loss (Initial):** Protects against sudden market reversals immediately after entry.
- **Delayed Trailing Stop Loss (TSL):**
- **Activation Delay:** The TSL only activates after the trade reaches a specific profit threshold (e.g., 1%). This prevents being stopped out too early in the trade's development.
- **Ratchet Trail:** Once activated, the stop loss "ratchets" up/down, never moving backward, ensuring you lock in profits as the trend continues.
- **Take Profit (TP):** A fixed percentage target to exit the trade at a pre-defined profit level.
### 4. Versatility
- **12 MA Types:** Choose from SMA, EMA, DEMA, TEMA, WMA, VWMA, SMMA, HullMA, LSMA, ALMA, SSMA, and TMA.
- **Trade Direction:** Toggle between Long-only, Short-only, or Both.
- **Visuals:** Optional bar coloring to visualize the trend directly on the candlesticks.
---
## User Input Guide
### Core Settings
- **Use Alternate Resolution?:** Enable this to use the MTF logic.
- **Multiplier for Alternate Resolution:** How many charts higher the "filter" timeframe should be.
- **MA Type:** Select your preferred moving average smoothing method.
- **MA Period:** The length of the Open/Close averages.
- **Delay Open/Close MA:** Use `1` or higher to force non-repainting behavior.
### Risk Management Settings
- **Use Trailing Stop Loss?:** Enables the TSL system.
- **Trailing Stop %:** The distance the stop follows behind the price (Optimized Default: 1.5%).
- **TSL Activation % (Delay):** The profit % required before the TSL starts moving. (Optimized Default: 2.0% to ensure 0.5% profit is locked immediately).
- **Initial Fixed Stop Loss %:** Your hard stop if the trade immediately goes against you.
- **Take Profit %:** Your ultimate profit target for the trade.
---
## How to Trade with This Strategy
1. **Identify the Trend:** Look for the Moving Average lines (Close vs Open) to cross.
2. **Wait for Confirmation:** If using MTF, ensure the higher timeframe also shows a trend change.
3. **Manage the Trade:** Let the TSL work. With the default **2.0% Activation** and **1.5% Trail**, the strategy will automatically lock in **0.5% profit** the moment the threshold is hit, then follow the price higher.
4. **Position Sizing:** Adjust the `Properties` tab in the script settings to match your desired capital allocation (Default is 10% of equity).
---
## Recommended Settings
1. Trialing < Activation
2. Check ranging
## Credits
Original Strategy by: **JustUncleL**
Optimized and Enhanced by: **Antigravity AI**

Heikin Ashi Wick Strategy
🔥 Heikin Ashi Wick Momentum Strategy
“Trade momentum decay before the trend breaks.
>> FOCUS ON WICKS, NOT ONLY CANDLE COLOR<<
What Makes This Different (Traffic Driver)
✔ Uses Heikin Ashi wicks (almost nobody does this correctly)
✔ Captures trend continuation, not breakouts
✔ Exits before momentum collapse, not after
✔ Non-repainting
✔ Clean charts, instant readability
This Strategy Is REALLY Trading
This is a Heikin Ashi momentum-decay system:
• Enters when trend is strong but not euphoric
• Exits when:
o Trend stops probing higher
o Sellers gain relative strength
It avoids:
• Chasing strong breakout candles
• Holding through momentum rollovers
Candle Type Used: Heikin Ashi (manually calculated)
NOTE: The script does not use regular candles.
It reconstructs Heikin Ashi (HA) candles from raw OHLC:
• HA Close = average of open, high, low, close
• HA Open = midpoint of prior HA candle (smoothed)
• HA High / Low = extremes of HA open/close vs real high/low
➡️ This filters noise and emphasizes trend structure and momentum.
Strengths
✅ Works well in strong, smooth trends
✅ Very clean logic (no indicators)
✅ Non-repainting
✅ Early exits protect capital
Best Use
This works best on:
• Daily timeframe
• Strong trend ETFs / megacaps
o QQQ
o SPY
o NVDA, MSFT, AAPL
• When combined with:
o EMA 21 trend filter (your preference)
o Market regime filter (e.g., above 50/200 SMA)
o Rising 10 EMA and 20 EMA
________________________________________
8️⃣ Weaknesses (Important)
⚠️ No stop loss (only structure-based exits)
⚠️ Can exit too early in explosive trends
⚠️ Will chop in sideways markets
⚠️ No volatility filter (ATR, EMA, regime)
How to Avoid the Weaknesses — Summary
Turn the setup from a concept into a robust strategy by adding these controls:
1. Trade Only Trends
o Require price above EMA-21 (optionally EMA-21 > EMA-50)
o Eliminates chop and sideways markets
2. Improve Exits (Avoid Leaving Winners Too Early)
o Partial exit when upper wick disappears
o Full exit only when lower wick dominates
o Optional: require 2 consecutive exit candles
3. Add Risk Protection
o Use a volatility stop: ~1.5× ATR(14) below entry or below HA swing low
o Protects against gaps and sudden reversals
4. Filter Weak Signals
o Require meaningful wick size (≈30–40% of candle range)
o Avoids low-quality indecision candles
5. Avoid Bad Volatility
o Skip entries when ATR is expanding aggressively
o Focus on calmer, controllable trends
6. Limit Time in Trade
o Add a max bars hold (e.g., 10–15 bars on daily)
o Prevents capital getting stuck in fading trends
⚠️ Educational use only. Not financial advice. Trading involves risk and losses can exceed expectations. Past performance does not guarantee future results. Use at your own risk.

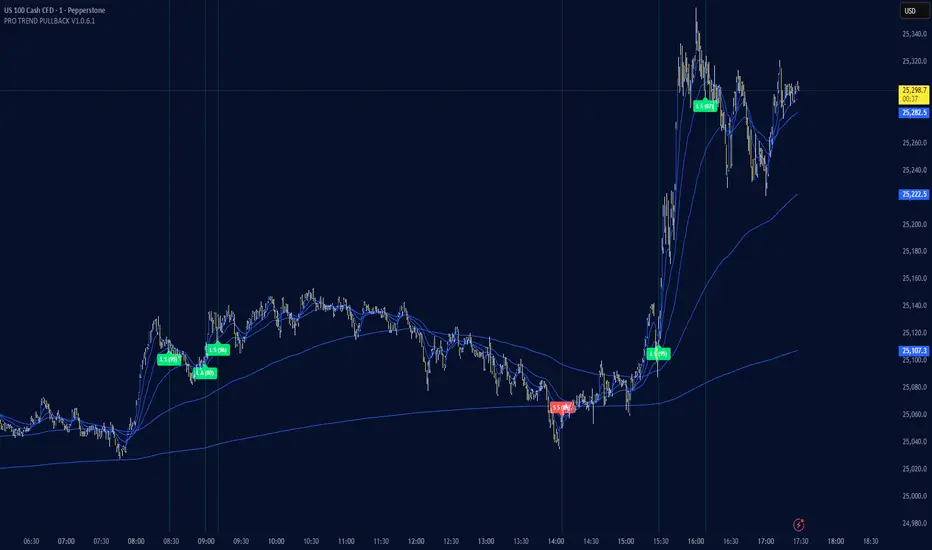
PRO TREND PULLBACK
PRO TREND PULLBACK – trend-following pullback strategy (NAS100 / US30 focus, 1m)
What is this?
- EMA-based trend + pullback entry logic, with optional VWAP and EMA-order filters.
- Built-in preset system for NAS100/US30 on the 1-minute timeframe (Safe / Balanced / Turbo), plus a fully manual “Custom” mode.
Core logic (quick overview)
1) Trend filter:
- Above EMA TREND: long bias, below: short bias
- Optional: VWAP filter, EMA order filter, HTF EMA TREND filter, Multi-EMA direction filter
2) Pullback trigger:
- Pullback level selectable: FAST / MID / SLOW EMA
- Long: touch + bullish confirmation, Short: touch + bearish confirmation (toggleable)
3) Quality filters:
- RSI zone filter (separate for long/short)
- Candle filters: doji / oversized candle / wick (pin-zone) / low-volatility block
- ADX trend-strength filter (via ta.dmi), entry cooldown (bar-based)
- Sideways/range handling: Filter / Penalty / Edge-only mode (ADX + slope + “chop” cross counter)
Risk management / trade management (backtest & automation)
- ATR-based SL/TP: SL, TP1, TP2 (TP1 partial close optional)
- Break-even trigger based on ATR (optional)
- “Max bars in trade” time-based exit (optional)
- Volatility-regime scaling: dynamic SL/TP scaling in high-volatility regimes (optional)
Signal grading (Grade / Score)
- Radar-style scoring + grade: S / A / B / C
- Structural penalties (e.g., lower low / higher high, EMA50 touch, proximity to swing high)
- Trend “fatigue” penalty (down-weights repeated same-direction signals)
- Optional “Lux SMC-lite” score layer (BOS/CHoCH + OB + EQH/EQL + Premium/Discount)
- Optional “ABC-lite (Elliott A-B-C)” score layer (pivot-based)
Alerts / Robot JSON (for webhook)
- Built-in JSON alerts via alert() with watchlist-friendly fields:
secret, strategy, signal, signal_type, symbol, timeframe, time (UTC), price, + optional grade/score
- TradingView alert setup: Condition = “Any alert() function call”
(Webhook URL + your own secret is recommended)
Important notes
- This is a STRATEGY (strategy) intended for backtesting and signal logic. Before live use, test thoroughly and account for slippage/spread differences.
- Pivot-based components (SMC-lite / ABC-lite) are naturally confirmation-based (delayed), so “structure/ABC” values do not print instantly.
- Not financial advice. Use at your own risk.
Suggested starting setup
- Presets: Auto + Balanced (NAS100/US30 1m), then fine-tune with Safe/Turbo.
- For robot mode: turn useRobotAlert=ON and change payloadSecret to a unique value.
Antigravity OCC Strategy (MA 5 + Delayed TSL)# OCC Strategy Optimized (MA 5 + Delayed TSL) - User Guide
## Introduction
The **OCC Strategy Optimized** is an enhanced version of the classic **Open Close Cross (OCC)** strategy. This strategy is designed for high-precision trend following, utilizing the crossover logic of Open and Close moving averages to identify market shifts. This optimized version incorporates advanced risk management, multi-timeframe analysis, and a variety of moving average types to provide a robust trading solution for modern markets.
>
> **Special Thanks:** This strategy is based on the original work of **JustUncleL**, a renowned Pine Script developer. You can find their work and profile on TradingView here: (in.tradingview.com).
---
## Key Features
### 1. Optimized Core Logic
- **MA Period (Default: 5):** The strategy is tuned with a shorter MA length to reduce lag and capture trends earlier.
- **Crossing Logic:** Signals are generated when the Moving Average of the **Close** crosses the Moving Average of the **Open**.
### 2. Multi-Timeframe (MTF) Analysis
- **Alternate Resolution:** Use a higher timeframe (Resolution Multiplier) to filter out noise. By default, it uses $3 \times$ your current chart timeframe to confirm the trend.
- **Non-Repainting:** Includes an optional delay offset to ensure signals are confirmed and do not disappear (repaint) after the bar closes.
### 3. Advanced Risk Management
This script features a hierarchical exit system to protect your capital and lock in profits:
- **Fixed Stop Loss (Initial):** Protects against sudden market reversals immediately after entry.
- **Delayed Trailing Stop Loss (TSL):**
- **Activation Delay:** The TSL only activates after the trade reaches a specific profit threshold (e.g., 1%). This prevents being stopped out too early in the trade's development.
- **Ratchet Trail:** Once activated, the stop loss "ratchets" up/down, never moving backward, ensuring you lock in profits as the trend continues.
- **Take Profit (TP):** A fixed percentage target to exit the trade at a pre-defined profit level.
### 4. Versatility
- **12 MA Types:** Choose from SMA, EMA, DEMA, TEMA, WMA, VWMA, SMMA, HullMA, LSMA, ALMA, SSMA, and TMA.
- **Trade Direction:** Toggle between Long-only, Short-only, or Both.
- **Visuals:** Optional bar coloring to visualize the trend directly on the candlesticks.
---
## User Input Guide
### Core Settings
- **Use Alternate Resolution?:** Enable this to use the MTF logic.
- **Multiplier for Alternate Resolution:** How many charts higher the "filter" timeframe should be.
- **MA Type:** Select your preferred moving average smoothing method.
- **MA Period:** The length of the Open/Close averages.
- **Delay Open/Close MA:** Use `1` or higher to force non-repainting behavior.
### Risk Management Settings
- **Use Trailing Stop Loss?:** Enables the TSL system.
- **Trailing Stop %:** The distance the stop follows behind the price.
- **TSL Activation % (Delay):** The profit % required before the TSL starts moving.
- **Initial Fixed Stop Loss %:** Your hard stop if the trade immediately goes against you.
- **Take Profit %:** Your ultimate profit target for the trade.
---
## How to Trade with This Strategy
1. **Identify the Trend:** Look for the Moving Average lines (Close vs Open) to cross.
2. **Wait for Confirmation:** If using MTF, ensure the higher timeframe also shows a trend change.
3. **Manage the Trade:** Let the TSL work. Once the trade hits the activation threshold, the TSL will take over, protecting your runner.
4. **Position Sizing:** Adjust the `Properties` tab in the script settings to match your desired capital allocation (Default is 10% of equity).
---
## Credits
Original Strategy by: **JustUncleL**
Optimized and Enhanced by: **Antigravity AI**

AlgoIndex NQ/MNQ FuturesAlgoIndex Futures v3.15 - NQ/MNQ (10-Minute RTH)
This strategy is specifically tailored for trading CME Nasdaq futures - NQ and MNQ, including continuous symbols such as NQ1!/MNQ1!. It is optimized for a 10-minute chart during U.S. Regular Trading Hours (RTH), utilizing session settings defined in the Inputs. This strategy is not intended for other futures contracts or markets.
Core Concept
The strategy employs an ATR-based trend-band model similar to Supertrend for identifying directional mechanism changes in NQ/MNQ. Trade signals are evaluated at the bar close, incorporating session and time-based safety techniques to mitigate lower-quality trading opportunities near session boundaries.
Recommended Use (Optimized Defaults)
The default input parameters are fine-tuned for NQ/MNQ on the 10-minute chart. Users are encouraged to utilize these defaults initially and to make incremental adjustments to one variable at a time to understand the impact on the strategy's performance, trading frequency, and risk profile.
Configurable Inputs
- Take Profit / Stop Loss Settings:
- Enable Stop Loss and define Stop Loss (Points)
- Enable Take Profit and define Take Profit (Points)
- Enable Trailing Stop and set both Trailing Stop (Points) and Trailing Offset (Points)
- Time Avoidance Filter:
- Enable Time Avoidance
- Avoid First X Minutes
- Avoid Last X Minutes
- Display Avoidance Zones (visual overlay)
- Session Filter and End-of-Day Management:
- Enable Session Filter
- Define Trading Session (default: 09:30-16:00)
- Select Session Timezone
- Option to Close Positions at Session End
- Specify EOD Close Minutes Before (default: 20)
- Safety Controls:
- Option to Close Before Holidays (when enabled, this feature allows the strategy to flatten positions prior to holiday or early close conditions)
- Automation Settings (Optional):
- Ticker Override (optional)
- Define Contracts (position size)
- Strategy Configuration:
- Trade Direction: Both / Long Only / Short Only
- Visual Configuration:
- Option to Show Buy/Sell Signals
- Highlight Trend Zones
- Display Info Table
- Customizable Bull/Bear Colors
Alerts and Automation (Optional)
This strategy can generate order-fill alert payloads for hooking into webhook-based automation solutions. Keep in mind to validate your alert type and your bridge/broker configuration during Replay and paper trading. Note that reversals may trigger two sequential actions (e.g., exit followed by new entry).
Backtest Notes (Optional)
For more precise historical fill data, consider enabling TradingView’s Bar Magnifier in Strategy Properties. Always apply consistent assumptions for commission and slippage when comparing backtest results.
Disclaimer
This script is intended for informational and educational purposes only and does not constitute investment advice. Trading futures carries significant risk and may result in losses that exceed the initial deposit. Backtested results are hypothetical and do not guarantee future performance.

Customer Short strategy A5.1 + Session + CBL SLFor my customer.
HalfTrend Directional Framework (A5.1)
Used for primary trend recognition and breakout validation.
Session-Based Volatility Windows
Trades only occur within specific high-liquidity windows (e.g., 08:30–12:30 and 12:30–16:30), improving fill quality and reducing noise.
Three-Bar Opening Range Model
The first three 5-minute bars define:
session high
session low
These become structural breakout levels:
price > range high → long-bias
price < range low → short-bias
CBL (Guppy Count-Back Line) Stop-Loss
Instead of using ATR or static percentage stops, Libra_S relies on CBL to:
avoid premature exits during healthy pullbacks
capture trend persistence
provide structure-based invalidation

ORB Strategy: Extensions & Custom SL (EOD & Live Lines)That's a great request. Since you've now built a complex Pine Script Strategy with several user-configurable risk management, targeting, and exit options, the description should focus on the systematic rules used for entering, managing, and exiting trades.
Here is a clear, written description of the trading strategy you have built:
Trading Strategy Description: ORB Extension Breakout with Custom Stop, Live Tracking, and EOD Exit
This strategy is a systematic, momentum-based system designed for intraday trading. It operates on the principle of an Opening Range Breakout (ORB), utilizing the initial market consolidation to project high-probability targets, while offering multiple methods for managing risk and enforcing a mandatory end-of-day closure.
1. Market Identification (The Opening Range)
The strategy first defines the market's initial boundaries and volatility:
Session Window: The strategy calculates the Opening Range (OR) over a user-defined time period (default: 9:30 AM to 10:30 AM New York Time).
ORB Levels: Two key price levels are established and locked once the time window closes:
Wick High/Low: The absolute highest and lowest prices of the session. These serve as the entry trigger lines.
Body High/Low (Shaded Range): The highest and lowest open/close prices of the session. The height of this range is used as the basis for calculating all targets and stops.
2. Entry Rule (The Breakout)
The strategy waits passively for a breakout that confirms direction and ensures the move has not yet reached its immediate target.
Trigger Condition: A trade is signaled when a candle closes either:
Above the Wick High (for a Long entry).
Below the Wick Low (for a Short entry).
Constraint (Fresh Breakout): The entry is invalidated if the breakout candle's price action (High for Long, Low for Short) has already touched or surpassed the projected Take Profit (0.5 Extension) level before the candle closes.
Execution: The entry is a Market Order executed on the candle that meets the trigger conditions, subject to a user-defined Entry Delay (default 0 bars).
Direction Control: The user can select to trade Long Only, Short Only, or Both.
3. Exit and Risk Management
All trades are placed with simultaneous Take Profit and Stop Loss orders (a bracket order) upon entry.
A. Take Profit (TP)
The Take Profit is set at the 0.5 Extension of the Shaded Range (Body Range).
Calculation: The distance from the Body High/Low to the TP level is exactly 50% of the total height of the Shaded Range.
B. Stop Loss (SL)
The Stop Loss is dynamically calculated based on a user-selected method for risk control:
Range 0.5 (Body Range): The SL is placed an equal distance (0.5 times the Body Range height) outside the opposite side of the Body Range.
ATR Multiple: The Stop Loss distance is calculated as a user-defined Multiplier times the Average True Range (ATR).
Recent Swing Low/High: The Stop Loss is placed based on a structural low (for Long) or high (for Short) within a user-defined lookback period.
C. End-of-Day (EOD) Exit
Any open position is forced closed at the market price if it is still open when the user-defined closing time (default: 16:00 HHMM) is reached. This prevents carrying intraday risk overnight.
4. Visualization
The strategy includes comprehensive visual cues for analysis:
ORB Drawing: Displays the Wick High/Low and the shaded Body Range.
Breakout Signals: Highlights the specific bar where the validated entry signal occurs.
Closed Trades: Draws persistent lines for the Entry and Exit prices of the last few closed trades.
Live Open Trades: Draws persistent lines for the current Entry Price, active Take Profit Level, and active Stop Loss Level for any open position.

Advanced Breakout System v2.0Advanced Breakout System v2.0
Developed by: Mohammed Bedaiwi
This script hunts for high-probability breakouts by combining price consolidation zones, volume spikes vs. average volume, smart money flow (OBV), and a Momentum Override for explosive moves that skip consolidation. Additionally, it automatically identifies and plots Support and Resistance levels with price labels to help you visualize market structure.
The system follows a "Watch & Confirm" logic: it first prints a WATCH setup, then a BUY only if price confirms strength.
💡 JUSTIFICATION OF CONCEPTS (MASHUP & ORIGINALITY)
This script is an original mashup combining several analytical concepts to address common breakout failures:
Volatility Compression Engine: Uses built-in functions like ta.highest() and ta.lowest() to mathematically define the setup phase where price volatility is compressed below a user-defined threshold.
Volume Spike Confirmation: The breakout must be confirmed by a volume increase greater than a moving average of volume, signaling strong market interest.
Smart Volume Filter (OBV): This is the key component. By checking if ta.obv is above its own Moving Average, we confirm that accumulation has been occurring during the consolidation period, suggesting institutional positioning before the price break.
Multi-Exit Risk System: Employs dynamic exits (EMA cross, volume dump, bearish pattern) instead of static stop-losses to manage risk adaptively based on real-time market action.
Market Structure Visualization: The script also includes a Support & Resistance engine to plot key swing pivots and price labels for visual context.
✅ STRATEGY RESULTS & POLICY COMPLIANCE
To ensure non-misleading and transparent backtesting results, this strategy is published with the following fully compliant properties:
Dataset Compliance: The backtest is performed on the CMTL Daily (1D) chart across a long history, generating 201 total trades. This significantly exceeds the minimum requirement of 100 trades, providing a robust test dataset.
Risk Control: The strategy uses a conservative order size set to 2% of equity (default_qty_value=2), strictly adhering to the sustainable risk recommendation of 5-10% of equity per trade.
Transaction Costs: Realistic trading conditions are modeled using 0.07% commission and 3 ticks slippage to prevent the overestimation of profitability.
⚙️ VISUAL GUIDE & SIGNAL LOGIC
Key Color Legend (Visual Guide):
WATCH – Setup (Yellow Arrow Down): Potential breakout setup detected.
BUY – Confirmation (Green Arrow Up): Confirmed breakout, triggered when price trades above the high of the WATCH candle.
SELL – Break (Orange Arrow): Short-term trend weakness, triggered when price closes below the Fast EMA (9).
SELL – Dump (Dark Red Arrow): Distribution / volume dump, triggered by a bearish candle with abnormally high volume.
SELL – Pattern (Purple Arrow): Bearish price-action pattern (such as a bearish engulfing).
Support & Resistance Lines (Red/Green): Small horizontal lines plotted at key swing points with exact price labels.
⌨️ INPUTS (DEFAULT SETTINGS)
Entry settings: Consolidation Lookback (default 20) = bars used to detect consolidation. Consolidation Range % (default 12%) = max allowed range size. Volume Spike Multiplier (default 1.2) = factor above average volume to count as a spike. Force Signal on Big Moves (default ON) = forces a WATCH signal on high-momentum moves.
Exit settings: Enable Fast Exit (EMA 9) toggles the SELL – Break signal. Dump Volume Multiplier defines what counts as “dump” volume.
Support & Resistance: Adjustable Pivot Left/Right bars control the sensitivity of the support and resistance lines.
⚠️ Disclaimer Trading involves significant risk of loss. This script is for educational and informational purposes only and is not financial advice or a recommendation to buy or sell any asset. BUY and SELL signals are rule-based and derived from historical behavior and do not guarantee future performance. Always use your own analysis and risk management. This is an open-source strategy; users are encouraged to test it across different symbols and timeframes.
