10yr, 20yr, 30yr Averages: Month/Month % Change; SeasonalityCalculates 10yr, 20yr and 30yr averages for month/month % change
~shows seasonal tendencies in assets (best in commodities). In above chart: August is a seasonally bullish month for Gold: All the averages agree. And January is the most seasonally bullish month.
~averages represent current month/previous month. i.e. Jan22 average % change represents whole of jan22 / whole of dec21
~designed for daily timeframe only: I found calling monthly data too buggy to work with, and I thought weekly basis may be less precise (though it would certainly reduce calculation time!)
~choose input year, and see the previous 10yrs of monthly % change readings, and previous 10yrs Average, 20yr Average, 30yr Average for the respective month. Labels table is always anchored to input year.
~user inputs: colors | label sizes | decimal places | source expression for averages | year | show/hide various sections
~multi-yr averges always print, i.e if only 10yrs history => 10yr Av = 20yr Av = 30yr Av. 'History Available' label helps here.
Based on my previously publised script: "Month/Month Percentage % Change, Historical; Seasonal Tendency"
Publishing this as seperate indicator because:
~significantly slower to load (around 13 seconds)
~non-premium users may not have the historical bars available to use 20yr or 30yr averages =>> prefer the lite/speedier version
~~tips~~
~after loading, touch the new right scale; then can drag the table as you like and seperate it from price chart
##Debugging/tweaking##
Comment-in the block at the end:
~test/verifify specific array elements elements.
~see the script calculation/load time
~~other ideas ~~
~could tweak the array.slice values in lines 313 - 355 to show the last 3 consecutive 10yr averages instead (i.e. change 0, 10 | 0,20 | 0, 30 to 0, 10 | 10, 20 | 20,30)
~add 40yr average by adding another block to each of the array functions, and tweaking the respective labels after line 313 (though this would likely add another 5 seconds to the load time)
~use alternative method for getting obtaining multi-year values from individual month elements. I used array.avg. You could try array.median, array.mode, array.variance, array.max, array.min (lines 313-355)
In den Scripts nach "a股板块+沪深两市+股价不超过10元的股票+技术形态好" suchen

Month/Month Percentage % Change, Historical; Seasonal TendencyTable of monthly % changes in Average Price over the last 10 years (or the 10 yrs prior to input year).
Useful for gauging seasonal tendencies of an asset; backtesting monthly volatility and bullish/bearish tendency.
~~User Inputs~~
Choose measure of average: sma(close), sma(ohlc4), vwap(close), vwma(close).
Show last 10yrs, with 10yr average % change, or to just show single year.
Chose input year; with the indicator auto calculating the prior 10 years.
Choose color for labels and size for labels; choose +Ve value color and -Ve value color.
Set 'Daily bars in month': 21 for Forex/Commodities/Indices; 30 for Crypto.
Set precision: decimal places
~~notes~~
-designed for use on Daily timeframe (tradingview is buggy on monthly timeframe calculations, and less precise on weekly timeframe calculations).
-where Current month of year has not occurred yet, will print 9yr average.
-calculates the average change of displayed month compared to the previous month: i.e. Jan22 value represents whole of Jan22 compared to whole of Dec21.
-table displays on the chart over the input year; so for ES, with 2010 selected; shows values from 2001-2010, displaying across 2010-2011 on the chart.
-plots on seperate right hand side scale, so can be shrunk and dragged vertically.
-thanks to @gabx11 for the suggestion which inspired me to write this

RSI Trend Heatmap in Multi TimeframesRSI Trend Heatmap in Multi Timeframes
Description
Sometimes you want to look at the RSI Trend across multiple time frames.
You have to waste time browsing through them.
So we've put together every time frame you want to see in one indicator.
We have 10 layers of RSI Trend heatmap available for you.
You can set the timeframe as you want on the Settings page.
Description of Parameter RSI Setting ** You can change it by setting.
RSI Trend Length : (Default 50)
Source : (Default close)
RSI Sideways Length : (Default 2 = RSI between 48 .. 52)
Description of Parameter RSI Timeframe ** You can change it by setting.
""=None,
"M"=1Month, "2W"=2Weeks, "W"=1Week,
"3D"=3Days, "2D"=2Days, "D"=1Day,
"720"=12Hours, "480"=4Hours, "240"=4Hours, "180"=3Hours, "120"=2Hours,
"60"=60Minutes, "30"=30Minutes, "15"=15Minutes, "5"=5Minutes, "1"=1Minute
Default Configurate of RSI Timeframe (for a time frame of 1 hour to 1 day)
"W"= Timeframe 1 month shown in line 90-100 --> Represent Long Trend of RSI
---------------------------------------
"D2"= Timeframe 2 days shown in line 70-80 --> Represent Trend of RSI
"D"= Timeframe 1 day shown in line 60-70 --> Represent Trend of RSI
---------------------------------------
"240"= Timeframe 3 hours shown in line 40-50 --> Represent Signal Up/Signal Down/Divergence of RSI
"120"= Timeframe 2 hours shown in line 30-40 --> Represent Signal Up/Signal Down/Divergence of RSI
"60"= Timeframe 1 hour shown in line 20-30 --> Represent Signal Up/Signal Down/Divergence of RSI
"30"= Timeframe 30 minutes shown in line 10-20 --> Represent Signal Up/Signal Down/Divergence of RSI
"15"= Timeframe 15 minutes shown in line 00-10 --> Represent Signal Up/Signal Down/Divergence of RSI
Description of Colors
Dark Bule = Extreme Uptrend / Overbought / Bull Market (RSI > 67)
Light Bule = Uptrend (RSI between 50-52 .. 67)
Yellow = Sideways Trend / Trend Reversal (RSI between 48 .. 52) ** You can change it by setting.
Light Red = Downtrend (RSI between 33 .. 48-50)
Dark Red = Extreme Downtrend / Oversold / Bear Market (RSI < 33)
How to use
1. You must first know what the main trend of the RSI is (look at the 60-80 line). If it is red, it is a downtrend. and if it's blue shows that it is an uptrend
2. Throughout the period of the main trend There will always be a reversal of the sub-trend. (Can see from the 0-50 line), but eventually will return to follow the main trend.
3. Unless the sub trend persists for a long time until the main trend changes.

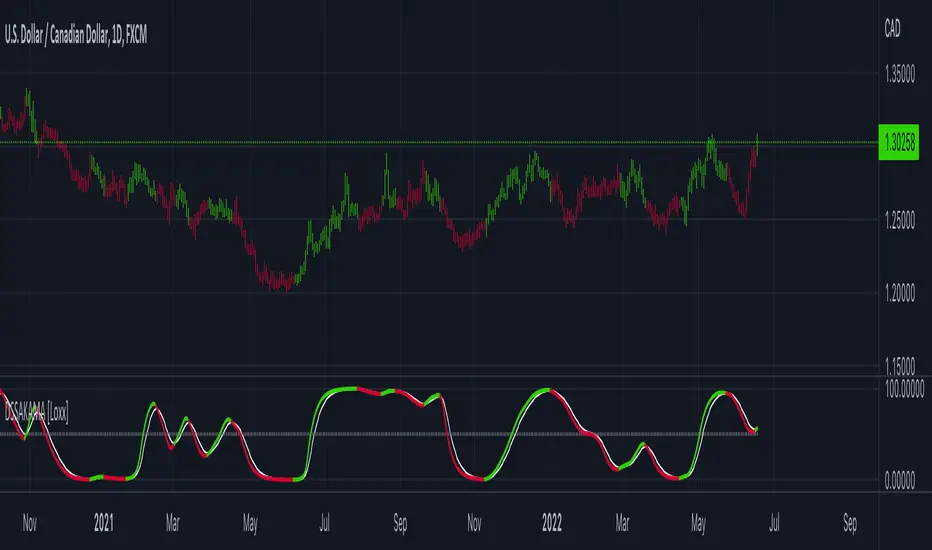
DSS of Advanced Kaufman AMA [Loxx]DSS of Advanced Kaufman AMA is a double smoothed stochastic oscillator using a Kaufman adaptive moving average with the option of using the Jurik Fractal Dimension Adaptive calculation. This helps smooth the stochastic oscillator thereby making it easier to identify reversals and trends.
What is the double smoothed stochastic?
The Double Smoothed Stochastic indicator was created by William Blau. It applies Exponential Moving Averages (EMAs) of two different periods to a standard Stochastic %K. The components that construct the Stochastic Oscillator are first smoothed with the two EMAs. Then, the smoothed components are plugged into the standard Stochastic formula to calculate the indicator.
What is KAMA?
Developed by Perry Kaufman, Kaufman's Adaptive Moving Average (KAMA) is a moving average designed to account for market noise or volatility . KAMA will closely follow prices when the price swings are relatively small and the noise is low. KAMA will adjust when the price swings widen and follow prices from a greater distance. This trend-following indicator can be used to identify the overall trend, time turning points and filter price movements.
What is the efficiency ratio?
In statistical terms, the Efficiency Ratio tells us the fractal efficiency of price changes. ER fluctuates between 1 and 0, but these extremes are the exception, not the norm. ER would be 1 if prices moved up 10 consecutive periods or down 10 consecutive periods. ER would be zero if price is unchanged over the 10 periods.
What is Jurik Fractal Dimension?
There is a weak and a strong way to measure the random quality of a time series.
The weak way is to use the random walk index ( RWI ). You can download it from the Omega web site. It makes the assumption that the market is moving randomly with an average distance D per move and proposes an amount the market should have changed over N bars of time. If the market has traveled less, then the action is considered random, otherwise it's considered trending.
The problem with this method is that taking the average distance is valid for a Normal (Gaussian) distribution of price activity. However, price action is rarely Normal, with large price jumps occuring much more frequently than a Normal distribution would expect. Consequently, big jumps throw the RWI way off, producing invalid results.
The strong way is to not make any assumption regarding the distribution of price changes and, instead, measure the fractal dimension of the time series. Fractal Dimension requires a lot of data to be accurate. If you are trading 30 minute bars, use a multi-chart where this indicator is running on 5 minute bars and you are trading on 30 minute bars.
Included
-Toggle bar colors on/offf
Bollinger CloudsThis indicator plots Bollinger Bands for your current timeframe (e.g 5 minutes) and also plots the Bollinger Bands for a higher timeframe (15 minutes for 5 minute timeframe). Then the gaps between the current and higher timeframe upper and lower bands is filled to create clouds which can be used as entry zones. Like Bollinger Bands, this indicator shouldn't be solely used for entries, use it in conjunction with other indicators.
Bollinger Band Timeframes
Current / Higher
1 minute / 5 minutes
3 minutes / 10 minutes
5 minutes / 15 minutes
10 minutes / 30 minutes
15 minutes / 1 hour
30 minutes / 2 hours
45 minutes / 1.5 hours
1 hour / 4 hours
2 hours / 8 hours
2.5 hours / 10 hours
4 hours / 1 Day
1 Day / 3 Days
3 Days / 9 Days
5 Days / 2 Weeks
1 Week / 1 Month

Ichimoku Kinko HyoThis indicator is adding to the original indicator Ichimoku Cloud some visual informations.
Be aware of settings that are by default 10, 30, 60, while in the original indicator, default settings are 9, 26, 52. These are commonly consider like "crypto settings".
Tenkan = blue line
Kijun = orange line
SSB = red line
This indicator display three categories of signals that are given by the Ichimoku indicator:
- tenkan / kijun crosses ;
- breaks of mid prices for the different time horizon ;
- bar coloring depending of the trend
Let's review more in deep each of these elements.
Tenkan / Kijun crosses
When the tenkan crossover the kijun, this is called gold cross and it's display by a green triangle at the bottom of the chart.
When the tenkan crossunder the kijun, this is called death cross and it's display by a red triangle at the top of the chart.
I advise to not enter long or short only on this signal because it can be fake, especially during ranges.
To confirm the signal, we need to wait for a movement of the kijun in the same side of the cross. See first arrow on the chart.
Breaks of mid prices
Ichimoku is composed of three han-le lines that displays mid-price of the last candles depending on the settings (10, 30, 60).
Tenkan show us the mid-price of the last 10 candles (short term)
Kijun show us the mid-price of the last 30 candles (mid term)
SSB show us the mid-price of the last 60 candles (long term)
Break of tenkan by the price is the first signal that Ichimoku gives us before a reversal of the trend. This signal is display by a blue triangle.
Then, happened the break of kijun line follow by the break of the SSB. These are display respectively by an orange triangle and a red triangle.
Same advise, don't enter long or short only on break of these lines.
However, tenkan and kijun breaks can be used as exit point.
Bar coloring
The bar coloring display the strength of the trend:
- green candle: strong bullish trend - this happen when the current price is above tenkan, kijun and SSB ;
- blue candle: potential starting of a bullish trend - this happen when the current price is above tenkan and kijun but below the SSB ;
- no colored candle: no trend, market is in a range - this happen when the current price is above tenkan and below kijun and SSB or when the current price is below tenkan and above kijun and SSB ;
- orange candle: potential starting of a bearish trend - this happen when the current price is below tenkan and kijun but above SSB ;
- red candle: strong bearish trend - this happen when the current price is below tenkan, kijun and SSB
How to use to enter / exit trades
First of all, we need confirmations to enter in the side of the trend.
The first signal that the indicator gives us is the break of tenkan, follow by the break of kijun. Candles becomes blue / orange depending of the side.
Then, we wait for a cross of tenkan and kijun. This cross has to be confirmed by a movement of kijun. A flat kijun tell us this is a fake cross.
When the movement of kijun happened in the same side of the cross it is possible to enter a trade if you are aggresive.
Otherwise, you can wait for the third signal to take place: break of SSB, candle become green / red, depending on the side.
You can then enter a trade.
Then hold the position and wait to exit for break of tenkan or kijun, depending on your horizon (short / mid term).
If you have other questions or some features that are missing, pm me. Thanks.

Parabolic SAR of KAMA [Loxx]Parabolic SAR of KAMA attempts to reduce noise and volatility from regular Parabolic SAR in order to derive more accurate trends. In addition, and to further reduce noise and enhance trend identification, PSAR of KAMA includes two calculations of efficiency ratio: 1) price change adjusted for the daily volatility; or, 2) Jurik Fractal Dimension Adaptive (explained below)
What is PSAR?
The parabolic SAR indicator, developed by J. Wells Wilder, is used by traders to determine trend direction and potential reversals in price. The indicator uses a trailing stop and reverse method called "SAR," or stop and reverse, to identify suitable exit and entry points. Traders also refer to the indicator as to the parabolic stop and reverse, parabolic SAR, or PSAR.
What is KAMA?
Developed by Perry Kaufman, Kaufman's Adaptive Moving Average (KAMA) is a moving average designed to account for market noise or volatility. KAMA will closely follow prices when the price swings are relatively small and the noise is low. KAMA will adjust when the price swings widen and follow prices from a greater distance. This trend-following indicator can be used to identify the overall trend, time turning points and filter price movements.
What is the efficiency ratio?
In statistical terms, the Efficiency Ratio tells us the fractal efficiency of price changes. ER fluctuates between 1 and 0, but these extremes are the exception, not the norm. ER would be 1 if prices moved up 10 consecutive periods or down 10 consecutive periods. ER would be zero if price is unchanged over the 10 periods.
What is Jurik Fractal Dimension?
There is a weak and a strong way to measure the random quality of a time series.
The weak way is to use the random walk index (RWI). You can download it from the Omega web site. It makes the assumption that the market is moving randomly with an average distance D per move and proposes an amount the market should have changed over N bars of time. If the market has traveled less, then the action is considered random, otherwise it's considered trending.
The problem with this method is that taking the average distance is valid for a Normal (Gaussian) distribution of price activity. However, price action is rarely Normal, with large price jumps occuring much more frequently than a Normal distribution would expect. Consequently, big jumps throw the RWI way off, producing invalid results.
The strong way is to not make any assumption regarding the distribution of price changes and, instead, measure the fractal dimension of the time series. Fractal Dimension requires a lot of data to be accurate. If you are trading 30 minute bars, use a multi-chart where this indicator is running on 5 minute bars and you are trading on 30 minute bars.
Conclusion from the combined efforts explained above:
-PSAR is a tool that identifies trends
-To reduce noise and identify trends during periods of low volatility, we calculate a PSAR on KAMA
-To enhance noise and reduction and trend identification, we attempt to derive an efficiency ratio that is less reliant on a Normal (Gaussian) distribution of price
Included:
-Customization of all variables
-Select from two different ER calculation styles
-Multiple timeframe enabled

BB + RSI double strategy developeI'm Korean, and it may not be enough to explain this script in English. I feel sorry for the users of TradingView for this lack of English skills. If you are Korean, please return it to the translator using Papago. It will be a useful manual for you.
This script referenced Chartart's Double Strategy. But there are some changes in his script.
0. Basically, when you break through the top or bottom of the 100th period balliser band and come back into the band, you track the overbuying and overselling of the RSI to determine your position entry. The order is triggered only when both conditions are satisfied at the same time. However, only one condition applies to clearing the position. This is because it is most effective in reducing risk and increasing assets in terms of profit and loss.
1. This script is optimized for 15 minutes of bitcoin futures chart and API via webbook alert. By default, 10x leverage usage and 10 pyramids are applied.
2. Setting a chart period other than 15 minutes will not guarantee sufficient effectiveness. It can also be applied to Ethereum , but it is not recommended to apply to other symbols.
3. I added Enable Date Filter because Chartart's script could not apply the strategy to the user's desired period. This feature allows you to set a period of time when you do not want to use the strategy. You can also uncheck it if you don't want to fully use this feature. Please remember that it is an exclusion period, not a usage period. With this feature, we can see the effectiveness of the strategy from a point in time, not from the entire period. You can also clearly differentiate the effectiveness of the strategy from the point you use it.
4. You can also stop using strategies at certain times of the day when you don't want to apply them. This works similarly to the Enalbe Date Filter described above. This allows you to sleep comfortably even if you don't fully trust this strategy.
5. The period, overbuying, and overselling figures of RSI can be set individually. For example, when you take a long position, you can set the RSI to a period of 7, and at the same time, the RSI entering the short position can be set to a period of 14. You can also set the base figures for overbuying and overselling to levels that you think are reasonable. This figure works in conjunction with the Bollinger Band and affects position entry when it is crossed or returned.
6. Based on API futures trading, basic Sleepy and commission are applied. This is geared towards market price transactions. This makes your revenue look more reasonable.
Thank you very much, Chartart. You are a genius.
-
저는 한국인이고, 영어로 이 스크립트를 설명하는 것이 어렵기 때문에 설명이 부족할 수 있습니다. 이런 영어 능력 부족에 대해서 TradingView 사용자들에게 미안하게 생각합니다. 만약 당신이 한국인이라면 파파고를 사용하여 번역기에 돌려주십시오. 당신에게 유익한 설명서가 될 것입니다.
이 스크립트는 Chart art의 Double Strategy를 참조했습니다. 그러나 그의 스크립트에서 달라진 점이 몇 가지 있습니다.
0. 기본적으로 100기간의 볼린져밴드의 상단 또는 하단을 돌파한 뒤 다시 밴드 안으로 들어올 때 RSI의 과매수, 과매도를 추적하여 포지션 진입을 결정합니다. 두 가지 조건이 동시에 만족되어야만 주문이 트리거 됩니다. 그러나 포지션을 청산하는 것에는 볼린져밴드 하나의 조건만 적용합니다. 여러가지 테스트를 거친 결과 이것이 손익 면에서 가장 효과적으로 리스크를 줄이고 자산을 늘리는 것에 효율적이기 때문입니다.
1. 이 스크립트는 15분의 비트코인 선물 차트와 webhook alert을 통한 API에 최적화되어 있습니다. 기본적으로 10배의 레버리지 사용과 10개의 피라미딩이 적용되어 있습니다.
2. 15분 외에 다른 차트 기간을 설정한다면 충분한 효과를 보장할 수 없습니다. 또한 이더리움에도 적용할 수 있지만, 그 외에 다른 심볼에는 적용하지 않는 것을 권장합니다.
3. Chart art의 스크립트는 전략을 사용자가 원하는 기간에 적용할 수 없었기 때문에, 저는 Enable Date Filter를 추가하였습니다. 이 기능을 통해 전략 사용을 원하지 않는 기간을 설정할 수 있습니다. 또한 이 기능을 완전히 사용하고싶지 않다면 체크를 해제할 수 있습니다. 사용 기간이 아닌 제외 기간인 점을 상기하시길 바랍니다. 이 기능을 통해 우리는 전체 기간이 아닌 가까운 특정 시점부터의 전략 적용 효과를 확인할 수 있습니다. 또한 사용자가 전략을 사용한 시점부터의 효과를 명백히 구분할 수 있습니다.
4. 또한 사용자가 적용을 원하지 않는 하루 중의 특정 시간대에 전략 사용을 멈출 수도 있습니다. 이는 위에 설명한 Enalbe Date Filter와 유사하게 작동합니다. 이를 통해 당신이 온전히 이 전략을 신뢰하지 못하여도 당신은 마음 편하게 잠에 들 수 있습니다.
5. RSI의 기간 및 과매수, 과매도 수치를 개별적으로 설정할 수 있습니다. 예를 들어 당신이 롱 포지션을 취할 때에는 RSI를 7의 기간으로 설정할 수 있고, 동시에 숏 포지션을 진입하는 RSI는 14의 기간으로 설정될 수 있습니다. 또한 과매수 및 과매도의 기준 수치를 당신이 합리적이라고 생각하는 수준으로 설정할 수 있습니다. 이 수치는 볼린져밴드와 함께 작동하여 그것을 넘어서거나 다시 되돌아올 때 포지션 진입에 영향을 미칩니다.
6. API 선물거래를 기준으로 하여 기본적인 슬리피지와 커미션이 적용되어있습니다. 이는 시장가 거래에 맞춰져 있습니다. 이는 당신의 수익을 좀 더 합리적인 수치로 보일 수 있게 합니다.
Chartart에게 특별히 감사합니다. 당신은 천재입니다.

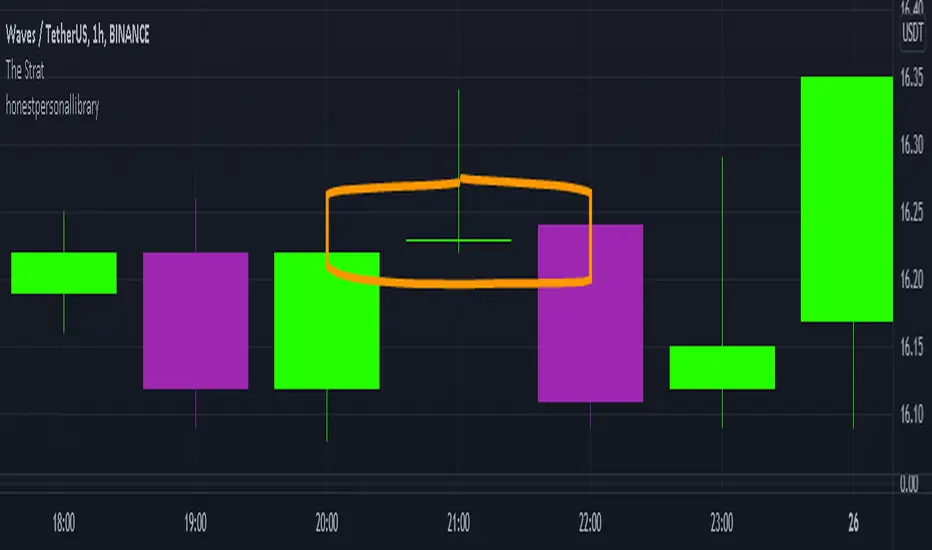
honest personal libraryLibrary "honestpersonallibrary"
thestratnumber() this will return the number 1,2 or 3 using the logic from Rob Smiths #thestrat which uses these type of bars for setups
getBodySize() Gets the current candle's body size (in POINTS, divide by 10 to get pips)
Returns: The current candle's body size in POINTS
getTopWickSize() Gets the current candle's top wick size (in POINTS, divide by 10 to get pips)
Returns: The current candle's top wick size in POINTS
getBottomWickSize() Gets the current candle's bottom wick size (in POINTS, divide by 10 to get pips)
Returns: The current candle's bottom wick size in POINTS
getBodyPercent() Gets the current candle's body size as a percentage of its entire size including its wicks
Returns: The current candle's body size percentage
strictBearPinBar(float, float) This it to find pinbars with a very long wick compared to the body that are bearish
Parameters:
float : minTopMulitplier (default=4) The minimum number of times that the top wick has to be bigger than the candle body size
float : maxBottomMultiplier (default=2) The maximum number of times that the bottom wick can be bigger than the candle body size
Returns: a bool function true if current candle is withing the parameters
strictBullPinBar(float, float) This it to find pinbars with a very long wick compared to the body that are bearish
Parameters:
float : minTopMulitplier (default=4) The minimum number of times that the top wick has to be bigger than the candle body size
float : maxBottomMultiplier (default=2) The maximum number of times that the bottom wick can be bigger than the candle body size
Returns: a bool function true if current candle is withing the parameters
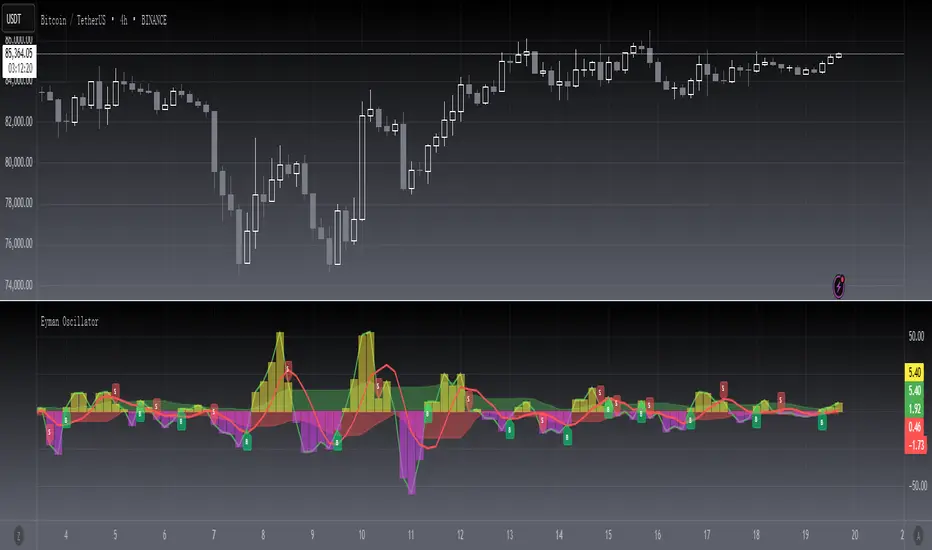
[blackcat] L2 Eyman OscillatorLevel 2
Background
Eyman Oscillator
Function
The Eyman oscillator is also an analytical indicator derived from the moving average principle, which reflects the deviation between the current price and the average price over a period of time. According to the principle of moving average, the price trend can be inferred from the value of OSC. If it is far from the average, it is likely to return to the average. OSC calculation formula: Take 10-day OSC as an example: OSC = closing price of the day - 10-day average price Parameter setting: The period of the OSC indicator is generally 10 days; the average number of days of the OSC indicator can be set, and the average line of the OSC indicator can also be displayed. OSC judgment method: Take the ten-day OSC as an example: 1. The oscillator takes 0 as the center line, the OSC is above the zero line, and the market is in a strong position; if the OSC is below the zero line, the market is in a weak position. 2. OSC crosses the zero line. When the line is up, the market is strengthening, which can be regarded as a buy signal. On the contrary, if OSC falls below the zero line and continues to go down, the market is weak, and you should pay attention to selling. The degree to which the OSC value is far away should be judged based on experience.
Remarks
This is a Level 2 free and open source indicator.
Feedbacks are appreciated.
MTF Stochastic ScannerThis Stochastic scanner can be use to identify overbought and oversold of 10 symbols over multiple timeframes
it will give you a quick overview which pair is more overbough or more oversold and also signals tops and bottoms in the AVG row
light red/green cell = weak bearish (Stoch = 30-20) / bullish (Stoch = 70-80)
medium red/green cell = bearish (Stoch = 20-10) / bullish (Stoch = 80-90)
dark red/green cell = strong bearish (Stoch <= 10) / bullish (Stoch >= 90)
gray cell = neutral (Stoch = 30-70)
Usage
If AVG (average of all 4 timeframes) falls below 20, the cell will get green, indicating a good time to enter long (buy)
If AVG (average of all 4 timeframes) rises above 80, the cell will get red, indicating a good time to enter short (sell)
Use the "MTF Stochastic Scanner" in combination with the " MTF RSI Scanner "
to find tops (RSI MTF avg >=70 AND Stochastic MTF avg >= 80)
or bottoms (RSI MTF avg <= 30 AND Stochastic MTF avg <= 20)
Here is how the two MTF scanners looked on Nov 08 2021 (ATH) »
and here how the MTF scanners looked on June 21 2022
use TradingViews Replay function to check how it would have worked in the past and when not.
As always… there NOT a single indicator that can show to the top & bottom 100% every single time. So use with caution, with other indicators and/or deeper understanding of technicals analysis ☝️☝️☝️
Settings
You can change the timeframes, symbols, Stochastic settings, overbought/oversold levels and colors to your liking
Drag the table onto the price chart, if you want to use it as an overlay.
NOTE:
Because of the 4x10 security requests, it can take up to 1 minute for changed settings to take effect! Please be patient 🙃
If you have any idea on how to optimise the code, please feel free to share 🙏
*** Inspired by "Binance CHOP Dashboard" from @Cazimiro and "RSI MTF Table" from @mobester16 ***

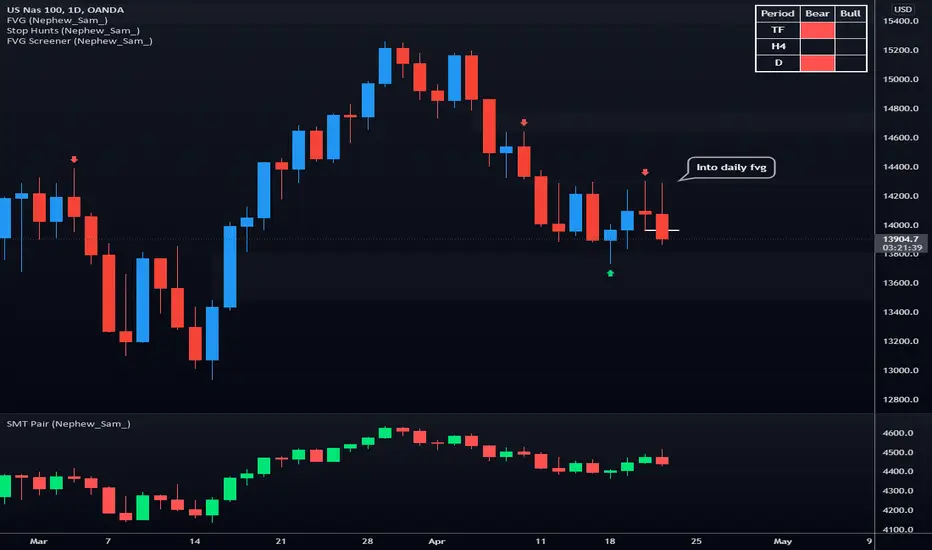
SMT Pair (Nephew_Sam_)// This source code is subject to the terms of the Mozilla Public License 2.0 at mozilla.org
// © Nephew_Sam_
--------------------------------------------------------------
This code for version is entirely different from the previous two SMT divergence indicators that I had published in terms of effeciency.
There is an option to have upto 10 custom pairs and 1 default pair (if outside the 10) for your SMT/correlated pair.
The divergence lines are not perfect and is still under development.
--------------------------------------------------------------
This indicator shows a secondary SMT/correlated pair at them bottom pane as a line or bar chart and draws lines if there are any divergences between the primary and secondary pair.
ie .
GBPUSD - EURUSD
EURUSD - DXY (inversed)
XAUUSD - XAGUSD
Options:
1. Show the secondary pair in lines or candlesticks
2. Divergences between pivot points (I'm yet to implement last pivot to live price)
3. Set 10 primary-smt pairs + a default pair for every other.
4. For every pair there is an option to inverse the price of the smt pair
(Hover over the tips in the indicator settings to learn more)
TASC 2022.05 Relative Strength Exponential Moving Average█ OVERVIEW
TASC's May 2022 edition Traders' Tips includes the "Relative Strength Moving Averages" article authored by Vitali Apirine. This is the code implementing the Relative Strength Exponential Moving Average (RS EMA) indicator introduced in this publication.
█ CONCEPTS
RS EMA is an adaptive trend-following indicator with reduced lag characteristics. By design, this was made possible by harnessing the relative strength of price. It operates in a similar fashion to a traditional EMA, but it has an improved response to price fluctuations. In a trading strategy, RS EMA can be used in conjunction with an EMA of the same length to identify the overall trend (see the preview chart). Alternatively, RS EMAs with different lengths can define turning points and filter price movements.
RS EMA is an adaptive trend-following indicator with reduced lag characteristics. By design, this was made possible by harnessing the relative strength of price. It operates in a similar fashion to a traditional EMA, but it has an improved response to price fluctuations.
█ CALCULATIONS
The following steps are used in the calculation process:
• Calculate the relative strength (RS) of a given length.
• Multiply RS by a chosen coefficient (multiplier) to adapt the EMA filtering the original time series. Calculate the EMA of the resulting time series.
The author recommends RS EMA(10,10,10) as typical settings, where the first parameter is the EMA length, the second parameter is the RS length, and the third parameter is the RS multiplier. Other values may be substituted depending on your trading style and goals.
Binance CHOP Dashboard by KziHere is a Dashboard to find the opportunuty of bigs moves with 20 pairs.
The Dashboard is too big for the phone view. I thinks we can use it only on computer view.
How it's work ?
I look for the CHOP on Weekly and Daily time frame
The CHOP give the "tension" of the pair.
So i look for the biggest "tension" to take the "big mooves"
I look for the align tension between weekly and daily
The CHOP can be 0 to 100 , the result is:
(Weeky CHOP x Daily CHOP) = 0 to 10 000
To make the result easy to read, i divide so that the "note" is between 0 and 10.
If you have more than 3 /10 = RED => HOT Opporunity for big mooves
If you have less than 1/10 = BLUE => COLD opporunity
Thanks for your comment,
Kzi
The code is well.
But i think there is an opportunity to do it better with some for loop.
Is some of you do it, please let's me know.

VIX Cheat SheetHello!
This indicator - "VIX Cheat Sheet" - performs several calculations for $VIX against the asset on your chart. However, using $VIX as a risk proxy or volatility metric often fails beyond large-cap U.S equities. To remedy this, the VixFix indicator is included in the script; you can select whether the script performs calculations for an asset against $VIX or against VixFix (i.e. Forex, Crypto)
Measured are: $VIX correlation to an asset's price fluctuations, the average close-to-close gain/loss subsequent a $VIX/VixFix close above the upper Bollinger Band, the average 5-session gain/loss following the same occurrence in addition to the average 10-session gain/loss, all close-to-close, 5 session, and 10-session gains/losses are stored as tooltips for labels on the chart. The current close-to-close percentage gain/loss for $VIX and VixFix are displayed on the chart.
Displayed in the example image is a box incorporating $VIX price data alongside an upper Bollinger Band and lower Bollinger Band. The data isn't cast to its own price scale but is helpful for quick interpretation of $VIX fluctuations. You can select to plot VixFix data in the box in the user inputs table.
Displayed in the second example image is a semi-transparent blue box encompassing all price moves that occurred when $VIX measured above $40 for at least ten consecutive sessions. The largest percentage close-to-close loss is displayed below the box.
Also illustrated is a red label that appears when $VIX or VixFix closes above the upper Bollinger Band. The indicator will calculate and display the performance of the asset for the subsequent 10 sessions, to which the red label will disappear and all data stored as a tooltip in the blue labels stating "VIX Closed Above Upper Band" or "VixFix Closed Above Upper Band".
To reduce chart clutter, a label and line combination marking all $VIX closes above the upper Bollinger Band was not included. Instead, bar color changes were added. When "$VIX" is selected in the user inputs table the indicator will mark all sessions in which $VIX closed above the upper band as blue, in addition to plotting $VIX price data in the dynamic black box. When "VixFix" is selected, the indicator will mark all sessions where VixFix closed above the upper band as purple; the VixFix indicator will be plotted in the black box.
Be sure to hover over labels to access tooltip information; try the indicator with bar replay!

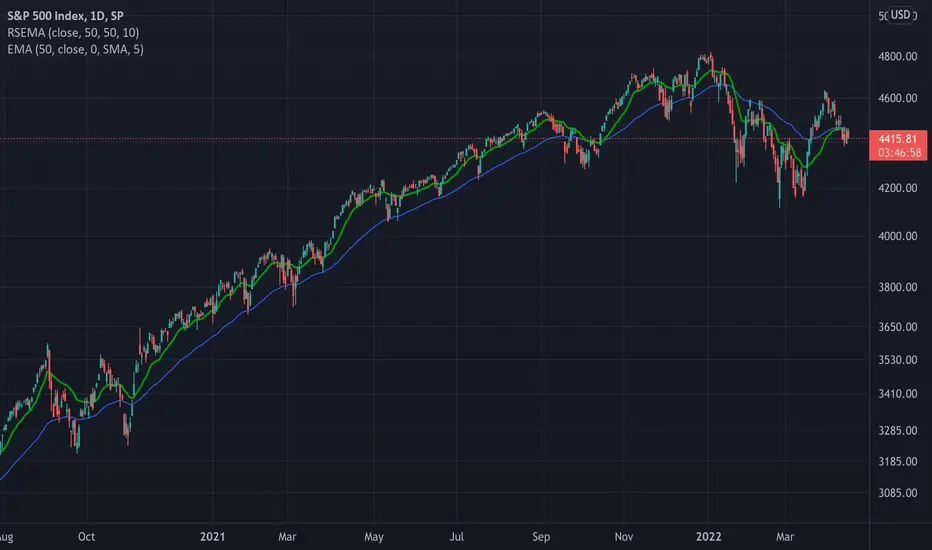
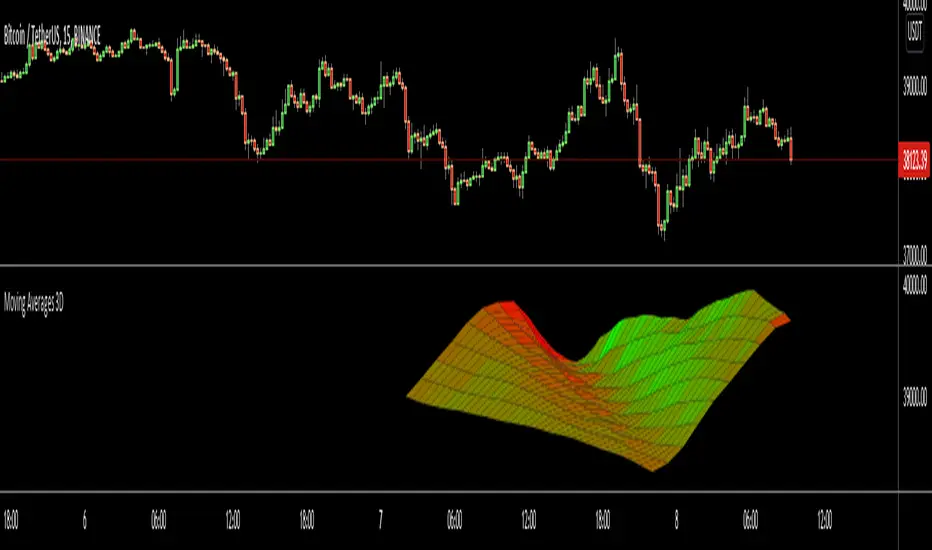
Moving Averages 3DHello All,
This is an experimental work to show 10 moving averages in 3D by using linefill.new() feature of the Pine language.
You can set moving average type as Simple (SMA) or Exponential (EMA)
You can set "Starting Length" and set the "Step" to calculate other lengths. For example; if "Starting Length" is 10 and "step" is 5 then the lengths are 10, 15, 20, 25...
You can set the colors as Red, Green, Blue for each direction. And you can change the width. you can see the examples below
In following example Green and Blue used:
In following example Blue and Red is used and Width is set as 5:
Enjoy!
Multi-Timeframe (MTF) Dashboard by RiTzMulti-Timeframe Dashboard
Shows values of different Indiactors on Multiple-Timeframes for the selected script/symbol
VWAP : if LTP is trading above VWAP then Bullish else if LTP is trading below VWAP then Bearish.
ST(21,1) : if LTP is trading above Supertrend (21,1) then Bullish , else if LTP is trading below Supertrend (21,1) then Bearish.
ST(14,2) : if LTP is trading above Supertrend (14,2) then Bullish , else if LTP is trading below Supertrend (14,2) then Bearish.
ST(10,3) : if LTP is trading above Supertrend (10,3) then Bullish , else if LTP is trading below Supertrend (10,3) then Bearish.
RSI(14) : Shows value of RSI (14) for the current timeframe.
ADX : if ADX is > 75 and DI+ > DI- then "Bullish ++".
if ADX is < 75 but >50 and DI+ > DI- then "Bullish +".
if ADX is < 50 but > 25 and DI+ > DI- then "Bullish".
if ADX is above 75 and DI- > DI+ then "Bearish ++".
if ADX is < 75 but > 50 and DI- > DI+ then "Bearish+".
if ADX is < 50 but > 25 and DI- > DI+ then "Bearish".
if ADX is < 25 then "Neutral".
MACD : if MACD line is above Signal Line then "Bullish", else if MACD line is below Signal Line then "Bearish".
PH-PL : "< PH > PL" means LTP is trading between Previous Timeframes High(PH) & Previous Timeframes Low(PL) which indicates Rangebound-ness.
"> PH" means LTP is trading above Previous Timeframes High(PH) which indicates Bullish-ness.
"< PL" means LTP is trading below Previous Timeframes Low(PL) which indicates Bearish-ness.
Alligator : If Lips > Teeth > Jaw then Bullish.
If Lips < Teeth < Jaw then Bearish.
If Lips > Teeth and Teeth < Jaw then Neutral/Sleeping.
If Lips < Teeth and Teeth > Jaw then Neutral/Sleeping.
Settings :
Style settings :-
Dashboard Location: Location of the dashboard on the chart
Dashboard Size: Size of the dashboard on the chart
Bullish Cell Color: Select the color of cell whose value is showing Bullish-ness.
Bearish Cell Color: Select the color of cell whose value is showing Bearish-ness.
Neutral Cell Color: Select the color of cell whose value is showing Rangebound-ness.
Cell Transparency: Select Transparency of cell.
Column Settings :-
You can select which Indicators values should be displayed/hidden.
Timeframe Settings :-
You can select which timeframes values should be displayed/hidden.
Note :- I'm not a pro Developer/Coder , so if there are any mistakes or any suggestions for improvements in the code then do let me know!
Note :- Use in Live market , might show wrong values for timeframes other than current timeframe in closed market!!

Nifty / Banknifty Dashboard by RiTzNifty / Banknifty Dashboard :
Shows Values of different Indicators on current Timeframe for the selected Index & it's main constituents according to weightage in index.
customized for Nifty & Banknifty (You can customize it according to your needs for the markets/indexes you trade in)
Interpretation :-
VWAP : if LTP is trading above VWAP then Bullish else if LTP is trading below VWAP then Bearish.
ST(21,1) : if LTP is trading above Supertrend (21,1) then Bullish , else if LTP is trading below Supertrend (21,1) then Bearish.
ST(14,2) : if LTP is trading above Supertrend (14,2) then Bullish , else if LTP is trading below Supertrend (14,2) then Bearish.
ST(10,3) : if LTP is trading above Supertrend (10,3) then Bullish , else if LTP is trading below Supertrend (10,3) then Bearish.
RSI(14) : Shows value of RSI (14) for the current timeframe.
ADX : if ADX is > 75 and DI+ > DI- then "Bullish ++".
if ADX is < 75 but >50 and DI+ > DI- then "Bullish +".
if ADX is < 50 but > 25 and DI+ > DI- then "Bullish".
if ADX is above 75 and DI- > DI+ then "Bearish ++".
if ADX is < 75 but > 50 and DI- > DI+ then "Bearish+".
if ADX is < 50 but > 25 and DI- > DI+ then "Bearish".
if ADX is < 25 then "Neutral".
MACD : if MACD line is above Signal Line then "Bullish", else if MACD line is below Signal Line then "Bearish".
PDH-PDL : "< PDH > PDL" means LTP is trading between Previous Days High(PDH) & Previous Days Low(PDL) which indicates Rangebound-ness.
"> PDH" means LTP is trading above Previous Days High(PDH) which indicates Bullish-ness.
"< PDL" means LTP is trading below Previous Days Low(PDL) which indicates Bearish-ness.
Alligator : If Lips > Teeth > Jaw then Bullish.
If Lips < Teeth < Jaw then Bearish.
If Lips > Teeth and Teeth < Jaw then Neutral/Sleeping.
If Lips < Teeth and Teeth > Jaw then Neutral/Sleeping.
Settings :
Style settings :-
Dashboard Location: Location of the dashboard on the chart
Dashboard Size: Size of the dashboard on the chart
Bullish Cell Color: Select the color of cell whose value is showing Bullish-ness.
Bearish Cell Color: Select the color of cell whose value is showing Bearish-ness.
Neutral Cell Color: Select the color of cell whose value is showing Rangebound-ness.
Cell Transparency: Select Transparency of cell.
Columns Settings :-
You can select which Indicators values should be displayed/hidden.
Rows Settings :-
You can select which Stocks/Symbols values should be displayed/hidden.
Symbol Settings :-
Here you can select the Index & Stocks/Symbols
Dashboard for Index : select Nifty/Banknifty
if you select Nifty then Nifty spot, Nifty current Futures and the stocks with most weightage in Nifty index will be displayed on the Dashboard/Table.
if you select Banknifty then Banknifty spot, Banknifty current Futures and the stocks with most weightage in Banknifty index will be displayed on the Dashboard/Table.
You can Customise it according to your needs, you can choose any Symbols you want to use.
Note :- This is inspired from "RankDelta" by AsitPati and "Nifty and Bank Nifty Dashboard v2" by cvsk123 (Both these scripts are closed source!)
I'm not a pro Developer/Coder , so if there are any mistakes or any suggestions for improvements in the code then do let me know!

Multi Day vWAP (Customizable) with AverageIntroducing the Multi-Day vWAP indicator that is fully customizable with average indicator option.
High level overview (default settings):
Default is 10 plots with each setting 1 day apart (1-10 day look back)
Labels for each plot are turned on by default (labels will default to your value, more below)
Use Style tab in options to change colors, plot style, and turn on/off individual plots
Average is turned off by default (style panel will show it's on-- go to Inputs panel and select "Show vWAP Average" to turn on)
Best use case is go to Visibility Panel in options and turn off for Days, Weeks, and Months
To turn off all labels at once go to Style tab and unselect "Labels" checkbox
If you want plots to be as small as possible in Inputs panel set the Plot Width to 0 (zero)
Detail Overview
This indicator will plot your custom daily vWAP values.
You can change the lookback period. If you change the lookback period the label will match your custom value.
For instance, if you change vWAP 1 value to "5", the label for this plot will be 5.
Average Notes:
The average will average all the vWAP values by the divisor. The default is to average all values by 10.
The average will always start to plot from the shortest lookback period. It is not possible to have the average plot before that point.
Trading Tips (default settings)
The simple way to use the vWAP is to treat them as magnets.
For intance,
Generally if price is trading below all the vWAP plots the chart is in a momentum short enviroment. All vWAP areas can be used for upside resistance/reaction areas.
If price is trading above the chart is in a momentum long enviroment and pullbacks can to vWAP levels can be looked as areas of support/reaction.
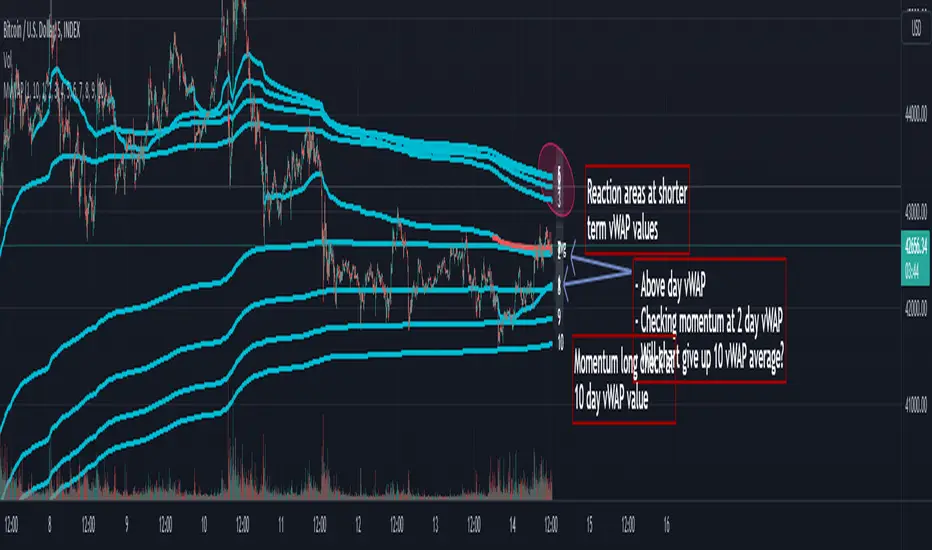
For instance:
Price is above the current day vWAP and looking to test the previous day vWAP value.
As it approaches the 2 value you are expecting this area to be a reaction area (good trade entry area) for a continuation short trade. Possibly to check back into the current day vWAP value.
I should share that this is a simple way to trade with the vWAP (true success with vWAP is understanding that price trades in vWAP channels).
Stacking and Strong Momentum
The other pattern you should look for is stacking.
For instance on this CL chart:
This chart is strong momentum long.
All 10 day vWAP plots are stacked on top of each other.
Previous action tested below all vWAPs. Price traded thru and came back and retested. Finally closing above all and above the vWAP avearge (red).
When the day vWAP was broke the next target you look for is the 2 vWAP. This reaction area held up and momentum long continued and continuing to trade above current day vWAP.
7 Day Rolling Example (Larger Timeframe)
Another great way to use this indicator is to customize the values for rolling 7 days (5 days for cash markets).
To do this set values to: 7, 14, 21, 28, 35, 42, 49, 56, 63, 70
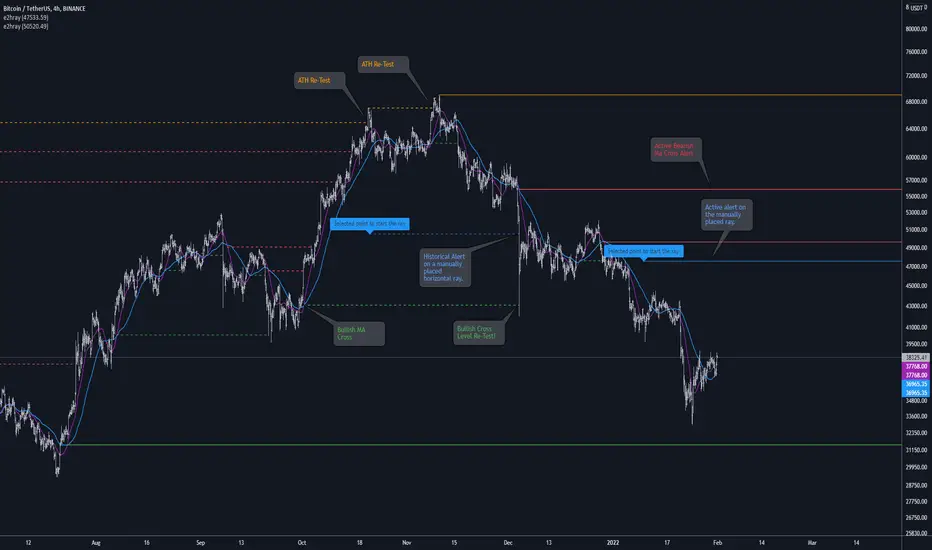
For instance, this BTC chart:
This chart provides a good example of what you'll find when a chart is at a pivot point.
Price is checking in at the average to remain momentum long.
Upside longer term vWAP plots have been tested and had expected reaction.
Price is trading above the shorter term values.
Simple TA here will note if chart continues to trade above and takes out upper vWAPs long momentum is gaining ground.
On the downside if price trades thru the lower vWAP plots you would expect further downside. In this scenario you would be mindful to expect upside tests before (which could be good entry/reaction areas).
NQ example with 7 day values:
Overall chart is momentum short.
7 is above 14, 21
Maybe early sign of bottom.
If price takes out these values and holds above the buyers have quite a few challenges above.
[e2] Drawing Library :: Horizontal Ray█ OVERVIEW
Library "e2hray"
A drawing library that contains the hray() function, which draws a horizontal ray/s with an initial point determined by a specified condition. It plots a ray until it reached the price. The function let you control the visibility of historical levels and setup the alerts.
█ HORIZONTAL RAY FUNCTION
hray(condition, level, color, extend, hist_lines, alert_message, alert_delay, style, hist_style, width, hist_width)
Parameters:
condition : Boolean condition that defines the initial point of a ray
level : Ray price level.
color : Ray color.
extend : (optional) Default value true, current ray levels extend to the right, if false - up to the current bar.
hist_lines : (optional) Default value true, shows historical ray levels that were revisited, default is dashed lines. To avoid alert problems set to 'false' before creating alerts.
alert_message : (optional) Default value string(na), if declared, enables alerts that fire when price revisits a line, using the text specified
alert_delay : (optional) Default value int(0), number of bars to validate the level. Alerts won't trigger if the ray is broken during the 'delay'.
style : (optional) Default value 'line.style_solid'. Ray line style.
hist_style : (optional) Default value 'line.style_dashed'. Historical ray line style.
width : (optional) Default value int(1), ray width in pixels.
hist_width : (optional) Default value int(1), historical ray width in pixels.
Returns: void
█ EXAMPLES
• Example 1. Single horizontal ray from the dynamic input.
//@version=5
indicator("hray() example :: Dynamic input ray", overlay = true)
import e2e4mfck/e2hray/1 as e2draw
inputTime = input.time(timestamp("20 Jul 2021 00:00 +0300"), "Date", confirm = true)
inputPrice = input.price(54, 'Price Level', confirm = true)
e2draw.hray(time == inputTime, inputPrice, color.blue, alert_message = 'Ray level re-test!')
var label mark = label.new(inputTime, inputPrice, 'Selected point to start the ray', xloc.bar_time)
• Example 2. Multiple horizontal rays on the moving averages cross.
//@version=5
indicator("hray() example :: MA Cross", overlay = true)
import e2e4mfck/e2hray/1 as e2draw
float sma1 = ta.sma(close, 20)
float sma2 = ta.sma(close, 50)
bullishCross = ta.crossover( sma1, sma2)
bearishCross = ta.crossunder(sma1, sma2)
plot(sma1, 'sma1', color.purple)
plot(sma2, 'sma2', color.blue)
// 1a. We can use 2 function calls to distinguish long and short sides.
e2draw.hray(bullishCross, sma1, color.green, alert_message = 'Bullish Cross Level Broken!', alert_delay = 10)
e2draw.hray(bearishCross, sma2, color.red, alert_message = 'Bearish Cross Level Broken!', alert_delay = 10)
// 1b. Or a single call for both.
// e2draw.hray(bullishCross or bearishCross, sma1, bullishCross ? color.green : color.red)
• Example 3. Horizontal ray at the all time highs with an alert.
//@version=5
indicator("hray() example :: ATH", overlay = true)
import e2e4mfck/e2hray/1 as e2draw
var float ath = 0, ath := math.max(high, ath)
bool newAth = ta.change(ath)
e2draw.hray(nz(newAth ), high , color.orange, alert_message = 'All Time Highs Tested!', alert_delay = 10)
LeoLibraryLibrary "LeoLibrary"
A collection of custom tools & utility functions commonly used with my scripts
getDecimals() Calculates how many decimals are on the quote price of the current market
Returns: The current decimal places on the market quote price
truncate(float, float) Truncates (cuts) excess decimal places
Parameters:
float : _number The number to truncate
float : _decimalPlaces (default=2) The number of decimal places to truncate to
Returns: The given _number truncated to the given _decimalPlaces
toWhole(float) Converts pips into whole numbers
Parameters:
float : _number The pip number to convert into a whole number
Returns: The converted number
toPips(float) Converts whole numbers back into pips
Parameters:
float : _number The whole number to convert into pips
Returns: The converted number
av_getPositionSize(float, float, float, float) Calculates OANDA forex position size for AutoView based on the given parameters
Parameters:
float : _balance The account balance to use
float : _risk The risk percentage amount (as a whole number - eg. 1 = 1% risk)
float : _stopPoints The stop loss distance in POINTS (not pips)
float : _conversionRate The conversion rate of our account balance currency
Returns: The calculated position size (in units - only compatible with OANDA)
getMA(int, string) Gets a Moving Average based on type
Parameters:
int : _length The MA period
string : _maType The type of MA
Returns: A moving average with the given parameters
getEAP(float) Performs EAP stop loss size calculation (eg. ATR >= 20.0 and ATR < 30, returns 20)
Parameters:
float : _atr The given ATR to base the EAP SL calculation on
Returns: The EAP SL converted ATR size
barsAboveMA(int, float) Counts how many candles are above the MA
Parameters:
int : _lookback The lookback period to look back over
float : _ma The moving average to check
Returns: The bar count of how many recent bars are above the MA
barsBelowMA(int, float) Counts how many candles are below the MA
Parameters:
int : _lookback The lookback period to look back over
float : _ma The moving average to reference
Returns: The bar count of how many recent bars are below the EMA
barsCrossedMA(int, float) Counts how many times the EMA was crossed recently
Parameters:
int : _lookback The lookback period to look back over
float : _ma The moving average to reference
Returns: The bar count of how many times price recently crossed the EMA
getPullbackBarCount(int, int) Counts how many green & red bars have printed recently (ie. pullback count)
Parameters:
int : _lookback The lookback period to look back over
int : _direction The color of the bar to count (1 = Green, -1 = Red)
Returns: The bar count of how many candles have retraced over the given lookback & direction
getBodySize() Gets the current candle's body size (in POINTS, divide by 10 to get pips)
Returns: The current candle's body size in POINTS
getTopWickSize() Gets the current candle's top wick size (in POINTS, divide by 10 to get pips)
Returns: The current candle's top wick size in POINTS
getBottomWickSize() Gets the current candle's bottom wick size (in POINTS, divide by 10 to get pips)
Returns: The current candle's bottom wick size in POINTS
getBodyPercent() Gets the current candle's body size as a percentage of its entire size including its wicks
Returns: The current candle's body size percentage
isHammer(float, bool) Checks if the current bar is a hammer candle based on the given parameters
Parameters:
float : _fib (default=0.382) The fib to base candle body on
bool : _colorMatch (default=false) Does the candle need to be green? (true/false)
Returns: A boolean - true if the current bar matches the requirements of a hammer candle
isStar(float, bool) Checks if the current bar is a shooting star candle based on the given parameters
Parameters:
float : _fib (default=0.382) The fib to base candle body on
bool : _colorMatch (default=false) Does the candle need to be red? (true/false)
Returns: A boolean - true if the current bar matches the requirements of a shooting star candle
isDoji(float, bool) Checks if the current bar is a doji candle based on the given parameters
Parameters:
float : _wickSize (default=2) The maximum top wick size compared to the bottom (and vice versa)
bool : _bodySize (default=0.05) The maximum body size as a percentage compared to the entire candle size
Returns: A boolean - true if the current bar matches the requirements of a doji candle
isBullishEC(float, float, bool) Checks if the current bar is a bullish engulfing candle
Parameters:
float : _allowance (default=0) How many POINTS to allow the open to be off by (useful for markets with micro gaps)
float : _rejectionWickSize (default=disabled) The maximum rejection wick size compared to the body as a percentage
bool : _engulfWick (default=false) Does the engulfing candle require the wick to be engulfed as well?
Returns: A boolean - true if the current bar matches the requirements of a bullish engulfing candle
isBearishEC(float, float, bool) Checks if the current bar is a bearish engulfing candle
Parameters:
float : _allowance (default=0) How many POINTS to allow the open to be off by (useful for markets with micro gaps)
float : _rejectionWickSize (default=disabled) The maximum rejection wick size compared to the body as a percentage
bool : _engulfWick (default=false) Does the engulfing candle require the wick to be engulfed as well?
Returns: A boolean - true if the current bar matches the requirements of a bearish engulfing candle
timeFilter(string, bool) Determines if the current price bar falls inside the specified session
Parameters:
string : _sess The session to check
bool : _useFilter (default=false) Whether or not to actually use this filter
Returns: A boolean - true if the current bar falls within the given time session
dateFilter(int, int) Determines if this bar's time falls within date filter range
Parameters:
int : _startTime The UNIX date timestamp to begin searching from
int : _endTime the UNIX date timestamp to stop searching from
Returns: A boolean - true if the current bar falls within the given dates
dayFilter(bool, bool, bool, bool, bool, bool, bool) Checks if the current bar's day is in the list of given days to analyze
Parameters:
bool : _monday Should the script analyze this day? (true/false)
bool : _tuesday Should the script analyze this day? (true/false)
bool : _wednesday Should the script analyze this day? (true/false)
bool : _thursday Should the script analyze this day? (true/false)
bool : _friday Should the script analyze this day? (true/false)
bool : _saturday Should the script analyze this day? (true/false)
bool : _sunday Should the script analyze this day? (true/false)
Returns: A boolean - true if the current bar's day is one of the given days
atrFilter(float, float) Checks the current bar's size against the given ATR and max size
Parameters:
float : _atr (default=ATR 14 period) The given ATR to check
float : _maxSize The maximum ATR multiplier of the current candle
Returns: A boolean - true if the current bar's size is less than or equal to _atr x _maxSize
fillCell(table, int, int, string, string, color, color) This updates the given table's cell with the given values
Parameters:
table : _table The table ID to update
int : _column The column to update
int : _row The row to update
string : _title The title of this cell
string : _value The value of this cell
color : _bgcolor The background color of this cell
color : _txtcolor The text color of this cell
Returns: A boolean - true if the current bar falls within the given dates

ZenLibraryLibrary "ZenLibrary"
A collection of custom tools & utility functions commonly used with my scripts.
getDecimals() Calculates how many decimals are on the quote price of the current market
Returns: The current decimal places on the market quote price
truncate(float, float) Truncates (cuts) excess decimal places
Parameters:
float : _number The number to truncate
float : _decimalPlaces (default=2) The number of decimal places to truncate to
Returns: The given _number truncated to the given _decimalPlaces
toWhole(float) Converts pips into whole numbers
Parameters:
float : _number The pip number to convert into a whole number
Returns: The converted number
toPips(float) Converts whole numbers back into pips
Parameters:
float : _number The whole number to convert into pips
Returns: The converted number
av_getPositionSize(float, float, float, float) Calculates OANDA forex position size for AutoView based on the given parameters
Parameters:
float : _balance The account balance to use
float : _risk The risk percentage amount (as a whole number - eg. 1 = 1% risk)
float : _stopPoints The stop loss distance in POINTS (not pips)
float : _conversionRate The conversion rate of our account balance currency
Returns: The calculated position size (in units - only compatible with OANDA)
getMA(int, string) Gets a Moving Average based on type
Parameters:
int : _length The MA period
string : _maType The type of MA
Returns: A moving average with the given parameters
getEAP(float) Performs EAP stop loss size calculation (eg. ATR >= 20.0 and ATR < 30, returns 20)
Parameters:
float : _atr The given ATR to base the EAP SL calculation on
Returns: The EAP SL converted ATR size
barsAboveMA(int, float) Counts how many candles are above the MA
Parameters:
int : _lookback The lookback period to look back over
float : _ma The moving average to check
Returns: The bar count of how many recent bars are above the MA
barsBelowMA(int, float) Counts how many candles are below the MA
Parameters:
int : _lookback The lookback period to look back over
float : _ma The moving average to reference
Returns: The bar count of how many recent bars are below the EMA
barsCrossedMA(int, float) Counts how many times the EMA was crossed recently
Parameters:
int : _lookback The lookback period to look back over
float : _ma The moving average to reference
Returns: The bar count of how many times price recently crossed the EMA
getPullbackBarCount(int, int) Counts how many green & red bars have printed recently (ie. pullback count)
Parameters:
int : _lookback The lookback period to look back over
int : _direction The color of the bar to count (1 = Green, -1 = Red)
Returns: The bar count of how many candles have retraced over the given lookback & direction
getBodySize() Gets the current candle's body size (in POINTS, divide by 10 to get pips)
Returns: The current candle's body size in POINTS
getTopWickSize() Gets the current candle's top wick size (in POINTS, divide by 10 to get pips)
Returns: The current candle's top wick size in POINTS
getBottomWickSize() Gets the current candle's bottom wick size (in POINTS, divide by 10 to get pips)
Returns: The current candle's bottom wick size in POINTS
getBodyPercent() Gets the current candle's body size as a percentage of its entire size including its wicks
Returns: The current candle's body size percentage
isHammer(float, bool) Checks if the current bar is a hammer candle based on the given parameters
Parameters:
float : _fib (default=0.382) The fib to base candle body on
bool : _colorMatch (default=false) Does the candle need to be green? (true/false)
Returns: A boolean - true if the current bar matches the requirements of a hammer candle
isStar(float, bool) Checks if the current bar is a shooting star candle based on the given parameters
Parameters:
float : _fib (default=0.382) The fib to base candle body on
bool : _colorMatch (default=false) Does the candle need to be red? (true/false)
Returns: A boolean - true if the current bar matches the requirements of a shooting star candle
isDoji(float, bool) Checks if the current bar is a doji candle based on the given parameters
Parameters:
float : _wickSize (default=2) The maximum top wick size compared to the bottom (and vice versa)
bool : _bodySize (default=0.05) The maximum body size as a percentage compared to the entire candle size
Returns: A boolean - true if the current bar matches the requirements of a doji candle
isBullishEC(float, float, bool) Checks if the current bar is a bullish engulfing candle
Parameters:
float : _allowance (default=0) How many POINTS to allow the open to be off by (useful for markets with micro gaps)
float : _rejectionWickSize (default=disabled) The maximum rejection wick size compared to the body as a percentage
bool : _engulfWick (default=false) Does the engulfing candle require the wick to be engulfed as well?
Returns: A boolean - true if the current bar matches the requirements of a bullish engulfing candle
isBearishEC(float, float, bool) Checks if the current bar is a bearish engulfing candle
Parameters:
float : _allowance (default=0) How many POINTS to allow the open to be off by (useful for markets with micro gaps)
float : _rejectionWickSize (default=disabled) The maximum rejection wick size compared to the body as a percentage
bool : _engulfWick (default=false) Does the engulfing candle require the wick to be engulfed as well?
Returns: A boolean - true if the current bar matches the requirements of a bearish engulfing candle
timeFilter(string, bool) Determines if the current price bar falls inside the specified session
Parameters:
string : _sess The session to check
bool : _useFilter (default=false) Whether or not to actually use this filter
Returns: A boolean - true if the current bar falls within the given time session
dateFilter(int, int) Determines if this bar's time falls within date filter range
Parameters:
int : _startTime The UNIX date timestamp to begin searching from
int : _endTime the UNIX date timestamp to stop searching from
Returns: A boolean - true if the current bar falls within the given dates
dayFilter(bool, bool, bool, bool, bool, bool, bool) Checks if the current bar's day is in the list of given days to analyze
Parameters:
bool : _monday Should the script analyze this day? (true/false)
bool : _tuesday Should the script analyze this day? (true/false)
bool : _wednesday Should the script analyze this day? (true/false)
bool : _thursday Should the script analyze this day? (true/false)
bool : _friday Should the script analyze this day? (true/false)
bool : _saturday Should the script analyze this day? (true/false)
bool : _sunday Should the script analyze this day? (true/false)
Returns: A boolean - true if the current bar's day is one of the given days
atrFilter(float, float) Checks the current bar's size against the given ATR and max size
Parameters:
float : _atr (default=ATR 14 period) The given ATR to check
float : _maxSize The maximum ATR multiplier of the current candle
Returns: A boolean - true if the current bar's size is less than or equal to _atr x _maxSize
fillCell(table, int, int, string, string, color, color) This updates the given table's cell with the given values
Parameters:
table : _table The table ID to update
int : _column The column to update
int : _row The row to update
string : _title The title of this cell
string : _value The value of this cell
color : _bgcolor The background color of this cell
color : _txtcolor The text color of this cell
Returns: A boolean - true if the current bar falls within the given dates
TASC 2021.11 MADH Moving Average Difference, Hann█ OVERVIEW
Presented here is code for the "Moving Average Difference, Hann" indicator originally conceived by John Ehlers. The code is also published in the November 2021 issue of Trader's Tips by Technical Analysis of Stocks & Commodities (TASC) magazine.
█ CONCEPTS
By employing a Hann windowed finite impulse response filter (FIR), John Ehlers has enhanced the Moving Average Difference (MAD) to provide an oscillator with exceptional smoothness.
Of notable mention, the wave form of MADH resembles Ehlers' "Reverse EMA" Indicator, formerly revealed in the September 2017 issue of TASC. Many variations of the "Reverse EMA" were published in TradingView's Public Library.
█ FEATURES
Three values in the script's "Settings/Inputs" provide control over the oscillators behavior:
• The price source
• A "Short Length" with a default of 8, to manage the lower band edge of the oscillator
• The "Dominant Cycle", originally set at 27, which appears to be a placeholder for an adaptive control mechanism
Two coloring options are provided for the line's fill:
• "ZeroCross", the default, uses the line's position above/below the zero level. This is the mode used in the top version of MADH on this chart.
• "Momentum" uses the line's up/down state, as shown in the bottom version of the indicator on the chart.
█ NOTES
Calculations
The source price is used in two independent Hann windowed FIR filters having two different periods (lengths) of historical observation for calculation, one being a "Short Length" and the other termed "Dominant Cycle". These are then passed to a "rate of change" calculation and then returned by the reusable function. The secret sauce is that a "windowed Hann FIR filter" is superior tp a generic SMA filter, and that ultimately reveals Ehlers' clever enhancement. We'll have to wait and see what ingenuities Ehlers has next to unleash. Stay tuned...
The `madh()` function code was optimized for computational efficiency in Pine, differing visibly from Ehlers' original formula, but yielding the same results as Ehlers' version.
Background
This indicator has a sibling indicator discussed in the "The MAD Indicator, Enhanced" article by Ehlers. MADH is an evolutionary update from the prior MAD indicator code published in the October 2021 issue of TASC.
Sibling Indicators
• Moving Average Difference (MAD)
• Cycle/Trend Analytics
Related Information
• Cycle/Trend Analytics And The MAD Indicator
• The Reverse EMA Indicator
• Hann Window
• ROC
Join TradingView!
