Percentage Of Rising MA'sReturn the percentage of rising moving averages with periods in a custom range from min to max , with the possibility of using different types of moving averages.
Settings
Minimum MA Length Value : minimum period of the moving average.
Maximum MA Length Value : maximum period of the moving average.
Smooth : determine the period of an EMA using the indicator as input, 1 (no smoothing) by default.
Src : source input for the moving averages.
Type : type of the moving averages to be analyzed, available options are "SMA", "WMA" and "TMA", by default "SMA".
Usages
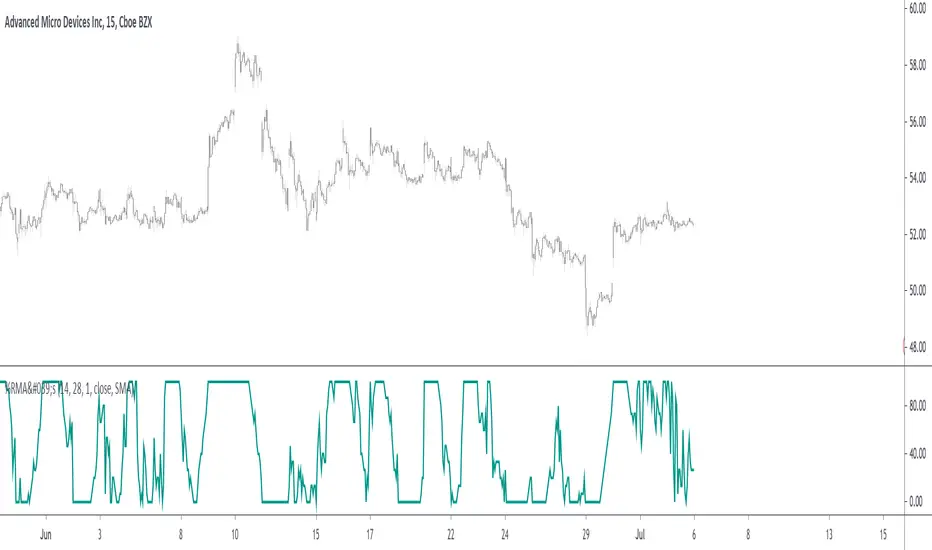
The indicator can return information about the main direction of a trend as well as its overall strength. A value of the indicator above 50 implies that more than 50% of the moving averages from period min to max are rising, this would suggest an uptrend, while a value inferior to 50 would suggest a down-trend.
On the chart, a ribbon consisting of simple moving averages from period 14 to 19, with a color indicating their direction, below the indicator with min = 14 and max = 19
The strength of a trend can be determined by how close the indicator is to 0 or 100, a value of 100 would imply that 100% percent of the moving averages are rising, this indicates a strong up-trend, while a value of 0 would suggest a strong down-trend.
Using different types of moving averages can allow to have more reactive or on the contrary, less noisy results.
Here the type of moving average used by both the ribbon and the indicator is the WMA, the WMA is more reactive than the SMA at the cost of providing less amount of filtering. On the other hand, using a triangular moving average (TMA) provide more filtering at the cost of being less reactive.
Finally, irregularities in the indicator output can be removed by using the smooth setting.
Above smooth = 50.
Details
The indicator is based upon a for loop, this implies that both the sma, wma or change functions are not directly usable, fortunately for us, it is possible to get the first difference of both the SMA, WMA and TMA without relying on a loop by using simple calculations.
The first difference of an SMA of period p is simply a momentum oscillator of period p divided by p , there are two ways to explain why this is the case, first, simple math can prove this, the first difference of an SMA is given by:
(x + x + ... + x )/p - (x + x + ... + x )/p
The repeating terms cancel each other out, as such, we end up with
(x - x )/p
which is simply a momentum oscillator divided by p , since this division doesn't change the sign of the output we can leave it out. We can also use impulses responses to prove this, the impulse response of a simple moving average is rectangular, taking the first difference of this impulse response will give the impulse response of a momentum oscillator, with the only difference being that the non-zero values of the result will be equal to 1/p instead of 1.
The same thing applies to the WMA
above the impulse response of the first difference of a WMA, we can see it is extremely similar to the one of a high pass SMA, only 1 bar longer, as such we can have the first difference of a WMA quite easily. The TMA is simply a 2 pass SMA (the SMA of an SMA), as such the solution is also simple.
In den Scripts nach "averages" suchen
Waldo RSI :oWaldo RSI :o Indicator Guide
The Waldo RSI :o indicator is designed to complement the "Waldo RSI Overlay :o" by providing an RSI-based analysis on TradingView, focusing on macro shifts in market trends. Here's a comprehensive guide on how to use this indicator:
Key Features:
RSI Settings:
RSI Source: Choose from ON RSI, ON HIGH, ON LOW, ON CLOSE, or ON OPEN to determine how RSI calculates pivots.
RSI Settings:
Source: Default is (H+L)/2, but you can select any price for RSI calculation.
Length: Default RSI length is 7, which can be adjusted for sensitivity.
Trend Lines:
Show Trend Lines: Option to display trend lines based on RSI pivot points.
Zigzag Length: Determines pivot point sensitivity.
Confirm Length: Validates pivot points (default is 3).
Colors: Customize colors for Higher Highs (HH), Lower Highs (LH), Higher Lows (HL), and Lower Lows (LL) on the RSI.
Label Size and Line Width: Adjust the appearance of labels and lines.
Divergences:
Classic Divergences:
Show Classic Div: Toggle to reveal divergences where RSI and price move in opposite directions.
Colors: Set different colors for bullish and bearish divergence indicators.
Transparency and Line Width: Control the visual impact of divergence signals.
Hidden Divergences:
Similar settings for identifying hidden divergences, suggest trend continuation.
Breakout/Breakdown:
Show Breakout/Breakdown: Generates signals for RSI breakouts or breakdowns, used by "Waldo RSI Overlay :o" for visual chart signals.
Overbought/Oversold Zones:
Show Overbought and OverSold Zones: Highlights when RSI goes above 70 (overbought) or below 30 (oversold).
Moving Averages on RSI:
The default Moving Average (MA) settings are tailored to capture macro shifts in market trends:
Show Moving Averages: Option to overlay two MAs on the RSI for trend confirmation:
Fast RSI MA:
RSI Period: 50 (this is the period over which the RSI is calculated).
MA Length: 50 (the number of periods used for the moving average of the RSI).
Slow RSI MA:
RSI Period: 50 (same as fast for consistency in RSI calculation).
MA Length: 200 (longer term for capturing broader trends).
Crossover Signals: The RSI changes color from red to green based on these moving average crossovers:
When the Fast MA (50 period) crosses above the Slow MA (200 period), the RSI turns green, indicating potential bullish conditions or momentum shift.
Conversely, when the Fast MA crosses below the Slow MA, the RSI turns red, suggesting bearish conditions or a shift back towards a downtrend.
This 50-period RSI crossover setting is used to identify overall macro shifts in the market, providing a clear visual cue for traders looking at longer-term trends.
Ghost Lines (Optional):
Ghost Lines: Option to limit how far RSI trend lines extend, helping to keep the chart less cluttered.
How to Use the Indicator:
Setup:
Configure RSI by choosing the source and setting the length to match your trading style.
Set the zigzag and confirm lengths for appropriate pivot detection.
Trend Analysis:
Monitor the RSI for trend changes using the colored trend lines and labels.
Divergence Detection:
Look for RSI and price divergences to anticipate potential reversals or continuations.
Breakout/Breakdown:
Use these signals in conjunction with "Waldo RSI Overlay :o" for price action confirmation.
Overbought/Oversold:
Identify when the market might be due for a correction or continued momentum.
Moving Averages:
Focus on the color changes in RSI to understand macro trend shifts with the default 50/200 period setup.
Ghost Lines:
Enable for a cleaner chart if you don't need trend lines extending indefinitely.
Usage Tips:
Combine with other indicators for confirmation, as no single tool is foolproof.
Adjust settings to suit different market conditions or trading timeframes.
Use in tandem with "Waldo RSI Overlay :o" for a full trading signal system.
Remember, trading involves significant risk, and historical data does not guarantee future performance. Use this indicator as part of a broader trading strategy.

Moving Average Crossover Strategy with Take Profit and Stop LossThe Moving Average Crossover Strategy is a popular trading technique that utilizes two moving averages (MAs) of different periods to identify potential buy and sell signals. By incorporating take profit and stop loss levels, traders can effectively manage their risk while maximizing potential returns. Here’s a detailed explanation of how this strategy works:
Overview of the Moving Average Crossover Strategy
Moving Averages:
A short-term moving average (e.g., 50-day MA) reacts more quickly to price changes, while a long-term moving average (e.g., 200-day MA) smooths out price fluctuations over a longer period.
The strategy generates trading signals based on the crossover of these two averages:
Buy Signal: When the short-term MA crosses above the long-term MA (often referred to as a "Golden Cross").
Sell Signal: When the short-term MA crosses below the long-term MA (known as a "Death Cross").
Implementing Take Profit and Stop Loss
1. Setting Take Profit Levels
Definition: A take profit order automatically closes a trade when it reaches a specified profit level.
Strategy:
Determine a realistic profit target based on historical price action, support and resistance levels, or a fixed risk-reward ratio (e.g., 2:1).
For instance, if you enter a buy position at $100, you might set a take profit at $110 if you anticipate that level will act as resistance.
2. Setting Stop Loss Levels
Definition: A stop loss order limits potential losses by closing a trade when the price reaches a specified level.
Strategy:
Place the stop loss just below the most recent swing low for buy orders or above the recent swing high for sell orders.
Alternatively, you can use a percentage-based method (e.g., 2-3% below the entry point) to define your stop loss.
For example, if you enter a buy position at $100 with a stop loss set at $95, your maximum loss would be limited to $5 per share.
Example of Using Moving Average Crossover with Take Profit and Stop Loss
Entry Signal:
You observe that the 50-day MA crosses above the 200-day MA at $100. You enter a buy position.
Setting Take Profit and Stop Loss:
You analyze historical price levels and set your take profit at $110.
You place your stop loss at $95 based on recent swing lows.
Trade Management:
If the price rises to $110, your take profit order is executed, securing your profit.
If the price falls to $95, your stop loss is triggered, limiting your losses.

Buy/Sell IndicatorBuy/Sell Indicator
Overview
The Buy/Sell Indicator is designed to help traders identify potential entry and exit points in the market using a combination of Simple Moving Averages (SMA) and the Relative Strength Index (RSI). This indicator plots buy and sell signals directly on the chart, making it easier to make informed trading decisions.
Inputs
Fast MA Length: The period for the fast-moving average. Default is 9.
Slow MA Length: The period for the slow-moving average. Default is 21.
RSI Length: The period for the RSI calculation. Default is 14.
RSI Overbought Level: The RSI level considered overbought. Default is 70.
RSI Oversold Level: The RSI level considered oversold. Default is 30.
How It Works
Moving Averages:
The indicator calculates two SMAs: a fast-moving average (fastMA) and a slow-moving average (slowMA).
The fast MA reacts more quickly to price changes, while the slow MA reacts more slowly.
RSI:
The RSI is calculated to measure the momentum of price movements.
It helps identify overbought and oversold conditions in the market.
Buy and Sell Conditions:
Buy Signal: A buy signal is generated when the fast MA crosses above the slow MA and the RSI is below the overbought level.
Sell Signal: A sell signal is generated when the fast MA crosses below the slow MA and the RSI is above the oversold level.
Plotting
Buy Signals: Displayed as green labels below the bars where the buy condition is met.
Sell Signals: Displayed as red labels above the bars where the sell condition is met.
Moving Averages: The fast MA is plotted in blue, and the slow MA is plotted in orange.

MA Correlation CoefficientThis script helps you visualize the correlation between the price of an asset and 4 moving averages of your choice. This indicator can help you identify trendy markets as well as trend-shifts.
Disclaimer
Bear in mind that there is always some lag when using Moving-Averages, hence the purpose of this indicator is as a trend identification tool rather than an entry-exit strategy.
Working Principle
The basic idea behind this indicator is the following:
In a trendy market you will find high correlation between price and all kinds of Moving-Averages. This works both ways, no matter bull or bear trend.
In sideways markets you might find a mix of correlations accross timeframes (2018) or high correlation with Low-Timeframe averages and low correlation with High-Timeframe averages (2021/2022).
Trend shifts might be characterised by a 'staircase' type of correlation (yellow), where the asset regains correlation with higher timeframe averages
Indicator Options
1. Source : data used for indicator calculation
1. Correlation Window : size of moving window for correlation calculation
2. Average Type :
Simple-Moving-Average (SMA)
Exponential-Moving-Average (EMA)
Hull-Moving-Average (HMA)
Volume-Weighted-Moving-Average (VWMA)
3. Lookback : number of past candles to calculate average
4. Gradient : modify gradient colors. colors relate to correlation values.
Plot Explanation
The indicator plots, using colors, the correlation of the asset with 4 averages. For every candle, 4 correlation values are generated, corresponding to 4 colors. These 4 colors are stacked one on top of the other generating the patterns explained above. These patterns may help you identify what kind of market you're in.

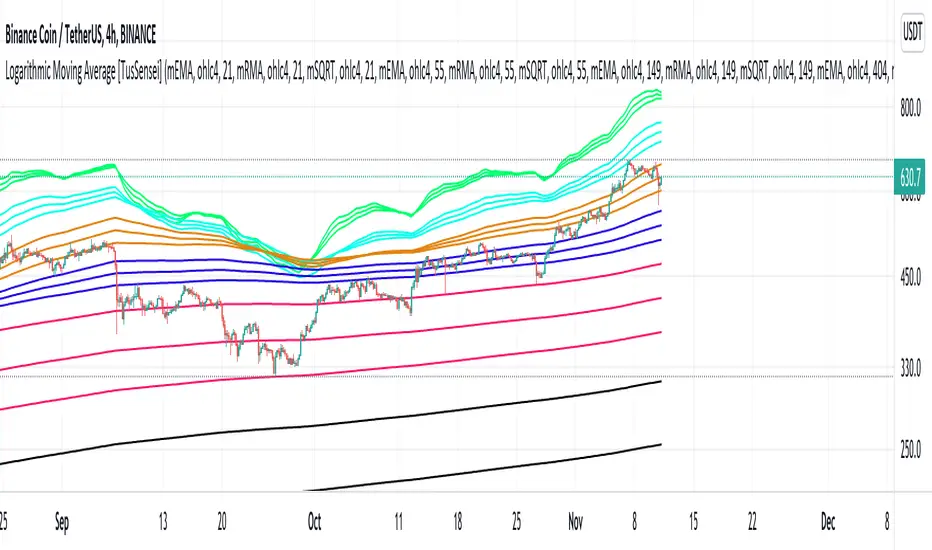
Logarithmic Moving Average [TusSensei]Logarithmic moving averages involve mathematical modification of classical moving averages(EMA-RMA-SMA). Logarithmic modified averages deviate high over short time periods. For long time periods, it behaves exactly like the original moving averages. Its basic formulation is (MovingAverage x (1 + (1 / log(length))).
The most important reason for the operability of logarithmic moving averages is the time periods they use. The values used are 21-55-149-404-1098-2981. These numbers are the consecutive powers of the number "e", which is the base of the natural logarithm (rounded up to an integer).
In this script you will also see another moving average called SQRT. This moving average is equal to the square root of the product of the EMA and the RMA. In other words, it is a moving average that is the geometric mean of two averages. In this script, you can use all of the EMA-RMA-SQRT and SMA averages in the classical and modified way. For formulaic modification, it is sufficient to select "mEMA", "mRMA" forms from the setting section.
Thanks everyone!
Flying Buddha Inside Bars Indicator v1 by JustUncleLDescription:
=============
This indicator plots MAs and paints Triggered Alert Arrows base on Flying Buddha candle patterns.
The “Flying Buddha” Pattern is defined as:
---------------------------------------------
A candlestick chart with two moving averages: the 5 period exponential moving average (fast EMA) and the 10 period simple moving average (slow SMA), both applied to the closing price. The default “Flying Buddha” pattern is any candlestick which:
1. Has a LOW above the fast EMA, when the fast EMA is above the slow SMA (a bearish “Flying Buddha”); or
2. Has a HIGH below the fast EMA, when the fast EMA is below the slow SMA (a bullish “Flying Buddha”).
Alert Trigger:
---------------
A Flying Buddha Alert is triggered on the first candle that is a non-flying Buddha candle after a Flying Buddha Pattern candle sequence. Flying Buddhas can optionally be filtered by InsideBars and PinBars.
The Alert Trigger is optionally filtered by the Directional MA (default=EMA 89), and/or by Minimum Sequence length of Flying Buddhas.
Moving Averages:
------------------
You can select between 11 different types of moving averages, for each MA line in Flying Buddha MAs (fastMA and slowMA) and the Directional Filter MA:
SMA = Simple Moving Average.
EMA = Exponential Moving Average.
WMA = Weighted Moving Average
VWMA = Volume Weighted Moving Average
SMMA = Smoothed Simple Moving Average.
DEMA = Double Exponential Moving Average
TEMA = Triple Exponential Moving Average.
HullMA = Hull Moving Average
SSMA = Ehlers Super Smoother Moving average
ZEMA = Near Zero Lag Exponential Moving Average.
TMA = Triangular (smoothed) Simple Moving Average.
NOTE: This is a concept indicator, I also intend to release a trading BOT suitable for Autoview, based on this concept indicator.

Candle Ribbon [UkutaLabs]The Candle Ribbon is a powerful trading tool that creates a strong ribbon that indicates market strength. This ribbon is created using three moving averages that use the candle values (high, low, open and close) as its input values.
The center most MA will also be colored green, red or grey depending on whether or not its direction aligns with current market strength.
The outer band lines act as range indicators, plotted above and below the center ribbon, which represent volatility boundaries for price action.
█ USAGE
The Candle Ribbon is created using a series of three moving averages that uses values from the candle as its inputs. The user has the ability to select whether the moving averages are EMAs or SMAs, as well as the ability to control the period of the moving averages.
If the moving average calculated using the Candle Open is below the moving average calculated using the Candle Close, the ribbon will be colored green, indicating a bullish trend. If the moving average calculated using the Candle Open is above the moving average calculated using the Candle Open, the ribbon will be colored red, indicating a bearish trend.
This indicator also uses a series of hidden EMAs to determine market strength. If these EMAs do not align with the direction of the Candle Ribbon, the middle MA will instead be colored grey, indicating uncertainty in the market, as well as a possible reversal.
█ SETTINGS
Configuration
• Moving Average Type: Determines whether or not the Candle Moving Averages will be drawn as EMAs or SMAs.
• Moving Average Period: Determines the period of the Candle Moving Averages.
Moving Average
• Moving Average Input: Determines the input values for the hidden EMAs.

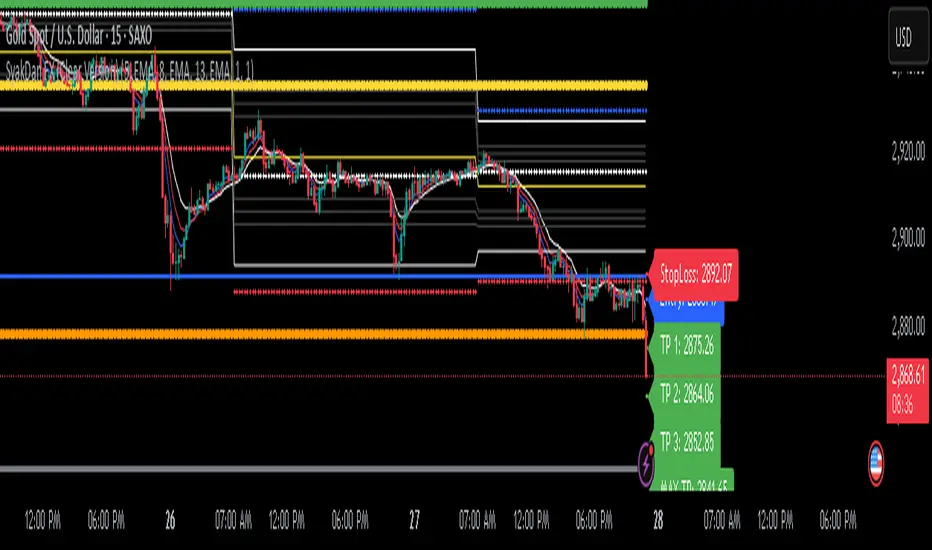
SyakDan FX (Clear Version)**SyakDan FX (Clear Version) - Indicator Description**
### Overview:
SyakDan FX (Clear Version) is a comprehensive TradingView indicator designed for account management, trend identification, and automated trading signals. This script utilizes multiple moving averages, ATR-based stop-loss calculations, and Fibonacci-based pivot points to assist traders in making informed trading decisions.
### Features:
1. **Account Management Calculation:**
- The indicator dynamically adapts to the current timeframe.
- Customizable moving average (MA) types, including EMA, SMA, WMA, and HMA.
- ATR-based trailing stop and volatility assessment.
2. **Moving Averages & Trend Identification:**
- Configurable EMA lengths for three different moving averages.
- Dynamic selection of MA types (SMA, EMA, WMA, HMA) for flexibility.
- Different EMA lengths for low and high timeframes.
- Automatic detection of EMA crossovers and trend changes.
3. **Entry, Stop-Loss, and Take-Profit Calculation:**
- Enables automatic calculation of entry, stop-loss, and take-profit levels.
- ATR-based stop-loss placement.
- Multi-level take-profit targets (TP1, TP2, TP3, and Max TP).
- Visual representation of SL/TP levels using dynamic lines and labels.
4. **Alerts & Notifications:**
- Alerts for EMA crossovers (Buy & Sell signals).
- Additional alerts when EMA 2 crosses EMA 3, indicating strong signals.
5. **Pivot Point Calculations:**
- Calculates daily and weekly pivot points using Fibonacci and traditional methods.
- Helps traders identify key support and resistance levels.
### How It Works:
- The indicator plots three customizable moving averages on the chart.
- It detects crossovers between these moving averages to identify potential buy and sell signals.
- ATR (Average True Range) is used to set dynamic stop-loss and take-profit levels.
- Traders can enable or disable automatic SL/TP plotting.
- Alerts notify users when key trade signals occur.
- Fibonacci and traditional pivot points provide additional confluence for trading decisions.
### Customization Options:
- **MA Type Selection:** Choose from SMA, EMA, WMA, or HMA for each moving average.
- **EMA Length Adjustments:** Modify the lengths for short-term and long-term trends.
- **SL/TP Settings:** Enable or disable SL/TP plotting and customize their multipliers.
- **Alert Preferences:** Enable or disable alerts for trend crossovers.
### Ideal Usage:
- Traders using trend-following strategies based on moving averages.
- Those who want automated SL/TP placement for risk management.
- Anyone looking to integrate pivot points into their trading decisions.
This indicator provides a clean, structured approach to trading with automated analysis, reducing the need for manual calculations while offering strong risk management tools.
Heiken Ashi Ribbon [UkutaLabs]█ OVERVIEW
The Heiken Ashi Ribbon is a powerful trading tool that creates a strong ribbon that indicates market strength. This ribbon is created using four moving averages that use Heiken Ashi values (high, low, open and close) as its input values.
The ribbon will also be colored green, red or grey depending on whether or not its direction aligns with current market strength.
█ USAGE
The Heiken Ashi Ribbon is created using a series of four moving averages that uses values from the Heiken Ashi bars as its inputs. The user has the ability to select whether the moving averages are EMAs or SMAs, as well as the ability to control the period of the moving averages.
If the moving average calculated using the Heiken Ashi Open is below the moving average calculated using the Heiken Ashi Close, the ribbon will be colored green, indicating a bullish trend. If the moving average calculated using the Heiken Ashi Open is above the moving average calculated using the Heiken Ashi Open, the ribbon will be colored red, indicating a bearish trend.
This indicator also uses a series of hidden EMAs to determine market strength. If these EMAs do not align with the direction of the Heiken Ashi Ribbon, the Ribbon will instead be colored grey, indicating uncertainty in the market, as well as a possible reversal.
█ SETTINGS
Configuration
• Moving Average Type: Determines whether or not the Heiken Ashi Moving Averages will be drawn as EMAs or SMAs.
• Moving Average Period: Determines the period of the Heiken Ashi Moving Averages.
Moving Average
• Moving Average Input: Determines the input values for the hidden EMAs.

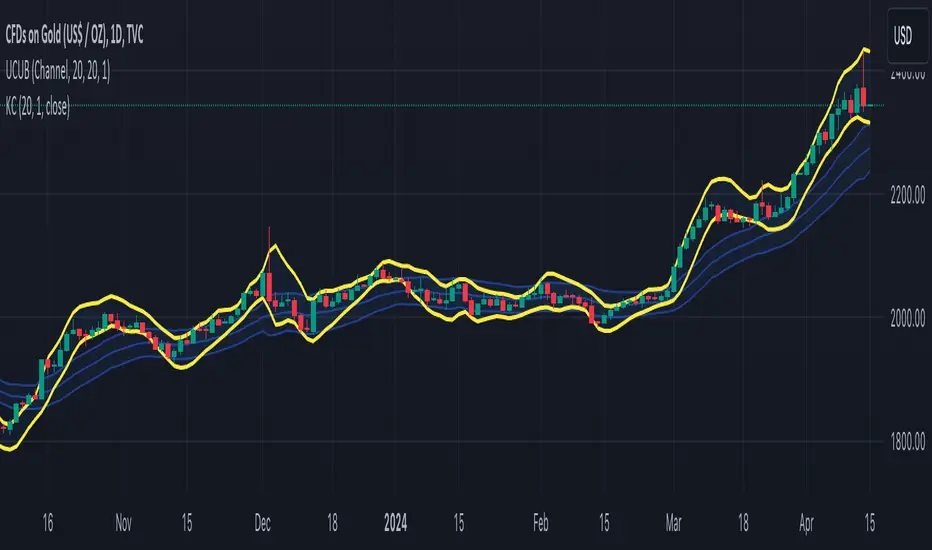
TASC 2024.05 Ultimate Channels and Ultimate Bands█ OVERVIEW
This script, inspired by the "Ultimate Channels and Ultimate Bands" article from the May 2024 edition of TASC's Traders' Tips , showcases the application of the UltimateSmoother by John Ehlers as a lag-reduced alternative to moving averages in indicators based on Keltner channels and Bollinger Bands®.
█ CONCEPTS
The UltimateSmoother , developed by John Ehlers, is a digital smoothing filter that provides minimal lag compared to many conventional smoothing filters, e.g., moving averages . Since this filter can provide a viable replacement for moving averages with reduced lag, it can potentially find broader applications in various technical indicators that utilize such averages.
This script explores its use as the smoothing filter in Keltner channels and Bollinger Bands® calculations, which traditionally rely on moving averages. By substituting averages with the UltimateSmoother function, the resulting channels or bands respond more quickly to fluctuations with substantially reduced lag.
Users can customize the script by selecting between the Ultimate channel or Ultimate bands and adjusting their parameters, including lookback lengths and band/channel width multipliers, to fine-tune the results.
█ CALCULATIONS
The calculations the Ultimate channels and Ultimate bands use closely resemble those of their conventional counterparts.
Ultimate channel:
Apply the Ultimate smoother to the `close` time series to establish the basis (center) value.
Calculate the smooth true range (STR) by applying the UltimateSmoother function with a user-specified length instead of a rolling moving average, thus replacing the conventional average true range (ATR). Users can adjust the final STR value using the "Width multiplier" input in the script's settings.
Calculate the upper channel value by adding the multiplied STR to the basis calculated in the first step, and calculate the lower channel value by subtracting the multiplied STR from the basis.
Ultimate bands:
Apply the Ultimate smoother to the `close` time series to establish the basis (center) value.
Calculate the width of the bands by finding the square root of the average of individual squared deviations over the specified length, then multiplying the result by the "Width multiplier" input value.
Calculate the upper band by adding the resulting width to the basis from the first step, and calculate the lower band by subtracting the width from the basis.
Market Smith IndicatorsMarket Smith has a collection of tools that are useful for identifying stocks. On their charts they have a 21/50/200 day moving averages, high and low pivot points, a relative strength line, and a relative strength rating. This script contains indicators for the following:
21/50/200 Day Moving Averages
High and Low pivot points
A Relative Strength line
A Relative Strength rating
21/50/200 Day Moving Averages
The 21/50/200 Day moving averages are simple moving averages. They are visible in any chart increment but to use them properly you need to set you charts to be by day. Labels will appear on the right of the lines to show that they are representative of 21/50/200 day moving averages.
High and Low pivot points
The High and Low pivot points are green for high pivot points and red for low points. They are show in the Market Smith style with the numbers simply above the pivot points.
Relative Strength line
The Relative Strength line is a line that shows the strength of the stock compared to the S&P 500. In this case we utilize the SPX ticker to compare the stock to. This line is almost identical to the Market Smith tool and is an excellent tool to determine how a stock is doing compared to the market. When movements in the stock and shown with sideways trending of the RS line that means that the stock is following the market. When a stock is outperforming the market the RS line will follow.
Relative Strength rating
Thank you to ©Fred6724 for the RS Rating inspiration. They wrote excellent open source code for a RS Rating comparable to Market Smith. As the RS Rating in Market Smith is not open source it is difficult to know exactly how it is being calculated. After simplifying Fred's code and building upon a few ideas I had I compared the RS Rating to multiple Market Smith Ratings. The rating is close but often off by multiple points. If there is anyone who has a better idea on how to get this rating or how to improve on the code please send me a PM or fork this project. This rating is a good indicator to see how a certain stock compares to other stocks in the market. In Market Smith they are able to utilize their database to compare it to all other stocks. Since we do not have access to the same tools we are only able to compare it to the percentage of stocks above the 200, 150, 100, 50, and 20 day moving average.
Using these tools together are a small fraction what make people like Bill O'neill and Jim Roppel so successful. I plan on updating the RS Rating as I continue to work on this project so if there is anyone who has ideas then please send me a PM. Ultimately the goal of this project is to have a solution that is identical to Market Smith.

WillyCycle Oscillator&DoubleMa/ErkOzi/"This code creates a technical analysis indicator used to calculate and visualize the WillyCycle oscillator and double moving average indicators on the price of a financial asset. The functionality can be summarized as follows:
*Calculate the WillyCycle oscillator: The WillyCycle is an oscillator calculated based on the highest and lowest values of an asset. This oscillator is used to measure overbought or oversold conditions of the asset.
*Calculate the double moving average: The double moving average helps determine trends by calculating the short-term and long-term moving averages of asset prices.
*Use the WillyCycle oscillator and double moving average indicators together: The WillyCycle oscillator is combined with the double moving averages to provide a clearer indication of overbought and oversold conditions.
*Visualize the indicator with color coding: The indicator is color-coded to show overbought and oversold conditions. Additionally, line and background colors are changed to make the indicator more readable.
Many parameters can be adjusted on the indicator: The indicator can be customized and modified by the user. For example, the period of the WillyCycle oscillator and the lengths of the double moving averages can be adjusted."
The strategy is based on two indicators - the WillyCycle oscillator and the double moving average. The WillyCycle oscillator measures overbought and oversold conditions of the asset based on its highest and lowest values. The double moving average calculates short-term and long-term moving averages of the asset's price, which can help identify trends.
The WillyCycle oscillator and the double moving average are combined in this strategy to provide a clearer indication of overbought and oversold conditions. When the WillyCycle oscillator indicates that the asset is oversold and the short-term moving average crosses above the long-term moving average, it may signal a buy opportunity. Conversely, when the WillyCycle oscillator indicates that the asset is overbought and the short-term moving average crosses below the long-term moving average, it may signal a sell opportunity.
To make it easier for traders to read and interpret the indicator, color-coding is used to indicate overbought and oversold conditions. The user can also customize the indicator by adjusting parameters such as the period of the WillyCycle oscillator and the lengths of the double moving averages.
*ıt provides successful buy and sell signals for price reversals.
*You can open counter trades in overbought and oversold areas by following the averages.

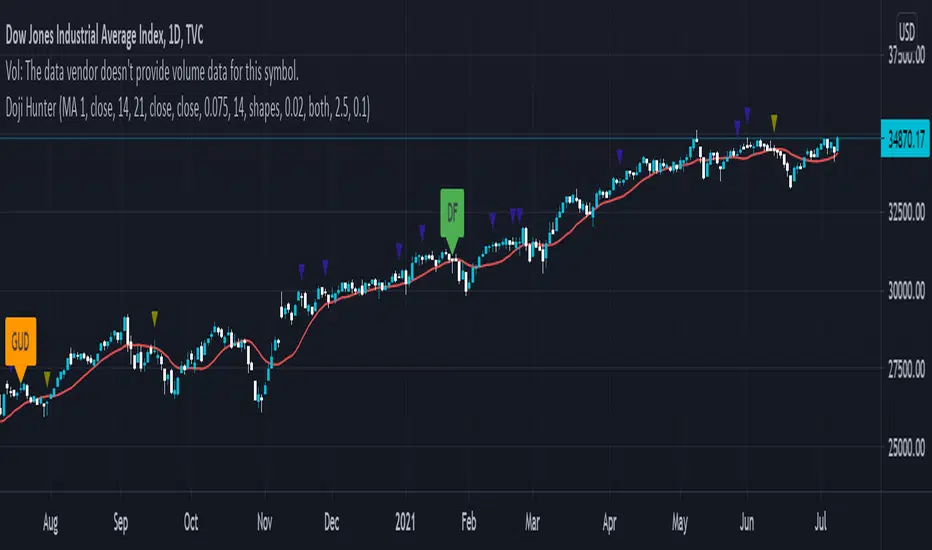
Doji Hunter█ OVERVIEW
This script is built to search for 8 different Doji candlestick patterns in markets and makes them appear on screen with bar coloring and creating color-coded labels/shapes. It will identify the following variants based upon user input for various rules to abide by:
Gapping Up
Gapping Down
Gravestone
Dragonfly
Long-Legged
Rickshaw Man
Northern (Doji in uptrend)
Southern (Doji in downtrend)
Note: for the remainder of this description, the types for inputs will be marked by italic text.
█ OPTIONS
This script features a wide range of options available to the user to modify how it functions. The first set of inputs dictate how the trend analysis is done with moving averages. The second and third sets of inputs dictate specific rules for how Doji candles are analyzed and the colors used for when they appear.
█ INPUTS (short)
1 — Moving Average Rules:
The Northern and Southern Doji variants require some trend analysis which will be done by Moving Averages. The inputs in this section change various things about the moving average(s) to be used. In the second section of inputs, there is one boolean option that will nullify the need for trend detection and consolidates the Northern and Southern Doji variants into one.
2/3 — Doji Rules and Colors:
The next two sections of inputs correspond to the various rules that dictate how various doji variants will be analyzed, as well as the colors that correspond to each variant. The colors will also apply to each of the labels/shapes used.
4 — Diagnostics:
The last boolean will allow the user to see extra detail with regards to how and when dojis are detected. Note: This is not a part of any prior section and is simply included as a last functional item to the list of all inputs.
An example of multiple labels being shown on screen for various types of Dojis (DJI 1D chart):
█ INPUTS (extended)
1 — Moving Average Rules:
This section consists of 10 different inputs specific to the rules on how the moving average functions for trend analysis.
"Trend Rule" ( string list) determines which Moving Average will be used for trend detection. It has 3 options: "MA 1", "MA 2", or "BOTH". The second input "Trend Source" determines which OHLC (or combination) value to use in comparison to either MA 1 or MA 2 (EX: Trend Rule -> "MA 1" and Trend Source -> "close": if close > MA 1 -> uptrend, downtrend otherwise). If "BOTH" is selected then "Trend Source" is ignored and added nuance in the script ensures that the shorter MA being above the longer MA yields an uptrend (downtrend otherwise).
The next 8 inputs focus on 4 different parts of both MA 1 and 2.
Length ( integer(s) )
Color
Switch between SMA/EMA ( boolean(s) )
Source for MA
Note: Additional attention to detail has been made here as trend direction is ignored if "BOTH" is selected for the MA Rules and the lengths of both Moving Averages are set to be the same.
2/3 — Doji Rules and Colors:
The next two sections include 19 inputs that are related to how this script will analyze and identify the different variants of Doji candles.
"Identify Pattern On Close" ( boolean ) modifies which candles are to be used for determining when Doji candles are recognized. This changes an offset used for historical reference on some global variables which will force the script to only identify patterns after the current candle has closed.
"Doji Body Tolerance" ( float ) tells the script the maximum % the candle body may be of the high-low range to be considered a Doji candle.
"Doji Wick Sample" ( integer ) defines how many prior candles to sample from in calculating the current average upper and lower wick sizes.
"Simplify Northern/Southern Dojis" ( boolean ) makes this script ignore trend direction for Doji detection and consolidates Northern and Southern Dojis into being recognized as the same. This has an added effect of removing the plotted moving averages from the screen.
"Northern/Southern Display" ( string list ) that has multiple options for how Northern and Southern Dojis will be displayed on screen. Because of how labels may be extremely taxing on TradingView's servers to display, the default setting is "shapes" where Northern and Southern (N/S) Dojis will be marked with a colored triangle at the top of the candle. If "Simplify Northern/Southern Dojis" is true, all N/S Dojis will be marked with an x-cross instead. Other options include "labels" which enables the use of labels accompanied by their respective tooltip and color, or "none" where N/S Dojis will be only noticeable by their changed barcolor.
"Allow Gravestone/Dragonfly Shadows" ( boolean ) allows a bit of additional nuance to the definition of Gravestone or Dragonfly Dojis with small shadows.
"Gravestone/Dragonfly Shadow Tolerance" ( float ) defines the maximum % that the lower wick/upper wick (respectively) may be relative to the high-low range for Gravestone or Dragonfly Dojis to still be considered valid.
"Doji Long Wick Setting" ( string list) is a list of settings for three different ways of confirming if a Doji is Long-Legged. The settings are "one", "two", and "average". These define how many wick lengths of a candle need to exceed the calculated average wick lengths (EX: "both" -> upper wick length > upper wick average and lower wick length > lower wick average). The "average" setting will combine the lengths of both wicks and both prior wick averages, divide both of these sums by 2 and compare them instead.
"Doji Long Wick Tolerance" ( float ) defines how large compared to the averages that wick lengths need to be in order for them to be considered "Long-Legged" (EX: 1.50 -> upper/lower wick needs to exceed 150% the average of previous upper/lower wicks).
"Rickshaw Man Body Placement Tolerance" ( float ) defines how close to the high-low range's midpoint the candle body's midpoint needs to be in order for it to be considered a Rickshaw Man Doji candle instead.
The remaining 9 inputs define the colors to use for differentiating between all Doji variants this script will recognize.
█ USAGE
My hope for this script is that users find this easy to use/understand and will tinker with the input values to better identify Doji candlesticks across a wide range of markets.
Suggestions for changes in the future are welcome.
Pi Cycle Top & Bottom Indicator [InvestorUnknown]The Pi Cycle Top & Bottom Indicator is designed for long-term cycle analysis, particularly useful for detecting significant market tops and bottoms in assets like Bitcoin. By comparing the behavior of two moving averages, one with a shorter period (default 111) and the other with a longer period (default 350), the indicator helps investors identify potential turning points in the market.
Key Features:
Dual Moving Average System:
The indicator uses two moving averages (MA) to create a cyclic oscillator. The shorter moving average (Short Length MA) is more reactive to recent price changes, while the longer moving average (Long Length MA) smooths out long-term trends. Users can select between:
Simple Moving Average (SMA): A straightforward average of closing prices.
Exponential Moving Average (EMA): Places more weight on recent prices, making it more responsive to market changes.
Oscillator Mode Options:
The Pi Cycle Indicator offers two modes of oscillation to better suit different analysis styles:
RAW Mode: This mode calculates the raw ratio of the Short MA to the Long MA, offering a simple comparison of the two averages.
LOG(X) Mode: In this mode, the oscillator takes the natural logarithm of the Short MA to Long MA ratio. This transformation compresses extreme values and highlights relative changes more effectively, making it particularly useful for spotting shifts in long-term trends.
Cyclical Analysis:
The core of the Pi Cycle Indicator is its ability to visualize the relationship between the two moving averages. The ratio of the Short MA to the Long MA is plotted as an oscillator. When the oscillator crosses above or below a baseline (which is 1 for RAW mode and 0 for LOG(X) mode), it signals potential market turning points.
Visual Representation:
The indicator provides a clear visual display of market conditions:
Orange Line: Represents the Pi Cycle Oscillator, which shows the relationship between the short and long moving averages.
Gray Baseline: A reference line that dynamically adjusts based on the oscillator mode. Crosses above or below this line help indicate possible trend reversals.
Shaded Areas: Color-filled areas between the oscillator and the baseline, which are shaded green when the market is bullish (oscillator above baseline) and red when bearish (oscillator below baseline). This provides a visual cue to assist in identifying potential market tops and bottoms.
Use Cases:
The Pi Cycle Top & Bottom Indicator is primarily used in long-term market analysis, such as Bitcoin cycles, to identify significant tops and bottoms. These moments often coincide with large cyclical shifts, making it valuable for those aiming to enter or exit positions at key moments in the market cycle.
By analyzing the interaction between short-term and long-term trends, investors can gain insight into broader market dynamics and make more informed decisions regarding entry and exit points. The ability to switch between moving average types (SMA/EMA) and oscillator modes (RAW/LOG) adds flexibility for adapting to different market environments.

TrendFriendOverview
TrendFriend (TF) combines various technical analysis components, including trend calculations, moving averages, RSI signals, and Fair Value Gaps (FVG) detection to determine trend reversal and continuation points. The FVG feature identifies potential consolidation periods and displays mitigation levels.
Features
Trend Analysis: Utilizes short and long-term Running Moving Averages (RMA) to identify trends.
Average True Range (ATR): Plots ATR to depict market volatility.
RSI Signals: Calculates RSI and provides buy/sell signals based on RSI conditions.
Fair Value Gaps (FVG): Detects FVG patterns and offers options for customization, including dynamic FVG, mitigation levels, and auto threshold.
Usage
Buy Signals: Generated based on pullback conditions, contra-buy signals, and crossovers of specified moving averages.
Sell Signals: Generated based on pullback conditions, contra-sell signals, and crossunders of specified moving averages.
Visualization: FVG areas are visually represented on the chart, and unmitigated levels can be displayed.
Configuration
Adjustable parameters for trend periods, ATR length, RSI settings, FVG threshold, and display preferences.
Dynamic FVG detection and mitigation level visualization can be enabled/disabled.
Usage Example
Trend Analysis: Identify trends with short and long-term moving averages.
RSI Signals: Interpret RSI signals for potential reversals.
FVG Detection: Visualize Fair Value Gaps and mitigation levels on the chart.
Buy/Sell Signals: Receive alerts for buy/sell signals based on specified conditions.
Disclaimer
This Pine Script code is subject to the terms of the Mozilla Public License 2.0. Use this code at your own risk, and always conduct additional analysis before making trading decisions.
Author
Author: devoperator84
License: Mozilla Public License 2.0
[KVA] Extremes ProfilerExtremes Profiler is a specialized indicator crafted for traders focusing on the relationship between price extremes and moving averages. This tool offers a comprehensive perspective on price dynamics by quantifying and visualizing significant distances of current prices from various moving averages. It effectively highlights the top extremes in market movements, providing key insights into price extremities relative to these averages. The indicator's ability to analyze and display these distances makes it a valuable tool for understanding market trends and potential turning points. Traders can leverage the Extremes Profiler to gain a deeper understanding of how prices behave in relation to commonly watched moving averages, thus aiding in making informed trading decisions
Key Features :
Extensive MA Analysis : Tracks the price distance from multiple moving averages including EMA, SMA, WMA, RMA, and HMA.
Top 50 (100) Distance Metrics : Highlights the 50 (100)greatest (highest or lowest) distances from each selected MA, pinpointing significant market deviations.
Customizable Periods : Offers flexibility with adjustable periods to align with diverse trading strategies.
Comprehensive View : Switch between timeframes for a well-rounded understanding of short-term fluctuations and long-term market trends.
Cross-Asset Comparison : Utilize the indicator to compare different assets, gaining insights into the relative dynamics and volatility of various markets. By analyzing multiple assets, traders can discern broader market trends and better understand asset-specific behaviors.
Customizable Display : Users can adjust the periods and number of results to suit their analytical needs.

Gate Signal by Market yogiThis indicator is made by Nischay Rana (Market Yogi)
How to use this Indicator
This is simple group of 8 moving averages, which can be configured in various ways according to your trading requirement.
1. moving average ribbon
2.moving average channel
3.moving average gate signal
4.This indicator has bonus indicator of bollinger bands inbuilt.
Logic:
As price has tendency to get closer to their moving averages. The logic behind this indicator is to use the contraction and expansion concepts of moving averages to find best entry exit points.
This nature of Price action is use to capture the big move after the convergence of all moving averages.
CAUTION : Do not blindly trade the gates as gate has tendency to break out on either side. So use this indicator in confluence with price action and other technical analysis to capture bigger moves.
Higher the gate width more gates are found. Similarly lesser the gate width less gate are found. i.e. Tight squeeze of all the moving averages.
"ENJOY HAPPY TRADING.."
Truly Yours Market Yogi

Momentum Explosion 2CCI RSI"Momentum Explosion Template for Mobile Metatrader", that is a trading system trend momentum based on two Commodity Channel Index (CCI) , RSI and two Moving Averages.The trading signals are generated by the crossing of the moving averages confirmed by the agreement of the two CCIs and the RSI.
Two Moving averages Filtered by double CCI and RSI
Credit is to Dimitri Author Beejay (Forex Factory)
Trading Rules Momentum Explosion
Buy
EMA 8 crosses upward SMA 26.
CCI 34 periods > 0
CCI 55 periods > 0
RSI 26 > 48.
Sell
EMA 8 crosses downward SMA 26.
CCI 34 periods < 0
CCI 55 periods < 0
RSI 26 < 48.

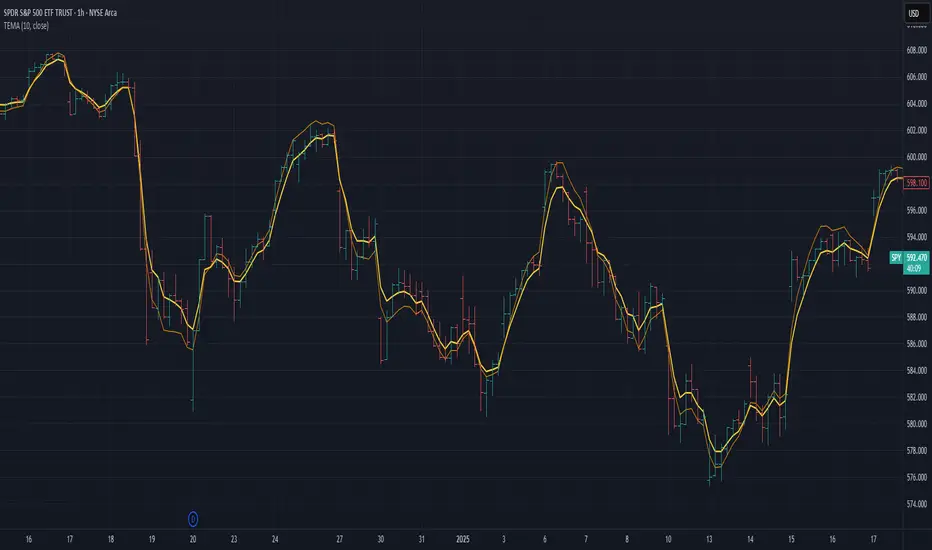
Triple Exponential Moving Average (TEMA)The Triple Exponential Moving Average (TEMA) is an advanced technical indicator designed to significantly reduce the lag inherent in traditional moving averages while maintaining signal quality. Developed by Patrick Mulloy in 1994 as an extension of his DEMA concept, TEMA employs a sophisticated triple-stage calculation process to provide exceptionally responsive market signals.
TEMA's mathematical approach goes beyond standard smoothing techniques by using a triple-cascade architecture with optimized coefficients. This makes it particularly valuable for traders who need earlier identification of trend changes without sacrificing reliability. Since its introduction, TEMA has become a key component in many algorithmic trading systems and professional trading platforms.
▶️ **Core Concepts**
Triple-stage lag reduction: TEMA uses a three-level EMA calculation with optimized coefficients (3, -3, 1) to dramatically minimize the delay in signal generation
Enhanced responsiveness: Provides significantly faster reaction to price changes than standard EMA or even DEMA, while maintaining reasonable smoothness
Strategic signal processing: Employs mathematical techniques to extract the underlying trend while filtering random price fluctuations
Timeframe effectiveness: Performs well across multiple timeframes, though particularly valued in short to medium-term trading
TEMA achieves its enhanced responsiveness through an innovative triple-cascade architecture that strategically combines three levels of exponential moving averages. This approach effectively removes the lag component inherent in EMA calculations while preserving the essential smoothing benefits.
▶️ **Common Settings and Parameters**
Length: Default: 12 | Controls sensitivity/smoothness | When to Adjust: Increase in choppy markets, decrease in strongly trending markets
Source: Default: Close | Data point used for calculation | When to Adjust: Change to HL2/HLC3 for more balanced price representation
Corrected: Default: false | Adjusts internal EMA smoothing factors for potentially faster response | When to Adjust: Set to true for a modified TEMA that may react quicker to price changes. false uses standard TEMA calculation
Visualization: Default: Line | Display format on charts | When to Adjust: Use filled cloud to see divergence from price more clearly
Pro Tip: For optimal trade signals, many professional traders use two TEMAs (e.g., 8 and 21 periods) and look for crossovers, which often provide earlier signals than traditional moving average pairs.
▶️ **Calculation and Mathematical Foundation**
Simplified explanation:
TEMA calculates three levels of EMAs, then combines them using a special formula that amplifies recent price action while reducing lag. This triple-processing approach effectively eliminates much of the delay found in traditional moving averages.
Technical formula:
TEMA = 3 × EMA₁ - 3 × EMA₂ + EMA₃
Where:
EMA₁ = EMA(source, α₁)
EMA₂ = EMA(EMA₁, α₂)
EMA₃ = EMA(EMA₂, α₃)
The smoothing factors (α₁, α₂, α₃) are determined as follows:
Let α_base = 2/(length + 1)
α₁ = α_base
If corrected is false:
α₂ = α_base
α₃ = α_base
If corrected is true:
Let r = (1/α_base)^(1/3)
α₂ = α_base * r
α₃ = α_base * r * r = α_base * r²
The corrected = true option implements a variation that uses progressively smaller alpha values for the subsequent EMA calculations. This approach aims to optimize the filter's frequency response and phase lag.
Alpha Calculation for corrected = true:
α₁ (alpha_base) = 2/(length + 1)
r = (1/α₁)^(1/3) (cube root relationship)
α₂ = α₁ * r = α₁^(2/3)
α₃ = α₂ * r = α₁^(1/3)
Mathematical Rationale for Corrected Alphas:
1. Frequency Response Balance:
The standard TEMA (where α₁ = α₂ = α₃) can lead to an uneven frequency response, potentially over-smoothing high frequencies or creating resonance artifacts. The geometric progression of alphas (α₁ > α₁^(2/3) > α₁^(1/3)) in the corrected version aims to create a more balanced filter cascade. Each stage contributes more proportionally to the overall frequency response.
2. Phase Lag Optimization:
The cube root relationship between the alphas is designed to minimize cumulative phase lag while maintaining smoothing effectiveness. Each subsequent EMA stage has a progressively smaller impact on phase distortion.
3. Mathematical Stability:
The geometric progression (α₁, α₁^(2/3), α₁^(1/3)) can enhance numerical stability due to constant ratios between consecutive alphas. This helps prevent the accumulation of rounding errors and maintains consistent convergence properties.
Practical Impact of corrected = true:
This modification aims to achieve:
Potentially better lag reduction for a similar level of smoothing
A more uniform frequency response across different market cycles
Reduced overshoot or undershoot in trending conditions
Improved signal-to-noise ratio preservation
Essentially, the cube root relationship in the corrected TEMA attempts to optimize the trade-off between responsiveness and smoothness that can be a challenge with uniform alpha values.
🔍 Technical Note: Advanced implementations apply compensation techniques to all three EMA stages, ensuring TEMA values are valid from the first bar without requiring a warm-up period. This compensation corrects initialization bias and prevents calculation errors from compounding through the cascade.
▶️ **Interpretation Details**
TEMA excels at identifying trend changes significantly earlier than traditional moving averages, making it valuable for both entry and exit signals:
When price crosses above TEMA, it often signals the beginning of an uptrend
When price crosses below TEMA, it often signals the beginning of a downtrend
The slope of TEMA provides insight into trend strength and momentum
TEMA crossovers with price tend to occur earlier than with standard EMAs
When multiple-period TEMAs cross each other, they confirm significant trend shifts
TEMA works exceptionally well as a dynamic support/resistance level in trending markets
For optimal results, traders often use TEMA in combination with momentum indicators or volume analysis to confirm signals and reduce false positives.
▶️ **Limitations and Considerations**
Market conditions: The high responsiveness can generate false signals during highly choppy, sideways markets
Overshooting: More aggressive lag reduction leads to more pronounced overshooting during sharp reversals
Parameter sensitivity: Changes in length have more dramatic effects than in simpler moving averages
Calculation complexity: Triple cascaded EMAs make behavior less predictable and more resource-intensive
Complementary tools: Should be used with confirmation tools like RSI, MACD or volume indicators
▶️ **References**
Mulloy, P. (1994). "Smoothing Data with Less Lag," Technical Analysis of Stocks & Commodities .
Mulloy, P. (1995). "Comparing Digital Filters," Technical Analysis of Stocks & Commodities .
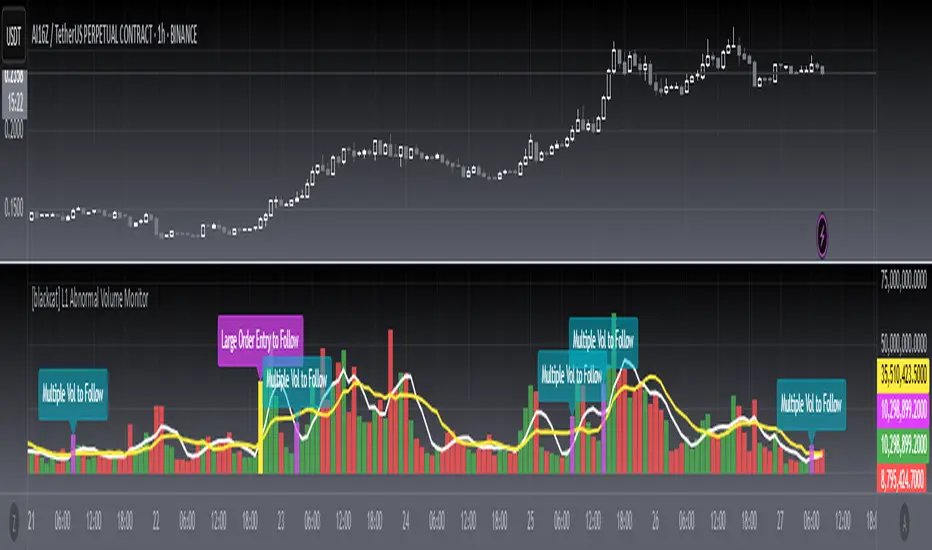
[blackcat] L1 Abnormal Volume Monitor█ OVERVIEW
The script is an indicator designed to monitor abnormal volume patterns in the market. It calculates and plots moving average volumes, identifies triple volume bars, and detects potential large order entries based on specific conditions.
█ FEATURES
• Input Parameters: The script defines parameters M1, M2, and lbk which control the calculation of moving averages and the lookback period for detecting abnormal volume.
• Calculations: The script calculates two moving averages of volume (MAVOL1 and MAVOL2), a smoothed price level (mm), and identifies conditions for triple volume bars and large order entries.
• Plotting: The script plots volume histograms for up and down bars, moving average volumes, and highlights triple volume bars with and without large order entries.
• Conditional Statements: The script uses conditional statements to determine when to plot certain data points and labels based on the calculated conditions.
█ LOGICAL FRAMEWORK
• xfl(cond, lbk): This function checks if a condition (cond) has been true within a specified lookback period (lbk). It returns true if the condition has been met and false otherwise.
• Parameters: cond (condition to check), lbk (lookback period).
• Return Value: outb (boolean indicating if the condition was met within the lookback period).
• abnormal_vol_monitor(close, open, high, low, volume, M1, M2, lbk): This function calculates moving average volumes, identifies triple volume bars, and detects large order entries.
• Parameters: close, open, high, low, volume (price and volume data), M1, M2 (periods for moving averages), lbk (lookback period).
• Return Value: A tuple containing MAVOL1, MAVOL2, xa (large order entry condition), and tripleVolume (triple volume condition).
█ KEY POINTS AND TECHNIQUES
• Moving Averages: The script uses simple moving averages (sma) and exponential moving averages (ema) to smooth volume data.
• Volume Analysis: The script identifies triple volume bars and large order entries based on specific conditions, such as volume doubling and price increases.
• Lookback Period: The xfl function uses a lookback period to ensure the accuracy of the detected conditions.
• Plotting Techniques: The script uses different plot styles and colors to distinguish between up bars, down bars, moving averages, and abnormal volume patterns.
█ EXTENDED KNOWLEDGE AND APPLICATIONS
• Modifications: The script could be modified to include additional conditions for detecting other types of abnormal volume patterns or to adjust the sensitivity of the detection.
• Extensions: Similar techniques could be applied to other financial instruments or timeframes to identify unusual trading activity.
• Related Concepts: The script utilizes concepts such as moving averages, exponential moving averages, and conditional plotting, which are fundamental in Pine Script and technical analysis.
Multiple SMA, EMA, and VWAP CrossoversMultiple SMA, EMA, and VWAP Crossovers with Alerts
Overview : The "Multiple SMA, EMA, and VWAP Crossovers" script is designed for traders who want to monitor various simple moving averages (SMAs), exponential moving averages (EMAs), and the volume-weighted average price (VWAP) to identify potential buy and sell opportunities. This script allows you to visualize key moving averages on your chart and create custom alerts for specific crossover events.
Detail s: This script plots the following moving averages:
Simple Moving Averages (SMA): 5, 10, 20, 50, 100, 200, and 325 periods
Exponential Moving Average (EMA): 9 periods
Volume-Weighted Average Price (VWAP)
It includes options to display these moving averages and set alerts for their crossovers.
Available Crossovers:
20/50 SMA, 20/100 SMA, 20/200 SMA, 20/325 SMA
50/100 SMA, 50/200 SMA, 50/325 SMA
100/200 SMA, 100/325 SMA
200/325 SMA
VWAP/20 SMA, VWAP/50 SMA, VWAP/100 SMA, VWAP/200 SMA, VWAP/325 SMA
Optional Lines to Add to the Chart:
9 EMA, 5 SMA, 10 SMA, 20 SMA, 50 SMA, 100 SMA, 200 SMA, 325 SMA, VWAP
How to Use:
Enable Indicators: Use the input options to select which SMAs, EMA, and VWAP you want to display on your chart.
Set Alerts: Choose the specific crossover events you want to monitor. For example, you can set an alert for the 20/50 SMA crossover or the VWAP/100 SMA crossover.
Monitor the Chart: The script will plot the selected moving averages on your chart. When a selected crossover event occurs, an alert will be triggered, notifying you of the potential trade opportunity.
Usage Tips:
Trending Market: Use the buy and sell alerts in trending markets where the moving averages can help confirm the direction of the trend.
Key Support and Resistance Levels: Combine crossover alerts with key support and resistance levels for more reliable trading signals.
Volume Confirmation: Ensure there is sufficient volume to support the crossover signals, indicating stronger momentum behind the move.
When NOT to Use Buy and Sell Alerts:
Low Volume: Avoid using buy and sell alerts during periods of low trading volume, as the signals may be less reliable.
Market Noise: Be cautious in highly volatile markets where frequent crossovers might generate false signals.
Sideways Market: In a sideways or range-bound market, crossover signals can result in multiple whipsaws, leading to potential losses.
Why Use This Script? This script provides a comprehensive tool for traders to monitor multiple moving averages and VWAP crossovers efficiently. It allows you to customize alerts based on your trading strategy and helps you make informed decisions by visualizing key technical indicators on your chart.
Legal Disclaimer: The information provided by this script is for educational and informational purposes only and should not be considered financial advice. The developer of this script is not responsible for any financial losses incurred from using this script.

Ichimoku Wave Oscillator with Custom MAIchimoku Wave Oscillator with Custom MA - Pine Script Description
This script uses various types of moving averages (MA) to implement the concept of Ichimoku wave theory for wave analysis. The user can select from SMA, EMA, WMA, TEMA, SMMA to visualize the difference between short-term, medium-term, and long-term waves, while identifying potential buy and sell signals at crossover points.
Key Features:
MA Type Selection:
The user can select from SMA (Simple Moving Average), EMA (Exponential Moving Average), WMA (Weighted Moving Average), TEMA (Triple Exponential Moving Average), and SMMA (Smoothed Moving Average) to calculate the waves. This script is unique in that it combines TEMA and SMMA, distinguishing it from other simple moving average-based indicators.
TEMA (Triple Exponential Moving Average): Best suited for capturing short-term trends with quick responsiveness.
SMMA (Smoothed Moving Average): Useful for identifying long-term trends with minimal noise, providing more stable signals.
Wave Calculations:
The script calculates three waves: Wave 9-17, Wave 17-26, and Wave 9-26, each of which analyzes different time horizons.
Wave 9-17 (blue): Primarily used for analyzing short-term trends, ideal for detecting quick changes.
Wave 17-26 (red): Used to analyze medium-term trends, providing a more stable market direction.
Wave 9-26 (green): Represents long-term trends, suitable for understanding broader trend shifts.
Baseline (0 Line):
Each wave is visualized around the 0 line, where waves above the line indicate an uptrend and waves below the line indicate a downtrend. This allows for easy identification of trend reversals.
Crossover Signals:
CrossUp: When Wave 9-17 (short-term wave) crosses Wave 17-26 (medium-term wave) upward, it is considered a buy signal, indicating a potential upward trend shift.
CrossDown: When Wave 9-17 (short-term wave) crosses Wave 17-26 downward, it is considered a sell signal, indicating a potential downward trend shift.
Background Color for Signal:
The script visually highlights the signals with background colors. When a buy signal occurs, the background turns green, and when a sell signal occurs, the background turns red. This makes it easier to spot reversal points.
Calculation Method:
The script calculates the difference between moving averages to display the wave oscillation. Wave 9-17, Wave 17-26, and Wave 9-26 represent the difference between the moving averages for different time periods, allowing for analysis of short-term, medium-term, and long-term trends.
Wave 9-17 = MA(9) - MA(17): Represents the difference between the short-term moving averages.
Wave 17-26 = MA(17) - MA(26): Represents the difference between medium-term moving averages.
Wave 9-26 = MA(9) - MA(26): Provides insight into the long-term trend.
This calculation method effectively visualizes the oscillation of waves and helps identify trend reversals at crossover points.
Uniqueness of the Script:
Unlike other moving average-based indicators, this script combines TEMA (Triple Exponential Moving Average) and SMMA (Smoothed Moving Average) to capture both short-term sensitivity and long-term stability in trends. This duality makes the script more versatile for different market conditions.
TEMA is ideal for short-term traders who need quick signals, while SMMA is useful for long-term investors seeking stability and noise reduction. By combining these two, this script provides a more refined analysis of trend changes across various timeframes.
How to Use:
This script is effective for trend analysis and reversal detection. By visualizing the crossover points between the waves, users can spot potential buy and sell signals to make more informed trading decisions.
Scalping strategies can rely on Wave 9-17 to detect quick trend changes, while those looking for medium-term trends can analyze signals from Wave 17-26.
For a broader market overview, Wave 9-26 helps users understand the long-term market trend.
This script is built on the concept of wave theory to anticipate trend changes, making it suitable for various timeframes and strategies. The user can tailor the characteristics of the waves by selecting different MA types, allowing for flexible application across different trading strategies.
Ichimoku Wave Oscillator with Custom MA - Pine Script 설명
이 스크립트는 다양한 이동 평균(MA) 유형을 활용하여 일목 파동론의 개념을 기반으로 파동 분석을 시도하는 지표입니다. 사용자는 SMA, EMA, WMA, TEMA, SMMA 중 원하는 이동 평균을 선택할 수 있으며, 이를 통해 단기, 중기, 장기 파동 간의 차이를 시각화하고, 교차점에서 상승 및 하락 신호를 포착할 수 있습니다.
주요 기능:
이동 평균(MA) 유형 선택:
사용자는 SMA(단순 이동 평균), EMA(지수 이동 평균), WMA(가중 이동 평균), TEMA(삼중 지수 이동 평균), SMMA(평활 이동 평균) 중 하나를 선택하여 파동을 계산할 수 있습니다. 이 스크립트는 TEMA와 SMMA의 독창적인 조합을 통해 기존의 단순한 이동 평균 지표와 차별화됩니다.
TEMA(삼중 지수 이동 평균): 빠른 반응으로 단기 트렌드를 포착하는 데 적합합니다.
SMMA(평활 이동 평균): 장기적인 추세를 파악하는 데 유용하며, 노이즈를 최소화하여 안정적인 신호를 제공합니다.
파동(Wave) 계산:
이 스크립트는 Wave 9-17, Wave 17-26, Wave 9-26의 세 가지 파동을 계산하여 각각 단기, 중기, 장기 추세를 분석합니다.
Wave 9-17 (파란색): 주로 단기 추세를 분석하는 데 사용되며, 빠른 추세 변화를 포착하는 데 유용합니다.
Wave 17-26 (빨간색): 중기 추세를 분석하는 데 사용되며, 좀 더 안정적인 시장 흐름을 보여줍니다.
Wave 9-26 (녹색): 장기 추세를 나타내며, 큰 흐름의 방향성을 파악하는 데 적합합니다.
기준선(0 라인):
각 파동은 0 라인을 기준으로 변동성을 시각화합니다. 0 위에 있는 파동은 상승세, 0 아래에 있는 파동은 하락세를 나타내며, 이를 통해 추세의 전환을 쉽게 확인할 수 있습니다.
파동 교차 신호:
CrossUp: Wave 9-17(단기 파동)이 Wave 17-26(중기 파동)을 상향 교차할 때, 상승 신호로 간주됩니다. 이는 단기적인 추세 변화가 발생할 수 있음을 의미합니다.
CrossDown: Wave 9-17(단기 파동)이 Wave 17-26(중기 파동)을 하향 교차할 때, 하락 신호로 해석됩니다. 이는 시장이 약세로 돌아설 가능성을 나타냅니다.
배경 색상 표시:
교차 신호가 발생할 때, 상승 신호는 녹색 배경, 하락 신호는 빨간색 배경으로 시각적으로 강조되어 사용자가 신호를 쉽게 인식할 수 있습니다.
계산 방식:
이 스크립트는 이동 평균 간의 차이를 계산하여 각 파동의 변동성을 나타냅니다. Wave 9-17, Wave 17-26, Wave 9-26은 각각 설정된 주기의 이동 평균(MA)의 차이를 통해, 시장의 단기, 중기, 장기 추세 변화를 시각적으로 표현합니다.
Wave 9-17 = MA(9) - MA(17): 단기 추세의 차이를 나타냅니다.
Wave 17-26 = MA(17) - MA(26): 중기 추세의 차이를 나타냅니다.
Wave 9-26 = MA(9) - MA(26): 장기적인 추세 방향을 파악할 수 있습니다.
이러한 계산 방식은 파동의 변동성을 파악하는 데 유용하며, 추세의 교차점을 통해 상승/하락 신호를 잡아냅니다.
스크립트의 독창성:
이 스크립트는 기존의 이동 평균 기반 지표들과 달리, TEMA(삼중 지수 이동 평균)와 SMMA(평활 이동 평균)을 함께 사용하여 짧은 주기와 긴 주기의 트렌드를 동시에 파악할 수 있도록 설계되었습니다. 이를 통해 단기 트렌드의 민감한 변화와 장기 트렌드의 안정성을 모두 반영합니다.
TEMA는 단기 트레이더에게 빠르고 민첩한 신호를 제공하며, SMMA는 장기 투자자에게 보다 안정적이고 긴 호흡의 트렌드를 파악하는 데 유리합니다. 두 지표의 결합으로, 다양한 시장 환경에서 추세의 변화를 더 정교하게 분석할 수 있습니다.
사용 방법:
이 스크립트는 추세 분석과 변곡점 포착에 효과적입니다. 각 파동 간의 교차점을 시각적으로 확인하고, 상승 또는 하락 신호를 포착하여 매매 시점 결정을 도울 수 있습니다.
스캘핑 전략에서는 Wave 9-17을 주로 참고하여 빠르게 추세 변화를 잡아내고, 중기 추세를 참고하고 싶은 경우 Wave 17-26을 사용해 신호를 분석할 수 있습니다.
장기적인 시장 흐름을 파악하고자 할 때는 Wave 9-26을 통해 큰 트렌드를 확인할 수 있습니다.
이 스크립트는 파동 이론의 개념을 기반으로 시장의 추세 변화를 예측하는 데 유용하며, 다양한 시간대와 전략에 맞추어 사용할 수 있습니다. 특히, 사용자가 선택한 MA 유형에 따라 파동의 특성을 변화시킬 수 있어, 여러 매매 전략에 유연하게 대응할 수 있습니다.
