In den Scripts nach "atr" suchen

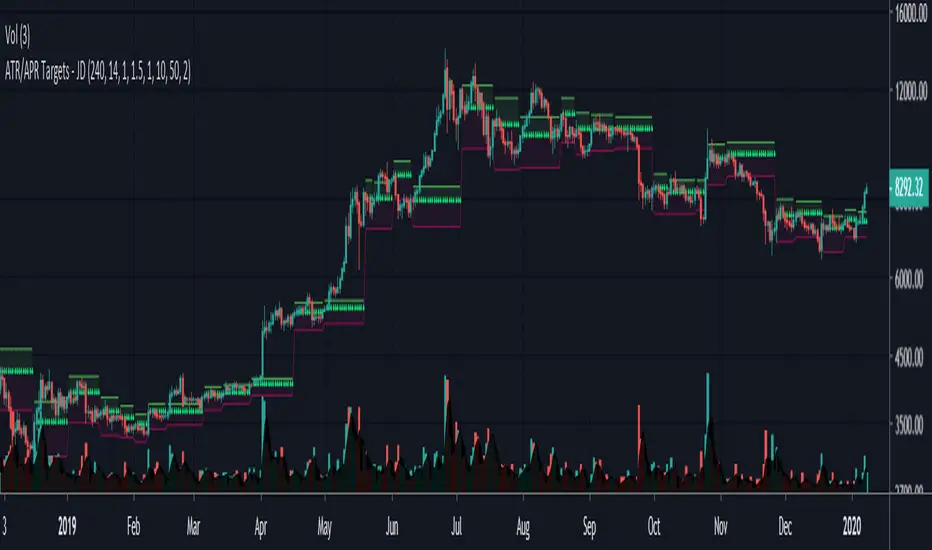
ATR Targets - JDA simple visual representation of ATR trading targets.
The indicator shows ATR targets (TP and SL) from the last swing points (if you entered there)
There is an option to chose targets for a long or short position.
JD.
#NotTradingAdvice #DYOR
I build these indicators for myself and provide them open source, to use for free to use and improve upon,
as I believe the best way to learn is toghether.
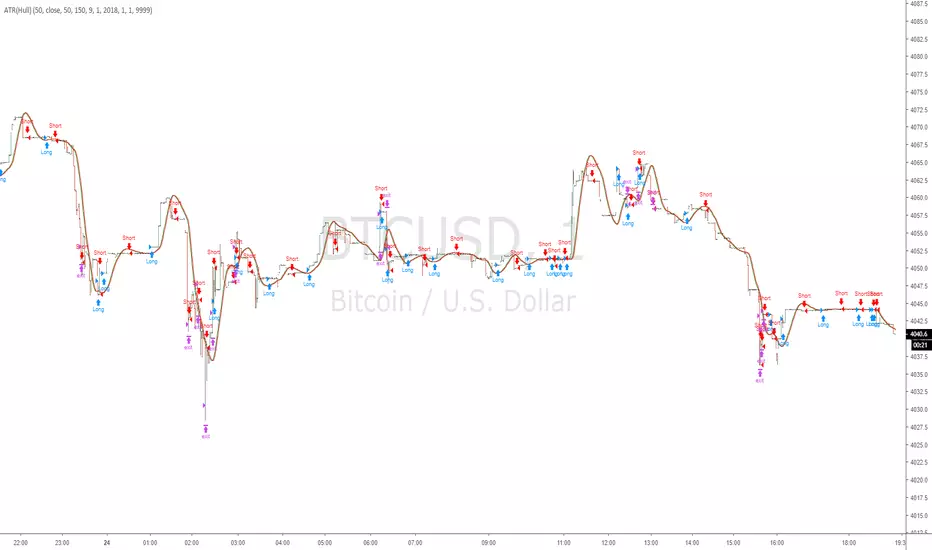
ATR smoothed by Hull MAThis is Average True Range indicator, but it is smoothed with Hull MA ( not WMA etc )
It is set to overlay the candles so looks different from normal ATR but i assure you it is ATR
Script open so you can see for yourself.
perhaps different settings are better,
Help me test it, and suggest improvements thankyou
DD ATR stop trailsATR based stop trails.
The top trail is basically lowest ATR since the last candle hit (with given length and multiplication) added to candle high.
The bottom trail is analogic.

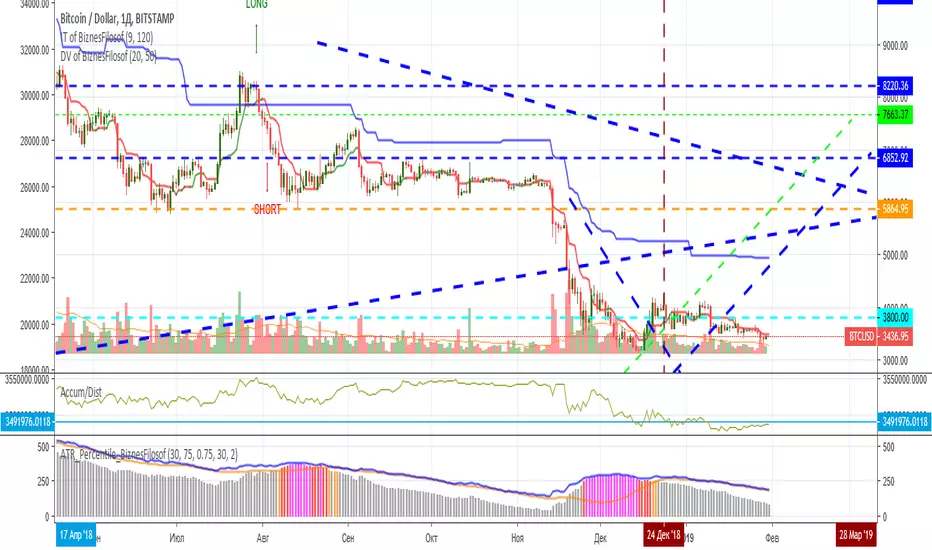
ATR Percentile BiznesFilosofThis script was created based on statistics and market research. Here you can see the increase in the activity of large players. Those. when they begin to take out "extra passengers", gaining a position for a strong trend movement in the aftermath. Also they can be found with stops and takeprofit (their value for the most likely operation).
By default, the red line stands at around 190. But then you can edit it for the current situation. Ideally, it should be at the lowest level of volatility (ATR).
The gray zone is favorable for setting stops and calculating the take-profit.
If you reduce the scale of the chart, you can see the red zone of market activity. This helps to understand when there is a lull in the big players (whales) and when they are again activated for the new pampas.
In more detail, I'm talking about this indicator on my channel in Youtube.
===
Этот скрипт создан, исходя из статистики и исследований рынка. Здесь можно увидеть повышение активности крупных игроков. Т.е. когда начинают выносить "лишних пассажиров", набирают позицию для сильного трендового движения в последствии. Также на основании данного индикатора можно определиться со стопами и тейкпрофитом (их величиной для наиболее вероятного срабатывания).
По умолчанию красная линия стоит на отметке 190. Но потом её можно отредактировать под текущую ситуацию. В идеале она должна быть на самом нижнем уровне волатильности (ATR).
Серая зона благоприятная для установки стопов и расчета тейкпрофита.
Если уменьшить масштаб графика, то можно увидеть красные зоны активности рынка. Это помогает понять, когда происходит затишье крупных игроков (китов) и когда опять они активируются для нового пампа.
Более подробно я рассказываю про этот индикатор на своём канале в Ютуб.
VWAP ATRATR Trailing stoploss with VWAP for confirmation and entry/exit points
VWAP resets on ATR cross

ATR or % Based Trailing Stop for Delta Exchange (trade_crush)This indicator calculates and visually displays a dynamic trailing stop line on the chart based on either the Average True Range (ATR) or a fixed percentage of the current close price. Designed especially for futures or crypto traders using Delta Exchange, it helps determine where to place trailing stop loss orders to manage risk effectively.

ATR stop lossPlots the stop loss level based on average true range (ATR) and a multiplier of choice (1 to 2.5, default is 1.5), subtracted from closing price.
Additions in this version:
You can now show percentage labels to help evaluate the level of risk.
The color of the plotted line and the text labels can be picked by the user.

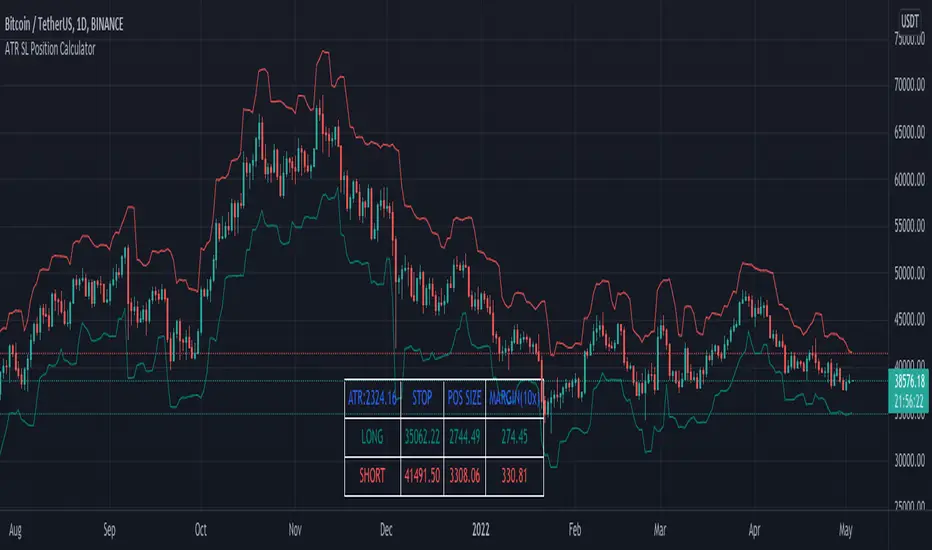
ATR SL + Position Size Calculator [DoctaBot]Props to @Veryfid for his original script 'ATR Stop Loss Finder'.
The concept is simple. We use the average true range to determine an appropriate stop loss distance based on recent volatility. The original script calculated the stop loss offset from the current candle's high or low. Here, I've added the option to offset stop loss from the recent local low or local high (a better way in my opinion).
I have also added a feature to automatically calculate position size by either dollar amount or as a percent of your account size to suit your risk profile (percent of account at risk per trade). This calculator supports use of leverage to calculate the amount of margin required to open desired position size.
ATR Daily Drift %This script is an especial request from a user
Plots the percent change between:
- ATR(daily) from yesterday
and
- open from today - actual price
Due to Tradingview limitations, only shows the plot if the actual timeframe of the graphic is daily or lower.
All my published scripts at: es.tradingview.com

ATR SL Buy/Sell w/ SMAsFirstly I'd like to state that this script's ATR buy/sell source is from the public script library here:
Additionally with the buy/sell signals from the original script, two more buy/sell conditions were added to give more entries/scaling in or out options. On top of that, two SMA lines were added, a 1 day moving average and a 5 day moving average.
This script is more so designed for scalping/scaling in and out of positions already made.
The SMAs add a level of confidence to the entry order, buy/sell triggers are not based on these SMAs.
For the confirmation on the entry, ideally you want a bullish cross on the SMAs, as well as the color of the SMA to correlate to the buy/sell color.

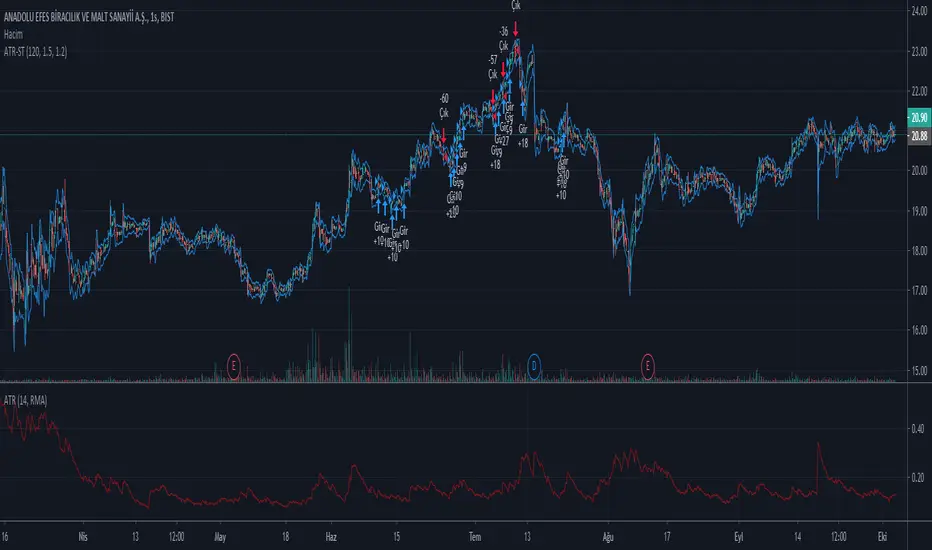
ATR Stop Buy StrategyThis strategy trial is let you to giving sell and buy orders with ATR (average true range) and an coefficent for them. it is my first strategy work, needs to be upgraded. USE IT WITH YOUR OWN RISK. IT IS NOT EVEN GUARANTEED TO WORK.
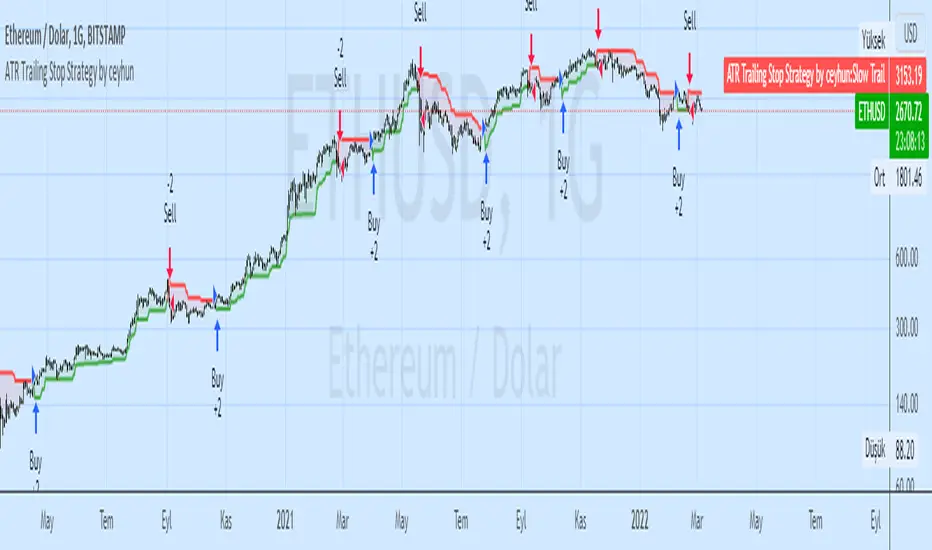
ATR Trailing Stop Strategy by ceyhunSame coding only coloring and strategy version added
//Barcolor
Green = Trail1 > Trail2 and close > Trail2 and low > Trail2
Blue = Trail1 > Trail2 and close > Trail2 and low < Trail2
Red = Trail2 > Trail1 and close < Trail2 and high < Trail2
Yellow = Trail2 > Trail1 and close < Trail2 and high > Trail2
//It gives White color where there is deterioration.
Let's not use InfoPanel in strategy, it would be wrong as it signals the next day.
ATR Trailing Stoploss StrategyI am sharing the strategy version of the indicator used before. It is very simple to use.
These are the settings I use, you can change, test and use as you wish.
Atr Period 5
Highest High Period 10
Multiplier 2.5
It can generate more signals in shorter time frames.
The success rate will be higher in longer time frames.

ATR Take Profit bandsSimple ATR-scaled levels or bands of suggested price to take profit on directional trades.

ATR Stop Loss LONG/SHORT by melihgulerYou can monitor the stop loss level according to ATR in 2 ways (Long/Short).

ATR _NormalizedThis script is good to use with Williams %R indicator, to find out when price has bottomed out.
ATR has to be over 90 and Williams %R ( lenght 52 ) has to be over 95 to find out level around which one is good to buy.
You can check back, to see that this worked very well over history. Best way to use this 2 indicators is with DCA ( dollar cost average ), as area where to buy can go a little bit down and up for as long as few months. So dont just jump in, use DCA .


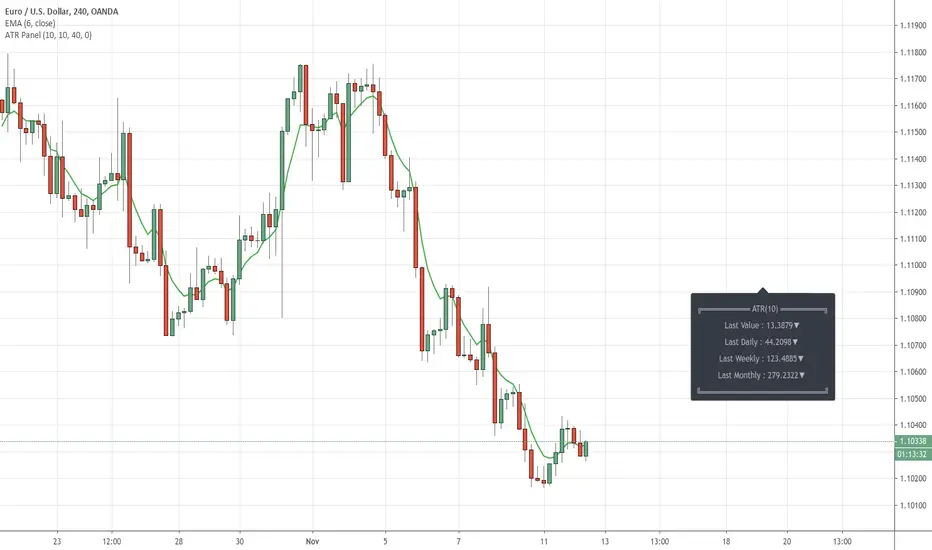
ATR Info Panel by JustUncleLDescription:
Display Last completed ATR values in a text information panel on the chart. These values are handy for calculating Stop Loss.
This script includes input offsets to optionally position the Panel, these can be Positive or Negative offsets.
References:
Thanks go to RicardoSantos for showing us the way to create a Panel with his Function - InfoPanel
ATR - Baby WhaleScript that shows you the ATR and 0.5 ATR.
You can use this to define your stop loss level when you see a SFP.
Standard setting is the 24 period ATR. You can use this for a 1h chart (24 hours in a day).
So when you play on a 5m chart, you can change the setting to 12 period (12 5m candles in 1 hour).


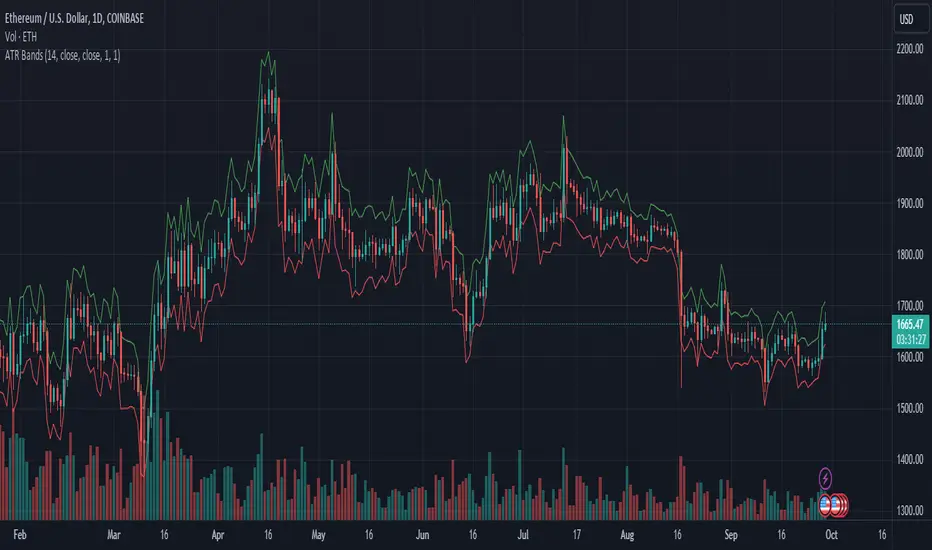
ATR BandsDisplays two bands above and below the source using the ATR. Comes with ATR multipliers for upper and lower bands.