Adaptive Fractal Grid Scalping StrategyThis Pine Script v6 component implements an "Adaptive Fractal Grid Scalping Strategy" with an added volatility threshold feature.
Here's how it works:
Fractal Break Detection: Uses ta.pivothigh and ta.pivotlow to identify local highs and lows.
Volatility Clustering: Measures volatility using the Average True Range (ATR).
Adaptive Grid Levels: Dynamically adjusts grid levels based on ATR and user-defined multipliers.
Directional Bias Filter: Uses a Simple Moving Average (SMA) to determine trend direction.
Volatility Threshold: Introduces a new input to specify a minimum ATR value required to activate the strategy.
Trade Execution Logic: Places limit orders at grid levels based on trend direction and fractal levels, but only when ATR exceeds the volatility threshold.
Profit-Taking and Stop-Loss: Implements profit-taking at grid levels and a trailing stop-loss based on ATR.
How to Use
Inputs: Customize the ATR length, SMA length, grid multipliers, trailing stop multiplier, and volatility threshold through the input settings.
Visuals: The script plots fractal points and grid levels on the chart for easy visualization.
Trade Signals: The strategy automatically places buy/sell orders based on the detected fractals, trend direction, and volatility threshold.
Profit and Risk Management: The script includes logic for taking profits and setting stop-loss levels to manage trades effectively.
This strategy is designed to capitalize on micro-movements during high volatility and avoid overtrading during low-volatility trends. Adjust the input parameters to suit your trading style and market conditions.
In den Scripts nach "atr" suchen

RSI + ADX + ATR 18-01-25Combining RSI (Relative Strength Index), ADX (Average Directional Index), and ATR (Average True Range) creates a synergistic approach to technical analysis. This powerful trio covers momentum, trend strength, and volatility, providing comprehensive insights into market conditions. Here's a deeper exploration of their combined results:
1. Momentum Assessment with RSI
Purpose: RSI measures the speed and magnitude of recent price changes to determine overbought or oversold levels.
Benefit in Combination:
When RSI indicates overbought (above 70) or oversold (below 30) levels, it signals a potential reversal or correction.
However, these signals can be false in strongly trending markets, which is why ADX is used alongside it.
2. Trend Strength Confirmation with ADX
Purpose: ADX confirms the presence and strength of a trend.
Benefit in Combination:
If RSI shows a potential reversal but ADX indicates a strong trend (above 25), the trend is likely to continue, and RSI signals may need to be approached with caution.
Conversely, if ADX is below 20 (weak trend), RSI signals are more likely to indicate genuine reversals, as the market lacks a strong directional push.
3. Volatility Analysis with ATR
Purpose: ATR evaluates the level of price volatility.
Benefit in Combination:
High ATR values indicate volatile conditions where prices can move significantly; this helps in setting wider stop-loss levels to avoid premature exits.
Low ATR values suggest quieter markets, where tighter stop-losses and profit targets are more suitable.

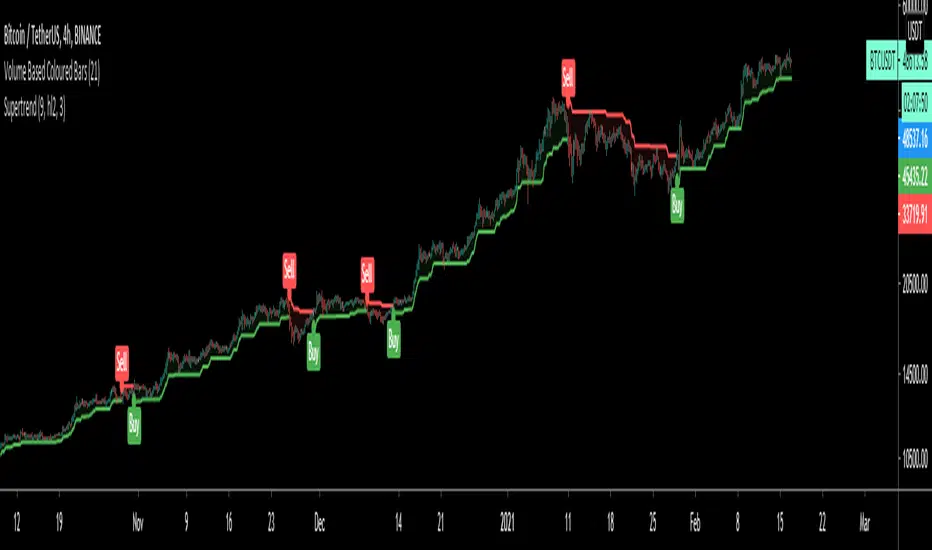
DAILY Supertrend + EMA Crossover with RSI FilterThis strategy is a technical trading approach that combines multiple indicators—Supertrend, Exponential Moving Averages (EMAs), and the Relative Strength Index (RSI)—to identify and manage trades.
Core Components:
1. Exponential Moving Averages (EMAs):
Two EMAs, one with a shorter period (fast) and one with a longer period (slow), are calculated. The idea is to spot when the faster EMA crosses above or below the slower EMA. A fast EMA crossing above the slow EMA often suggests upward momentum, while crossing below suggests downward momentum.
2. Supertrend Indicator:
The Supertrend uses Average True Range (ATR) to establish dynamic support and resistance lines. These lines shift above or below price depending on the prevailing trend. When price is above the Supertrend line, the trend is considered bullish; when below, it’s considered bearish. This helps ensure that the strategy trades only in the direction of the overall trend rather than against it.
3. RSI Filter:
The RSI measures momentum. It helps avoid buying into markets that are already overbought or selling into markets that are oversold. For example, when going long (buying), the strategy only proceeds if the RSI is not too high, and when going short (selling), it only proceeds if the RSI is not too low. This filter is meant to improve the quality of the trades by reducing the chance of entering right before a reversal.
4. Time Filters:
The strategy only triggers entries during user-specified date and time ranges. This is useful if one wants to limit trading activity to certain trading sessions or periods with higher market liquidity.
5. Risk Management via ATR-based Stops and Targets:
Both stop loss and take profit levels are set as multiples of the ATR. ATR measures volatility, so when volatility is higher, both stops and profit targets adjust to give the trade more breathing room. Conversely, when volatility is low, stops and targets tighten. This dynamic approach helps maintain consistent risk management regardless of market conditions.
Overall Logic Flow:
- First, the market conditions are analyzed through EMAs, Supertrend, and RSI.
- When a buy (long) condition is met—meaning the fast EMA crosses above the slow EMA, the trend is bullish according to Supertrend, and RSI is below the specified “overbought” threshold—the strategy initiates or adds to a long position.
- Similarly, when a sell (short) condition is met—meaning the fast EMA crosses below the slow EMA, the trend is bearish, and RSI is above the specified “oversold” threshold—it initiates or adds to a short position.
- Each position is protected by an automatically calculated stop loss and a take profit level based on ATR multiples.
Intended Result:
By blending trend detection, momentum filtering, and volatility-adjusted risk management, the strategy aims to capture moves in the primary trend direction while avoiding entries at excessively stretched prices. Allowing multiple entries can potentially amplify gains in strong trends but also increases exposure, which traders should consider in their risk management approach.
In essence, this strategy tries to ride established trends as indicated by the Supertrend and EMAs, filter out poor-quality entries using RSI, and dynamically manage trade risk through ATR-based stops and targets.

Multi-Timeframe ATRsThis Multi-Timeframe ATR Indicator displays the Average True Range (ATR) values from multiple timeframes on a single chart, allowing traders to assess market volatility across different time periods. The indicator calculates and plots the ATR for the 1-hour, 3-hour, 4-hour, 1-day, and 2-day timeframes, with the option to toggle each timeframe on or off based on user preferences. By visualizing these ATR values, traders can identify potential price movement expectations for various timeframes and better understand how volatility is shifting across the market. This tool is handy for traders who want to gauge volatility over different time periods and incorporate it into their trading strategies.
By evaluating higher timeframes when entering trades, a trader can better understand market conditions. This insight helps the trader make informed decisions about whether to remain in the trade for a longer period.
The indicator is fully customizable, with color-coded plots for each timeframe and optional labels that display the ATR values directly on the chart. It is ideal for traders looking to add volatility insights to their technical analysis without cluttering their charts.

Supertrend StrategyThe Supertrend Strategy was created based on the Supertrend and Relative Strength Index (RSI) indicators, widely respected tools in technical analysis. This strategy combines these two indicators to capture market trends with precision and reliability, looking for optimizing exit levels at oversold or overbought price levels.
The Supertrend indicator identifies trend direction based on price and volatility by using the Average True Range (ATR). The ATR measures market volatility by calculating the average range between an asset’s high and low prices over a set period. It provides insight into price fluctuations, with higher ATR values indicating increased volatility and lower values suggesting stability. The Supertrend Indicator plots a line above or below the price, signaling potential buy or sell opportunities: when the price closes above the Supertrend line, an uptrend is indicated, while a close below the line suggests a downtrend. This line shifts as price movements and volatility levels change, acting as both a trailing stop loss and trend confirmation.
To enhance the Supertrend strategy, the Relative Strength Index (RSI) has been added as an exit criterion. As a momentum oscillator, the RSI indicates overbought (usually above 70) or oversold (usually below 30) conditions. This integration allows trades to close when the asset is overbought or oversold, capturing gains before a possible reversal, even if the percentage take profit level has not been reached. This mechanism aims to prevent losses due to market reversals before the Supertrend signal changes.
### Key Features
1. **Entry criteria**:
- The strategy uses the Supertrend indicator calculated by adding or subtracting a multiple of the ATR from the closing price, depending on the trend direction.
- When the price crosses above the Supertrend line, the strategy signals a long (buy) entry. Conversely, when the price crosses below, it signals a short (sell) entry.
- The strategy performs a reversal if there is an open position and a change in the direction of the supertrend occurs
2. **Exit criteria**:
- Take profit of 30% (default) on the average position price.
- Oversold (≤ 5) or overbought (≥ 95) RSI
- Reversal when there is a change in direction of the Supertrend
3. **No Repainting**:
- This strategy is not subject to repainting, as long as the timeframe configured on your chart is the same as the supertrend timeframe .
4. **Position Sizing by Equity and risk management**:
- This strategy has a default configuration to operate with 35% of the equity. At the time of opening the position, the supertrend line is typically positioned at about 12 to 16% of the entry price. This way, the strategy is putting at risk about 16% of 35% of equity, that is, around 5.6% of equity for each trade. The percentage of equity can be adjusted by the user according to their risk management.
5. **Backtest results**:
- This strategy was subjected to deep backtesting and operations in replay mode, including transaction fees of 0.12%, and slippage of 5 ticks.
- The past results in deep backtest and replay mode were compatible and profitable (Variable results depending on the take profit used, supertrend and RSI parameters). However, it should be noted that few operations were evaluated, since the currency in question has been created for a short time and the frequency of operations is relatively small.
- Past results are no guarantee of future results. The strategy's backtest results may even be due to overfitting with past data.
Default Settings
Chart timeframe: 2h
Supertrend Factor: 3.42
ATR period: 14
Supertrend timeframe: 2 h
RSI timeframe: 15 min
RSI Lenght: 5 min
RSI Upper limit: 95
RSI Lower Limit: 5
Take Profit: 30%
BYBIT:1000000MOGUSDT.P

RSI ATR Range [SS]Hey everyone,
Over the course of the last year I had a bunch of requests to do something with RSI. I did do an RSI expected move plotter, but the requests were to overhaul RSI and make it better I guess.
So here is my attempt!
This is the RSI ATR plotter. Its similar to my RSI expected move plotter, however, it gives you the ATR ranges associated with the current RSI value. This allows you to conceptualize RSI in a different way. Instead of looking for "oversold" over "overbought", you can actually just see the expected high to open range and the expected open to low range based on the current RSI.
This will allow you to determine such things as:
a) Is it likely to be bullish?
b) Is it likely to be bearish?
c) The average move, in a dollar amount, associated with this RSI.
In addition to presenting RSI in terms of ranges as opposed to the actual RSI value, the indicator will also signal likely reversal areas. Whenever there is a huge spike in RSI and range, whether it be up or down, this generally corresponds to an imminent reversal. The indicator is programmed to recognize this and plot little grey circles to notify you of an impending reversal.
Let's take a look at some reversal examples using NVDA:
In the chart above, we can see that the RSI signaled a reversal. As it was part of a downtrend, the reversal was bullish.
Let's look at a top reversal:
The chart above shows a likely downside reversal.
And some little bounce reversals here and there:
In addition to showing you the ATR range and reversals, the indicator will show you the RSI in a bar graph format:
You won't be able to look for RSI divergences, if you are a believer of those. However, you can definitely visualize them in the ATR ranges which are directly affected by the RSI readings.
Aspects of the indicator:
Bull ranges are displayed in green.
Bear ranges are displayed in red.
When green is present we know its entering or currently in a bullish RSI range:
Inversely, when it starts to shift red, we know we are entering a bearish RSI range:
There is a border that circles the range. It will be green when we are in a bullish range and red when we are in a bearish range. In addition to these 2 signals, the RSI bar chart itself will turn green in bullish ranges, and red in bearish ranges.
Here is bullish:
Here is bearish:
Customizability
You can customize the Source input for the RSI (default is close). As well as the length (default is 14).
The ATR length is defaulted to 500. My suggestion is to leave this be. You can increase it but I would not suggest decreasing it as it may omit some of the RSI ranges from its history.
And that is the indicator my friends! Hope you enjoy!
As always, safe trades!

Daily Chart ATR & Movement %This Pine Script, titled "Daily ATR & Movement %," is designed for traders looking to gauge volatility and price movements relative to that volatility directly on their trading chart. The script calculates and displays the Average True Range (ATR) over a 14-day period using daily data, alongside the percentage movement of the current price from the previous day's close, scaled by the ATR. These metrics provide a snapshot of daily volatility and the magnitude of price movements within that context, which can be crucial for making informed trading decisions, especially in markets where volatility is a significant factor.
Key Features:
Daily ATR Calculation: Utilizes the ta.atr(14) function to compute the Average True Range on a daily basis, which measures market volatility by decomposing the entire range of asset prices for that day.
Movement Percentage: The script calculates the movement from yesterday’s closing price to today’s current price as a percentage of the daily ATR. This shows how significant today's price change is relative to the typical daily volatility, which helps in understanding whether the price movement is substantial or trivial.
Customizable Label Display: Traders can customize the display through a user input dropdown menu for label size ("small", "normal", "large", "huge") and a slider for vertical offset. This allows for better visibility and customization based on user preference and screen setup.
Dynamic Label Updates: A label is dynamically updated each bar with the latest ATR value and movement percentage. This ongoing update keeps traders informed in real-time without manual recalculations.
How to Use:
Setup: Apply the indicator to any chart.
Customization: Adjust the label size and vertical position to suit your viewing preference using the script’s input options.
Interpretation: Monitor the displayed ATR value and movement percentage to assess volatility and relative price movements. High percentages could indicate significant moves worth trading, while low percentages suggest minor changes.
This script is particularly useful for traders who rely on volatility-based trading strategies, such as breakout trading, where understanding the context of price movements relative to typical market fluctuations can provide a strategic edge.
ZigZag With ATR Filter [vnhilton](OVERVIEW)
The typical ZigZag indicator, which connects pivot points (see TradingView's Help Center regarding their indicator Pivot Points High Low, for an in depth explanation on how they are calculated) with lines, except instead of a percentage threshold, it uses ATR which adjusts for volatility of the ticker you are viewing. The ZigZag indicator can therefore be used to help visualise price legs and trends on a usually noisy looking chart.
(FEATURES)
- Toggles for pivot point label contents such as the value, the trend, or nothing at all.
- ATR and pivot point periods.
- ATR multiplier minimum threshold to plot pivots and draw lines only when this threshold is met (helps eliminate small, perhaps insignificant price movements, to have a better focus on the overall trend).
- Show the last 2 to 499 ZigZag lines.
- Uptrend, downtrend and range colors for high and low pivot labels, text labels and lines, for both confirmed and real-time plots.
- Label size, and label styles for the high and low pivots.
- Customisable width and styles (Arrow Right, Dashed, Dotted, Solid) for the ZigZag line.
In the main chart picture, labels show both the pivot point value and the trend at that point. In the picture above, on the left shows only the pivot point value, the right shows only the trend.
Picture above shows just the label with 0 contents. Also notice the last recent line being blue instead of green. This is because the current bar hasn't finished so this line is currently live and not confirmed, so is subject to change. Keep in mind even if a pivot point is confirmed, it can be updated by a subsequent higher high/lower low.
Left chart shows a minimum ATR threshold multiplier of 1x; Right chart has 2x ATR minimum threshold. Notice the left chart highlights more price legs as more price legs satisfy a less strict threshold.

SMA with ATR BandsSMA with ATR Bands
This custom indicator combines the Simple Moving Average (SMA) with Average True Range (ATR) bands. It’s designed to help traders identify potential price reversals and gauge volatility. Here’s what it does:
Simple Moving Average (SMA):
The SMA represents the average price over a specified period.
It acts as a trend-following line, smoothing out price fluctuations.
The blue line on the chart represents the SMA.
ATR Bands:
The ATR measures volatility by calculating the average range between high and low prices.
We add and subtract the ATR (multiplied by a user-defined factor) from the SMA to create the bands.
The green upper band and red lower band dynamically adjust based on volatility.
How to Use It:
Volatility Signals: When the bands are close together (a “squeeze”), it indicates low volatility. A breakout often follows.
Overbought/Oversold: Price touching the upper band suggests overbought conditions, while touching the lower band suggests oversold conditions.
Trend Confirmation: The indicator can confirm trends.
Feel free to use this indicator on TradingView to enhance your trading strategy. Remember to customize the parameters according to your preferences. Happy trading! 📈🚀
Standardized SuperTrend Oscillator
The Standardized SuperTrend Oscillator (SSO) is a versatile tool that transforms the SuperTrend indicator into an oscillator, offering both trend-following and mean reversion capabilities. It provides deeper insights into trends by standardizing the SuperTrend with respect to its upper and lower bounds, allowing traders to identify potential reversals and contrarian signals.
Methodology:
Lets begin with describing the SuperTrend indicator, which is the fundamental tool this script is based on.
SuperTrend:
The SuperTrend is calculated based on the average true range (ATR) and multiplier. It identifies the trend direction by placing a line above or below the price. In an uptrend, the line is below the price; in a downtrend, it's above the price.
pine_st(float src = hl2, float factor = 3., simple int len = 10) =>
float atr = ta.atr(len)
float up = src + factor * atr
up := up < nz(up ) or close > nz(up ) ? up : nz(up )
float lo = src - factor * atr
lo := lo > nz(lo ) or close < nz(lo ) ? lo : nz(lo )
int dir = na
float st = na
if na(atr )
dir := 1
else if st == nz(up )
dir := close > up ? -1 : 1
else
dir := close < lo ? 1 : -1
st := dir == -1 ? lo : up
SSO Oscillator:
The SSO is derived from the SuperTrend and the source price. It calculates the standardized difference between the SuperTrend and the source price. The standardization is achieved by dividing this difference by the distance between the upper and lower bounds of the SuperTrend.
float sso = (src - st) / (up - lo)
Components and Features:
SuperTrend of Oscillator - An additional SuperTrend based on the direction and volatility of the oscillator, behaving as the SuperTrend OF the SuperTrend. This provides further trend analysis of the underlying broad trend regime.
Reversion Tracer - The RSI of the direction of the original SuperTrend, providing a dynamic threshold for premium and discount price areas.
float rvt = ta.rsi(dir, len)
Heikin Ashi Transform - An option to apply the Heikin Ashi transform to the source price of the oscillator, providing a smoother visual representation of trends.
Display Modes - Choose between Line mode for a standard oscillator view or Candle mode, displaying the oscillator as Heikin Ashi candles for more in-depth trend analysis.
Contrarian and Reversion Signals:
Contrarian Signals - Based on the SuperTrend of the oscillator, these signals can act as potential buy or sell indications, highlighting potential trend exhaustion or premature reversals.
Reversion Signals - Generated when the oscillator crosses above or below the Reversion Tracer, signaling potential mean reversion opportunities or trend breakouts.
Utility and Use Cases:
Trend Analysis - Utilize the SSO as a trend-following tool with the added benefits of the oscillator's SuperTrend and Heikin Ashi transform.
Valuation Analysis - Leverage the oscillator's reversion signals for identifying potential mean reversion opportunities in the market.
The Standardized SuperTrend Oscillator enhances the capabilities of the SuperTrend indicator, offering a balanced approach to both trend-following and mean reversion strategies. Its customizable options and contrarian signals make it a valuable instrument for traders seeking comprehensive trend analysis and potential reversal signals.

Average True Range - ImprovedAverage True Range - Improved is a small variation I have made to the standard ATR indicator. It will test the current ATR against the Historic Average ATR of your preference to see if the current volatility is high or low.
Once it has determined if it is high or low it will color code the circles at the top based on this information. Green means the current volatility is low and red means the current volatility is higher than the historic average.
In the settings I have also placed a couple styles, if you wish to show the ATR and Historic ATR in percent format instead of normal you can turn them on in the style settings. If you are using the percent format I recommend setting the Precision to 2-3 decimal places.
I hope you all enjoy this indicator, if you have any questions please feel free to post them in the comments.

Risk Management Tool [LuxAlgo]Good money management is one of the fundamental pillars of successful trading. With this indicator, we propose a simple way to manage trading positions. This tool shows Profit & Loss (P&L), suggests position size given a certain risk, sets stop losses and take profit levels using fixed price value/percentage/ATR/Range, and can also determine entries from crosses with technical indicators which is particularly handy if you don't want to set an entry manually.
1. Settings
Position Type: Determines if the position should be a "Long" or "Short".
Account Size: Determines the total capital of the trading account.
Risk: The maximum risk amount for a trade. Can be set as a percentage of the account size or as a fixed amount.
Entry Price: Determines the entry price of the position.
Entry From Cross: When enabled, allows to set the entry price where a cross with an external source was produced.
1.1 Stop Loss/Take Profit
Take Profit: Determines the take profit level, which can be determined by a value or percentage.
Stop Loss: Determines the stop loss level, which can be determined by a value or percentage.
2. Usage
One of the main usages of position management tools is to determine the position size to allocate given a specific risk amount and stop-loss. 2% of your capital is often recommended as a risk amount.
Our tool allows setting stop losses and take profits with different methods.
The ATR method sets the stop loss/take profit one ATR away from the entry price, with the ATR period being determined in the drop-down menu next to the selected methods. The range method works similarly but instead of using the ATR, we use a rolling range with a period determined in the drop-down menu next to the selected methods as well.
Unlike the available position management tool on TradingView, the entry can be determined from a cross between the price an an external source. The image above shows entries from the Volatility Stop indicator. This is particularly useful if you set positions based on trailing stops.

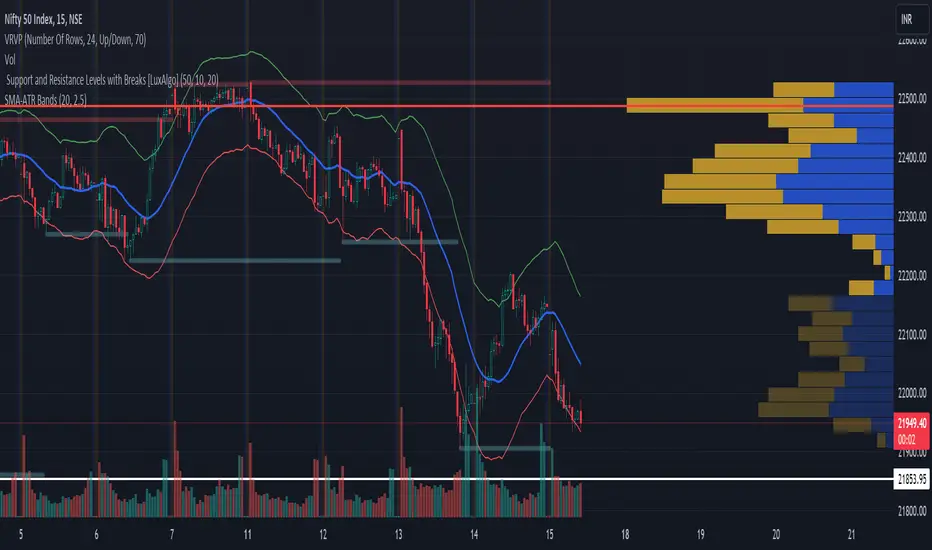
Moving Average Support and Resistance ChannelThe Moving Average Support and Resistance Channel is a channel that consists of trend lines of resistance and support of the analyzed instrument, represented as moving averages with the selected type and smoothing period on a certain timeframe, where:
- Middle Line - the middle of the channel (the moving average of the pivot point using the Floor Pivot method)
- R1 - first resistance (moving average of support + Factor*ATR)
- R2 - second resistance (R1 + Factor*ATR)
- S1 - first support (moving average of resistance-Factor*ATR)
- S2 - second support (S1-Factor*ATR)
- Factor-ATR multiplier
Despite the fact that the indicator consists of moving averages, it can work equally well both during a trend and in its absence.
Characteristics of the trend movement:
• During an uptrend, the moving averages of the indicator are directed upwards, the price is above the Middle Line level most of the time
• During a downtrend, the moving averages of the indicator are directed down, the price is below the Middle Line level most of the time
• During the flat period, the boundaries of the moving average channel narrow, the channel tends to align in a horizontal position, the price consolidates most of the time around the Middle Line level, fighting off the support and resistance levels of the indicator.
The position of asset prices outside the indicator may mean an early correction or trend reversal.
How to trade:
One of the trading methods may be that during a breakout or a pullback after a breakout of the Middle Line level, the target of further movement, depending on the direction of this movement, may be the levels R1, R2 or S1, S2. Use this situation to make a profit.
I wish you good luck in building your trading plans and remember: such indicators do not predict the future price movement on the chart, they only determine the characteristics of the price movement at the current time, taking into account historical data.

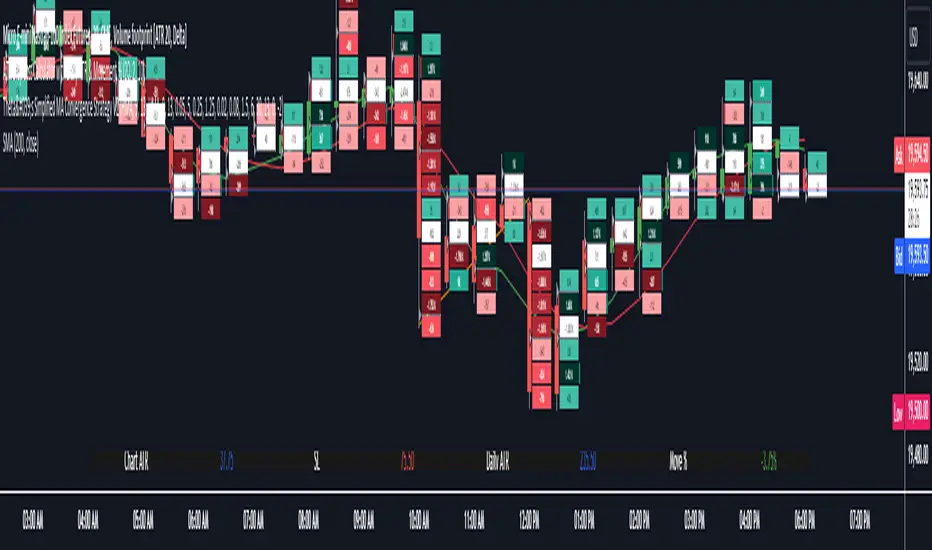
Chaikin Money Flow + MACD + ATRHere I present you on of Trade Pro's Trading Idea: Chaikin Money Flow + MACD + ATR.
This strategy is not as profitable as it can be seen in one of his videos. In the forex market, the strategy could reach a maximum of 35% profitability.
I have, as some of my followers have requested, created an overview of the current position, risk and leverage settings in the form of a table.
Furthermore, one can again swap between short and long positions.
It is now possible to select or deselect individual indicators.
I have chosen the ATR alone as a take profit stop loss, as in his strategy.
A position is only triggered as soon as all prerequisites have been fulfilled and a command is executed. This prevents false triggering by bots and repainting.
-----------------------------------------------------------------------------------
How does the strategy work?
ENTRY
Long
The MACD indicator must be above the zero line.
Then the K line must cross the D line.
Finally, when this happens, the Money Flow Index must be above the zero line.
Short
Contrary to the premise of long positions.
EXIT
ATR Exit
The value of ATR at the time of buying is multiplied by the value entered in "Profit factor ATR" and "Stop factor ATR". As soon as the price reaches this value, it is closed.
Important
The script must be optimized for each coin or currency pair.
I will publish a guide to the strategy shortly. There I will explain how the table works and how to set the strategy correctly.
The results of the strategy are without commissions and leverage.
If you have any questions or feedback, please let me know in the comments.

[JL] ATR HL CloudI am playing ATR now.
This script is made to watch ATR and highest-lowest.
ATR is calculated by max of short period and long period.
Up cloud is lowest price plus ATR * Multi
Dn cloud is highest price decrease ATR* Multi
Higher and higher cloud means up trend
Lower and lower cloud means dn trend

Baus BandsThe Baus Bands are a simplified version of another one of my trend following indicators, the Neapolitan Bands. This version only shows the trend trading zones in green and red. An additional 21 EMA with an ATR band was added as part of my own trend trading rules using these bands.
How do I read this indicator?
Is the blue band between and not touching the green or red clouds? The condition is ranging.
Is the blue band touching the green cloud? The condition is a bullish trend.
Is the blue band touching the red cloud? The condition is a bearish trend.
The trend trading rules are exactly the same as the default Neapolitans, but include an extra condition.
A trend has started once 2 conditions are met:
Price has entered either trending cloud.
The 21 EMA ATR band in blue is within the same cloud.
With those conditions met, if you expect the trend to continue, trade pull-backs to the blue band in the direction of the trending cloud.
Isn't this just a 21 EMA trading pull-backs strategy?
No. The 21 EMA alone is not sufficient in my opinion to define a range or trend technically. Always buying the 21 EMA pull-back, especially in a range, is not a great strategy by itself unless you've already identified price as trending. Baus Bands adds that trend identification.
Why make this?
Baus Bands show the conditions I personally use for catching trends and identifying ranges with these indicators, and shows only the information I use.
What's the purpose of the ATR band around the 21 EMA?
Sometimes price will open and close below the 21 EMA and cause some technical analysts will say the trend is over. I added the ATR specifically to get a volatility based, upper and lower bound range around the 21 EMA. that way I have an acceptable price range where price could move past the 21 EMA and still keep a trend valid using similar rules. I then saw that so long this ATR band (not the 21 EMA itself) was touching those trending clouds, then the trend has a good chance of continuing as long as that was true.

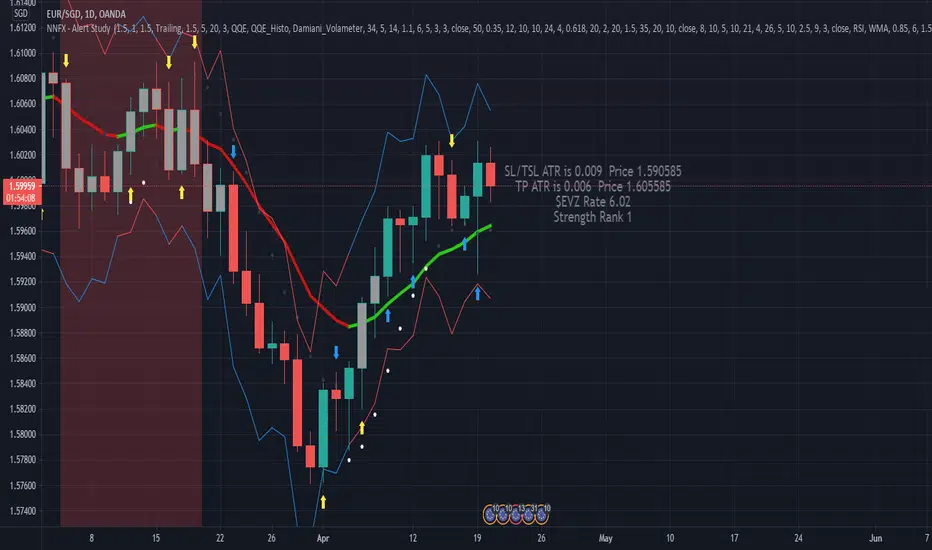
NNFX, Baseline, QQEs Fast C1, Slow C2, ATR, Volume and ExitDesigned Around the NNFX rules
Selectible Baseine
Selectible Exit Indicators
ATR bands, ATR labels for TP and TSL (1x and 1.5x ATR).
Indication (White Diamond) where candle is over 1x ATR in size.
Combined QQE Fast & Slow (C1 & C2) confirmations, Candles Grey before Trend Confirmed, change to Normal Colour when Trend established (QQE MOD used for calcualtions).
Continuations signaled by white dot above/below candle (0.9x ATR from Close Signal).
Exit Long and Exit Short signaled by Red and Blue Arrow under/above candle.
Bixord: ATR Target & StopHello Traders,
You may have heard that it's highly advised you should know where your target and stoploss points are before you enter a trade.
One of the great indicators in history is the average true range a.k.a ATR.
Here is how you can use the ATR to set your target at 1.5 x ATR and stoploss at 2 x ATR:
This indicator shows you where the 1.5 x ATR and 2 x ATR from bar close on chart instead of manually calculating it by hand.

Probability of ATR Index (On-chart) [racer8]This indicator is an on-chart version of my other indicator called Probability of ATR Index (PAI) that was published on October 16th 2020.
PAI is an indicator I created that tells you the probability of current price moving a specified ATR distance over a specified number of periods into the future. It takes into account 4 variables: the ATR & the standard deviation of price, and the 2 parameters: ATR distance and # bars (time).
The formula is very complex so I will not be able to explain it without confusion arising.
The reason I created this PAI was because the other PAI does not show you levels. This one plots the price levels that correspond to your specified ATR distance. So it makes it easier for options traders to set their strangle or condor.
Enjoy 😀

Wilder's Volatility Trailing Stop Strategy with various MA'sFor Educational Purposes. Results can differ on different markets and can fail at any time. Profit is not guaranteed.
This only works in a few markets and in certain situations. Changing the settings can give better or worse results for other markets. This strategy is based on Wilder's Volatility System. It is an ATR trailing stop that is used for long term trends. This strategy focuses on the trailing stop alone and goes long and short only when it goes above or below the trailing line. It is similar to Donchian channels except it does not include the certain period channel breakout, only the trailing signal. This is only the trailing stop and an attempt to show how well it works standalone as Wilder described.
In his book, Wilder recommends a multiplier of 2.8-3.1 and an ATR lookback of 7 periods along with a running moving average or otherwise known as Wilder's moving average. The calculation and programming part for the trailing stop varies everywhere. I opted to keep it as simple and accurate as I could think of and interpret from the book. The variations to these types of indicators are numerous unfortunately, but Wilder seems to be the original author of ATR and this ATR-based trailing stop. In his book he says to use the significant closing price or highest/lowest closing price for the calculation part but I also included the option of choosing the highest high and lowest low, and the option to choose various moving averages in case anyone wants to experiment.
Comparing this and Donchian channels, it seems that a 2.5 multiplier is somewhat similar to the middle band of DCs and a 3.0 multiplier is somewhat similar to a double length middle band of DCs. It's hard to say which is the better trailing stop for a long term strategy. It's hard to beat the simplicity of DCs but maybe some might find a need for more inputs in a trailing stop or maybe an ATR based one like Wilder's can work better depending on what setting or strategy it's used in.

Probability of ATR Index [racer8]Deriving the indicator:
PAI is an indicator I created that tells you the probability of current price moving a specified ATR distance over a specified number of periods into the future. It takes into account 4 variables: the ATR & the standard deviation of price, and the 2 parameters: ATR distance and # bars (time).
The formula is very complex so I will not be able to explain it without confusion arising.
What I can say is that I used integral calculus & the Taylor series to derive a formula that calculates the area under half of the normal distribution function. Thus, the formula was repeated twice in the code to derive the full probability (half + half = whole). If you can read the code, you might be wondering why the formula is so long...
The reason for this is because in Pine Script, the erf function doesn't exist. You see, the formula for normal distribution is: f(x) = (1/sqrt(2pi))*e^(-xx/2), assuming of course that the standard deviation = 1 and mu (mean) = 1. The next step is to take the integral of this formula in order to find the area under f(x). The problem is that I found the integral, F(x), of the normal distribution formula to be equal to F(x) = erf(x/sqrt(2))/2...and the erf function cannot be directly computed into Pinescript.
So I developed a solution...why not estimate the integral function? So that's exactly what I did using a technique involving the Taylor series. The Taylor series is an algebraic function that allows you to create a new function that can estimate the existing function. On a graph, the new function has the same values as the existing one, the only difference is that it uses a differnt formula, in this case, a formula that makes it possible to compute the integral. The disadvantage of using this new formula is that it is super long and if you want it to better represent the original integral over a wider range of x-values, you have to make it longer.
Signal Interpretion:
The hotter the colour, the more likely price will reach your specified distance.
The 2 values of PAI in the bottom window represent probability & average probability of your specifed distance geting hit.
Applications:
Stop loss placement---
This indicator is useful because it gives you an idea of the likelihood that a stop loss at a particular distance away from price (in ATRs) will be hit over a period of time specified. This is helpful in placing stop losses.
Options trading---
PAI can also be used in options trading. For example, you are using a strangle options strategy, and you want to make sure that price stays within the Strangle's profit range. So you only trade when PAI presents a low probability value of moving at a particular distance in ATRs over n periods.
Anyhow, I hope you guys like it. Enjoy! and hit that like button for me :)

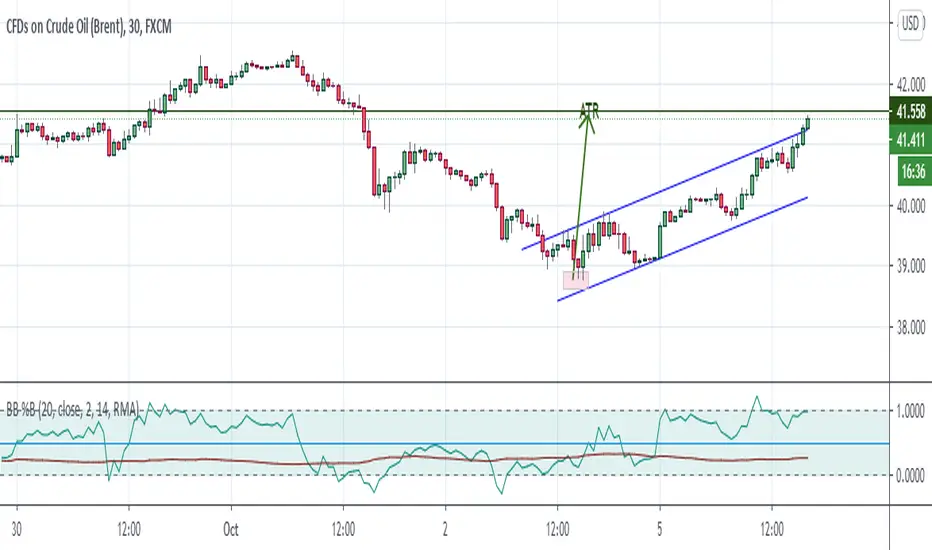
Bollinger Bands %B + ATR This indicator is best suitable for the 30-minutes interval OIL charts, due to ATR accuracy.
BB%B is great for showing oversold/overbought market conditions and offers excellent entry/exit opportunities for Day Trading (30 minutes chart), as well as reliable convergence/divergence patterns. ATR is conveniently combined and shows potential market volatility levels for the day when used in 30-minutes charts, thus demarcating your day trade exit point.
To use the ATR on this indicator: Just read the ATR value of the lowest (for a new bull trend) or the highest (for a new bear trend) candlestick of the newly formed trend leg. Let's suppose the ATR reads 0.2891, then you project a move of 2.891 points towards the given trend direction using the ruler tool (30-minutes charts). That's all, and there you have your take profit target!
Good Luck!!!
SuperTrendSuperTrend is one of the most common ATR based trailing stop indicators.
In this version you can change the ATR calculation method from the settings. Default method is RMA, when the alternative method is SMA.
The indicator is easy to use and gives an accurate reading about an ongoing trend. It is constructed with two parameters, namely period and multiplier. The default values used while constructing a superindicator are 10 for average true range or trading period and three for its multiplier.
The average true range (ATR) plays an important role in 'Supertrend' as the indicator uses ATR to calculate its value. The ATR indicator signals the degree of price volatility.
The buy and sell signals are generated when the indicator starts plotting either on top of the closing price or below the closing price. A buy signal is generated when the ‘Supertrend’ closes above the price and a sell signal is generated when it closes below the closing price.
It also suggests that the trend is shifting from descending mode to ascending mode. Contrary to this, when a ‘Supertrend’ closes above the price, it generates a sell signal as the colour of the indicator changes into red.
A ‘Supertrend’ indicator can be used on equities, futures or forex, or even crypto markets and also on daily, weekly and hourly charts as well, but generally, it fails in a sideways-moving market.
I had converted Supertrend indicator code for various platforms like Metastock in 2017, but in this TradingView version special credit goes to everget - Alex Orekhov which gave a great inspiration to look my indicators better with highlights, signals and alarms. Thank you Alex.