ATR_InfoWhat Is the Average True Range (ATR)?
The average true range (ATR) is a technical analysis indicator, introduced by market technician J. Welles Wilder Jr. in his book New Concepts in Technical Trading Systems, that measures market volatility by decomposing the entire range of an asset price for that period.
Each instrument per unit of time passes its average value of the true range, but there are moments when the volatility explodes or abruptly decays, these phenomena introduce large distortions into the average value of the true range.
The ATR_WPB function calculates the average value of the true range for the specified number of bars, while excluding paranormally large and paranormally small bars from the calculation of the average.
For example, if the instrument has passed a small ATR value, then it has many chances to continue moving, but if the instrument has passed its ATR value, then the chances of continuing to move are extremely low.
Library "ATR_Info"
ATR_Info: Calculates ATR without paranormal bars
ATR_WPB(source, period, psmall, pbig)
ATR_WPB: Calculates ATR without paranormal bars
Parameters:
source (float) : ATR_WPB: (series float) The sequence of data on the basis of which the ATP calculation will be made
period (int) : ATR_WPB: (int) Sequence size for ATR calculation
psmall (float) : ATR_WPB: (float) Coefficient for paranormally small bar
pbig (float) : ATR_WPB: (float) Coefficient for paranormally big bar
Returns: ATR_WPB: (float) ATR without paranormal bars
In den Scripts nach "atr" suchen

FBMAEN:
TradingView indicator for FBMA strategy
People oftem ask: “Dmitry, BABA, TSLA, AAPL flies like a rocket! Well, what are we buying!?” - And I say no, the price does not act like a straight rocket upwards or downwards, instead it breathes, inhales moving away from the moving average and exhales returning to it, so we will wait for the first pullback and buy exactly at the value of the moving average.
Your new paradigm: wait for the stock to pull back to the moving average rather than chasing the price
And one more thing... Remember, you don't want to buy a stock when it's going down, you'll start to have doubts. it's against human nature to go long when the price is falling, but that's why this strategy works so well. We buy on the price rollback (pullback to the moving average), but we DO IT WHILE FOLLOWING THE TREND.
The biggest consequence of this strategy, my author's FBMA strategy and this is a game changer (results are in the comments).
So, let's dive into FBMA indicator settings:
Main settings
ATR Period — Period of intergrated ATR Indicator(shows ATR in a small dashboard);
Settings of Moving Averages
Sign Moving Averages? — shows values of moving averages near their lines on the chart;
Fix MAs' signatures overlapping? — automatically MAs' signatures overlapping (specifically for SMAs and EMAs!) ;
Fix MAs' signatures overlapping between SMAs and EMAs? — automatically group overlapping between EMAs' and SMAs' signatures;
Min distance between MAs' signatures (in % of ATR) — minimal distance between MAs' signatures that indicator will push away MAs' signatures from each other if they are overlapped;
Dashboard
Dashboard position — position of dashboard on the chart ( 9 options ).
Settings of MAs
Source;
Period;
Option for showing EMA and/or SMA of chosen period and source;
Line colour ;
Signature colour .
Addons
Show data by selected timeframe? — shows difference of current price opening and opening a "timeframe" time ago;
Shows MAs only if asset has grown by selected growth % in selected timeframe?
Growth, % — percent, which asset has to gain in order for MAs to be plotted;
Timeframe — frequency with which price's current and previous opening are being will be compared;
Show analog MAs' signatures? — shows MAs' value in a small table;
Show cloud between 1st and 2nd MAs? — shows cloud for both EMAs and SMAs simultaneously).
Price Action
This settings are intuitively understandable
Feel free to leave your questions or suggestions in the comments!
* Price Action-section was taken from ChrisMoody's CM_Price_Action and rebuilt.
RU:
Индикатор TradingView для стратегии ПООС
Мне часто пишут в личку: “Дмитрий, BABA, TSLA , AAPL летит ракетой! Ну что покупаем!?”- А я говорю нет, цена не летит по прямой ракетой вверх, она дышит, делает вдохи отдаляясь от скользящей и выдохи возвращаясь к ней, поэтому мы дождёмся первого пуллбэка и купим точно на значении скользящей
Ваша новая парадигма: ждать акцию на пуллбэке к скользящей по тренду, а не гнаться за ценой
И ещё… Помните, вы не захотите покупать акцию в момент, когда она падает, вы начнете сомневаться т.к. это против человеческой природы заходить в лонг при падении цены, но именно поэтому эта стратегия работает так эффективно, т.к. мы покупаем на откате цены (пуллбэке к скользящей), но ПО ТРЕНДУ
Самое большее следствие из этой стратегии, моя авторская стратегия ПООС и это гейм-чейнджер (результаты в комментариях).
Итак, давайте посмотрим сами настройки индикатора:
Основные настройки
ATR Period — период интегрированного индикатора ATR (показывает ATR на небольшой панели);
Настройки скользящих средних
Sign Moving Averages? — показывает значения скользящих средних рядом с их линиями на графике;
Исправить перекрытие сигнатур МА? — автоматически сигнатуры СС перекрываются (специально для SMA и EMA!) ;
Исправить перекрытие сигнатур МА между SMA и EMA? — автоматически группировать перекрытие между сигнатурами EMA и SMA;
Минимальное расстояние между сигнатурами скользящих средних (в % от ATR) — минимальное расстояние между сигнатурами скользящих средних, при котором индикатор будет отталкивать сигнатуры скользящих средних друг от друга, если они перекрываются;
Панель управления
Dashboard position — положение таблицы на графике ( 9 вариантов ).
Настройки МА
Source;
Период;
Опция отображения EMA и/или SMA выбранного периода и source;
Цвет линии ;
Цвет подписи .
Дополнения
Показать данные по выбранному таймфрейму? — показывает разницу текущей цены открытия и цены открытия в прошлом, по времени равному величины параметра "Таймфрейм";
Показывает MA только в том случае, если актив вырос на выбранный % роста за выбранный период времени?
Прирост, % — процент, на который актив должен набраться, чтобы скользящие средние были построены;
Таймфрейм — частота, с которой будет сравниваться текущее и предыдущее открытие цены;
Показать сигнатуры аналоговых МА? — показывает значение МА в небольшой таблице;
Показать облако между 1-й и 2-й скользящими средними? — показывает облако для EMA и SMA одновременно).
Price Action
Эти настройки будут интуитивно понятны
Оставляете свои вопросы и предложения в комментариях, всё учтём!
* Price Action-section was taken from ChrisMoody's CM_Price_Action and rebuilt.

Spinn ATR tableThe table contains summary data on the ATR from different timeframes and for different periods. You can view both absolute values and the percentage of the average price move to the current price.
This data can be used to compare the ATR on different timeframes. And, most importantly, you can compare the ATR of different coins.
In addition, the last column shows the average deviation of the ATR for each of the timeframes. You can compare these values on different coins to determine which ones are more volatile .
Note.
Using the indicator on different timeframes may give slightly different values due to the difference in the stored data for these timeframes.
--
В таблице собраны сводные данные по ATR с разных таймфреймов и за разные периоды. Можно просматривать как абсолютные значения, так и процентное соотношение среднего хода цены к текущей цене.
Эти данные можно использовать, чтобы сравнить ATR на разных таймфреймах. И, самое главное, можно сравнивать ATR разных монет.
Кроме того, в последней колонке указано среднее отклонение ATR по каждому из таймфреймов. Можно сравнивать эти значения на разных монетах, чтобы определить - какие из них более волатильны .
Примечание.
Использование индикатора на разных таймфреймах может давать слегка разные значения из-за разницы в хранимых данных для этих таймфреймов.

[CP]Pivot Boss Floor Pivots with ATR Dilation and Dynamic LevelsINTRODUCTION:
Compared to all the Pivot Indicators available on Trading View Public Library, this Floor Pivots Indicator differentiates itself in two major original ways:
Dilates the Pivot Support/Resistance Levels into Support/Resistance Bands based on volatility
Displays the S/R Levels Dynamically , that is, only those levels will be shown that are close enough to the price resulting in much cleaner looking charts.
There were a few features whose logic I had figured out, but I could not implement them due Pine Script’s Limitation (they should really work on increasing Pine Script’s capacity instead of adding more and more features to the language in order to make it look ‘better’):
Showing multiple timeframe pivots at the same time (not possible due to Pine Script’s limitation on the ‘Max Number of Outputs’ )
Automatic Detection of highly profitable Double Hot Pivot Zones (DPZ), also due to the ‘Max Number of Outputs’ limit
GENERAL USER INPUTS:
Most of the settings are self-explanatory, however, a few of them need some explanation:
Show Floor Pivots Dynamically – This will turn ON the dynamic pivot levels, please note that this function will work ONLY IN INTRADAY timeframes.
Dynamic Pivot ATR Period – Period over which the ATR value is calculated to show the pivots dynamically.
ATR Threshold for Dynamic Floor Pivots – Simply put, the indicator will start displaying Pivot Levels if they fall within the 2*ATR distance (default value) of the price. You can increase this number if the volatility increases and vice-versa.
Use ATR to Dilate Intraday Pivot Levels – This will turn ON Floor Pivot Dilation, turning pivot ‘lines’ into ‘bands’ .
ATR Dilation Factor – This number decides the width of the Pivot bands. Larger this number, thicker the bands. Typically, high volatility stocks will require a higher number.
ATR Period – Same as Dynamic Pivot ATR Period, but for Pivot Level Dilation.
INDICATOR USAGE EXAMPLES:
This indicator works great in conjunction with my Pivot Boss Candlestick Scanner indicator.
There are a lot of optimizations I have done in the code, although it looks trivial at first glance, but it's fairly complex.
Feel free to use it and modify it as you wish.
Here are a few examples where the indicator has shown great entries and exits, with the default settings:
NIFTY 5m Chart
Reliance 5m Chart
Tesla 5m Chart
Bitcoin-USDT 15m Chart
FINAL WORDS:
Please understand that I have Cherry Picked the examples to showcase the capability of the indicator and its usage.
DO NOT conflate the accuracy of examples with the accuracy of this indicator.
Once you start using floor pivots, you will realize that a lot of days simply don’t give any high probability setups and you will simply sit out of the market and do nothing (which is a good thing).
If you really want to learn how to use Pivots, read the book ’Secrets of a Pivot Boss’ . This book can change your life.

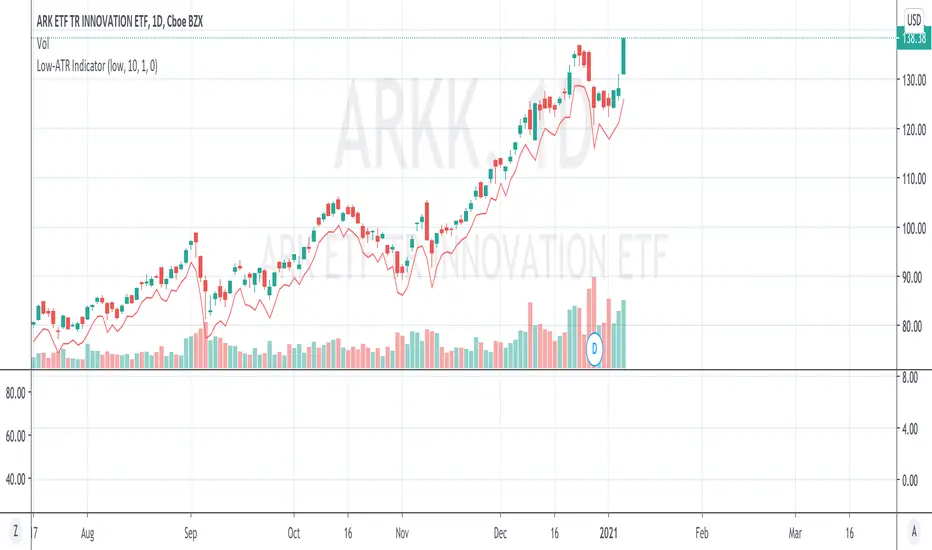
Low-ATR IndicatorWe often want to use a stop loss at a certain low - N*ATR,
But it is too troublesome to manually calculate a certain day low - ATR.
This indicator simply calculates it for you, by marking the value of day low - ATR.
By default the hardcoded ATR value is 0, which means "Uses the ATR at that day with configured look back period".
If you want to use a specific ATR value, e.g.
1) You want to set the stop loss using today's ATR but another day's day low (Very often)
2) You want to set the stop loss in another timeframe - N*ATR
You can type in the value of ATR into the "hardcoded ATR" field.
(Actually this should be the most used way)
KCP ATR + EMA Bands [Dr. K. C. Prakash]📊 KCP ATR + EMA Bands
KCP ATR + EMA Bands is a trend-responsive volatility channel indicator that combines the Exponential Moving Average (EMA) with Average True Range (ATR) to identify trend direction, dynamic support & resistance, trade zones, and extreme price conditions.
It is designed for intraday, swing, and positional trading, especially in indices, futures, and high-liquidity stocks.
🔧 How the Indicator Works
1️⃣ EMA – Trend Anchor
The EMA (default: 21) acts as the core trend line:
Price above EMA → bullish bias
Price below EMA → bearish bias
2️⃣ ATR – Volatility Engine
The ATR measures real-time volatility and expands or contracts the bands automatically:
High volatility → wider bands
Low volatility → tighter bands
This makes the indicator adaptive, unlike fixed-width channels.
3️⃣ Inner Bands – Trade Zones
Constructed using ATR × 1.0
Represent high-probability pullback and continuation zones
Useful for:
Pullback entries
Trend continuation trades
Mean-reversion setups within trend
4️⃣ Outer Bands – Extreme Zones
Constructed using ATR × 2.0
Represent price extremes
Ideal for:
Profit booking
Reversal watch zones
Stop-loss reference levels
🎨 Visual Design (Professional)
🟢 Green bands → bullish zones & support
🔴 Red bands → bearish zones & resistance
⚪ Gray EMA → neutral trend reference
Clean fills help identify bullish and bearish pressure zones without clutter.
📈 Trading Applications
✔ Trend Trading
Buy on pullbacks near lower inner band when price is above EMA
Sell on pullbacks near upper inner band when price is below EMA
✔ Breakout Trading
Strong closes beyond inner bands indicate momentum expansion
Breaks beyond outer bands signal exhaustion or strong continuation
✔ Risk Management
Inner bands → trailing stop reference
Outer bands → hard stop or target zones
⏱️ Best Timeframes
5m / 15m → Intraday trading
30m / 1H → Swing trading
Daily → Positional trading
🏆 Why This Indicator Stands Out
✔ Combines trend + volatility in one tool
✔ Adaptive to market conditions
✔ Reduces noise compared to fixed bands
✔ Clear visual guidance for entries, exits & risk
✔ Works across asset classes
⚠️ Important Note
This indicator performs best in trending or expanding volatility markets.
Always confirm trades with price action, volume, or higher-timeframe bias.

RSI Driven ATR Trend [NeuraAlgo]
RSI Driven ATR Trend
Dynamic Trend Detection and Strength Analysis
Unlock the market’s hidden rhythm with the RSI Driven ATR Trend , a sophisticated tool designed to measure trend direction and strength using a combination of RSI momentum and ATR-based volatility . This indicator provides real-time insights into bullish and bearish phases, helping traders identify potential turning points and optimize entry and exit decisions.
1.Core In Logic:
Dynamically calculates trend levels based on RSI and ATR interactions.
Highlights trend direction with intuitive color coding: green for bullish, red for bearish.
Displays trend strength as a percentage to quantify momentum intensity.
Automatic visual cues for potential trend reversals with “Turn Up” and “Turn Down” labels.
Advanced smoothing and dynamic gating ensure responsive yet stable trend detection.
Compatible with all timeframes and instruments.
2.Inputs Explained:
Rsi Factor: Adjusts the sensitivity of the RSI in trend calculation. Higher values make the trend detection more responsive to momentum changes.
Multiplier: Multiplies the effect of Rsi Factor to fine-tune trend responsiveness.
Bar Back: Number of bars used for peak and dip calculations, determining how far back the indicator looks for trend changes.
Period: Lookback period used in trend gating and ATR calculations.
Source: Price source for calculations (default is close).
Main Colors: Customize bullish and bearish trend colors.
3.How it Works:
The indicator calculates RSI values and ATR-based dynamic ranges to determine upper and lower trend levels.
Trend direction is determined by price crossing above (bullish) or below (bearish) the dynamic trend line.
Trend strength is expressed as a percentage relative to the trend line, helping you assess momentum intensity.
Visual cues like "Turn Up" and "Turn Down" labels indicate potential trend reversals.
Bars are colored dynamically based on trend direction for quick interpretation.
Ideal for traders seeking a clear, actionable view of market trends without the clutter of multiple indicators. RSI Driven ATR Trend translates complex price behavior into an easy-to-read visual guide, helping you make smarter trading decisions.
Happy Trading!

SVE Daily ATR + SDTR Context BandsSVE Daily ATR + SDTR Context Bands is a free companion overlay from The Volatility Engine™ ecosystem.
It plots daily ATR-based expansion levels and a Standardized Deviation Threshold Range (SDTR) to give traders a clean, quantitative view of where intraday price sits relative to typical daily movement and volatility extremes.
This module is designed as an SVE-compatible context layer—using discrete, RTH-aligned daily zones, expected-move bands, and a standardized volatility shell—so traders can build situational awareness even without the full SPX Volatility Engine™ (SVE).
It does not generate trade signals.
Its sole purpose is to provide a clear volatility framework you can combine with your own structure, Fibonacci, or signal logic (including SVE, if you use it).
🔍 What It Shows
* Daily ATR Bands (expHigh / expLow)
- Expected high/low based on smoothed daily ATR
- Updates at the RTH open
* Daily SDTR Bands (expHighSDTR / expLowSDTR)
- Standard deviation threshold range for volatility extremes
- Helps identify overextended conditions
Discrete RTH-aligned Zones
- Bands reset cleanly at each RTH session
No continuous carry-over from prior days
Daily ATR & SDTR stats label
Quick-reference box showing current ATR and SDTR values
🎯 Purpose
This tool helps traders:
- Gauge intraday context relative to expected daily movement
- Assess volatility state (quiet, normal, expanded, extreme)
- Identify likely exhaustion or expansion zones
- Frame intraday price action inside daily volatility rails
- Support decision-making with objective context rather than emotion
It complements any strategy and works on any intraday timeframe.
⚙️ Inputs
- ATR Lookback (default: 20 days)
- RTH Session Times
- SDTR Lookback
- Show/Hide Daily Stats Label
🧩 Part of the SVE Ecosystem
This module is part of the broader SPX Volatility Engine™ framework.
The full SVE system includes:
- Composite signal scoring
- Volatility compression logic
- Histogram slope and momentum analysis
- Internals (VIX / VVIX / TICK)
- Structural zone awareness
- Real-time bias selection
- High-clarity decision support
⚠️ Disclaimer
This tool is provided for educational and informational purposes only.
No performance claims are made or implied.
Not investment advice.

Baseline Deviation Oscillator [Alpha Extract]A sophisticated normalized oscillator system that measures price deviation from a customizable moving average baseline using ATR-based scaling and dynamic threshold adaptation. Utilizing advanced HL median filtering and multi-timeframe threshold calculations, this indicator delivers institutional-grade overbought/oversold detection with automatic zone adjustment based on recent oscillator extremes. The system's flexible baseline architecture supports six different moving average types while maintaining consistent ATR normalization for reliable signal generation across varying market volatility conditions.
🔶 Advanced Baseline Construction Framework
Implements flexible moving average architecture supporting EMA, RMA, SMA, WMA, HMA, and TEMA calculations with configurable source selection for optimal baseline customization. The system applies HL median filtering to the raw baseline for exceptional smoothing and outlier resistance, creating ultra-stable trend reference levels suitable for precise deviation measurement.
// Flexible Baseline MA System
ma(src, length, type) =>
if type == "EMA"
ta.ema(src, length)
else if type == "TEMA"
ema1 = ta.ema(src, length)
ema2 = ta.ema(ema1, length)
ema3 = ta.ema(ema2, length)
3 * ema1 - 3 * ema2 + ema3
// Baseline with HL Median Smoothing
Baseline_Raw = ma(src, MA_Length, MA_Type)
Baseline = hlMedian(Baseline_Raw, HL_Filter_Length)
🔶 ATR Normalization Engine
Features sophisticated ATR-based scaling methodology that normalizes price deviations relative to current volatility conditions, ensuring consistent oscillator readings across different market regimes. The system calculates ATR bands around the baseline and uses half the band width as the normalization factor for volatility-adjusted deviation measurement.
🔶 Dynamic Threshold Adaptation System
Implements intelligent threshold calculation using rolling window analysis of oscillator extremes with configurable smoothing and expansion parameters. The system identifies peak and trough levels over dynamic windows, applies EMA smoothing, and adds expansion factors to create adaptive overbought/oversold zones that adjust to changing market conditions.
1D
3D
1W
🔶 Multi-Source Configuration Architecture
Provides comprehensive source selection including Close, Open, HL2, HLC3, and OHLC4 options for baseline calculation, enabling traders to optimize oscillator behavior for specific trading styles. The flexible source system allows adaptation to different market characteristics while maintaining consistent ATR normalization methodology.
🔶 Signal Generation Framework
Generates bounce signals when oscillator crosses back through dynamic thresholds and zero-line crossover signals for trend confirmation. The system identifies both standard threshold bounces and extreme zone bounces with distinct alert conditions for comprehensive reversal and continuation pattern detection.
Bull_Bounce = ta.crossover(OSC, -Active_Lower) or
ta.crossover(OSC, -Active_Lower_Extreme)
Bear_Bounce = ta.crossunder(OSC, Active_Upper) or
ta.crossunder(OSC, Active_Upper_Extreme)
// Zero Line Signals
Zero_Cross_Up = ta.crossover(OSC, 0)
Zero_Cross_Down = ta.crossunder(OSC, 0)
🔶 Enhanced Visual Architecture
Provides color-coded oscillator line with bullish/bearish dynamic coloring, signal line overlay for trend confirmation, and optional cloud fills between oscillator and signal. The system includes gradient zone fills for overbought/oversold regions with configurable transparency and threshold level visualization with automatic label generation.
snapshot
🔶 HL Median Filter Integration
Features advanced high-low median filtering identical to DEMA Flow for exceptional baseline smoothing without lag introduction. The system constructs rolling windows of baseline values, performs median extraction for both odd and even window lengths, and eliminates outliers for ultra-clean deviation measurement baseline.
🔶 Comprehensive Alert System
Implements multi-tier alert framework covering bullish bounces from oversold zones, bearish bounces from overbought zones, and zero-line crossovers in both directions. The system provides real-time notifications for critical oscillator events with customizable message templates for automated trading integration.
🔶 Performance Optimization Framework
Utilizes efficient calculation methods with optimized array management for median filtering and minimal computational overhead for real-time oscillator updates. The system includes intelligent null value handling and automatic scale factor protection to prevent division errors during extreme market conditions.
🔶 Why Choose Baseline Deviation Oscillator ?
This indicator delivers sophisticated normalized oscillator analysis through flexible baseline architecture and dynamic threshold adaptation. Unlike traditional oscillators with fixed levels, the BDO automatically adjusts overbought/oversold zones based on recent oscillator behavior while maintaining consistent ATR normalization for reliable cross-market and cross-timeframe comparison. The system's combination of multiple MA type support, HL median filtering, and intelligent zone expansion makes it essential for traders seeking adaptive momentum analysis with reduced false signals and comprehensive reversal detection across cryptocurrency, forex, and equity markets.

ETH Short-Term VWAP+EMA/RSI (ATR Risk, <1h) (James Logan)ETH Short-Term VWAP + EMA / RSI Strategy (ATR-based Risk Control)
A short-term (< 1 hour) ETH trading system designed for intraday scalps and momentum swings on 5- to 15-minute charts.
It blends trend confirmation (EMA 50 / 200) with intrabar structure (EMA 21 pullback & VWAP filter) and RSI momentum triggers, managing exits dynamically through ATR-based stop, take-profit, and trailing stop targets.
Core logic
• Long when RSI crosses above the threshold within an up-trend (EMA 50 > EMA 200) and price is above VWAP.
• Short when RSI crosses below threshold within a down-trend (EMA 50 < EMA 200) and price is below VWAP.
• Optional pullback confirmation to the 21-EMA for cleaner entries.
• Risk defined by ATR-multiples for stop-loss, take-profit, and an adaptive trailing stop.
• Automatic flat-out exit after a set number of bars (time-based close).
Best use
• 5 min – 15 min ETH/USDT charts (Binance, Bybit, Coinbase, etc.)
• Works with both spot and perpetual data.
• Tune ATR and RSI thresholds per venue; defaults are balanced for 0.05 % per-side fees.
Key parameters
• ATR SL × 1.6 ATR TP × 2.2 ATR Trail × 2.0
• RSI 50 cross | EMA 50/200 trend filter | VWAP confirmation
• Default position sizing = USD-based (e.g. $1 000 per trade).
Notes
• All orders and exits are simulated at bar close; use 1-minute bar magnifier for finer fill modeling.
• No repainting—uses only confirmed bar data.
• Best validated with ≥ 200 trades and profit factor > 1.25 over multi-month backtests.

Renko ATR Trend + SMA Indicator by YCGH Capital🧭 Overview
The Renko ATR Trend + SMA Indicator is a trend-following tool designed for chart trading.
It combines Renko-style price movement logic (based on ATR) with a Simple Moving Average (SMA) filter to identify sustained bullish or bearish phases on any timeframe.
It plots a color-coded trend line directly on the price chart — green for bullish trends, red for bearish — and maintains a single active state (no repeated buy/sell signals) until the opposite condition appears.
⚙️ How It Works
1️⃣ Renko ATR Engine
Instead of using fixed box sizes like classic Renko charts, this indicator builds synthetic Renko movement based on ATR (Average True Range) of a chosen timeframe.
It pulls OHLC data from your selected Renko Source Timeframe (for example, 60-minute candles).
It calculates an ATR brick size — representing the minimum price move needed for a new Renko brick.
When price moves by at least one ATR in the opposite direction, it flips the trend.
This filters out small fluctuations and captures the underlying directional bias.
2️⃣ SMA Filter
A Simple Moving Average (SMA) acts as a trend confirmation filter.
Only when Renko direction aligns with the price relative to the SMA, a trend signal activates.
BUY → Renko uptrend + price above SMA
SELL → Renko downtrend + price below SMA
3️⃣ Stateful Signal Logic
Unlike typical indicators that spam multiple buy/sell shapes:
This version holds one persistent signal (Buy or Sell)
The state continues until an opposite signal is confirmed
No “continuation” arrows — clean and minimal trend visualization
🎨 Visuals
Element Meaning
🟩 Green Renko Line Active Bullish Trend
🟥 Red Renko Line Active Bearish Trend
⚪ Gray Line Neutral / Waiting phase
🟡 Yellow Line SMA (trend filter)
📍 Label (Buy Active / Sell Active) Displays the current market bias
🔧 Inputs
Input Description
Renko Source Timeframe The timeframe from which Renko data is calculated (e.g., 60 = 1h candles).
ATR Period Determines brick size sensitivity (lower = more responsive, higher = smoother).
SMA Length Moving Average length used as a directional filter.
💡 How Traders Use It
Trend Confirmation:
Use green/red Renko line to stay aligned with the dominant market move.
Entry Timing:
Enter trades when a new Renko direction is confirmed along with SMA alignment.
Exit or Reverse:
Exit long when a red line (Sell Active) appears, and vice versa.
Combine with Price Action:
Add support/resistance or volume analysis for confirmation.

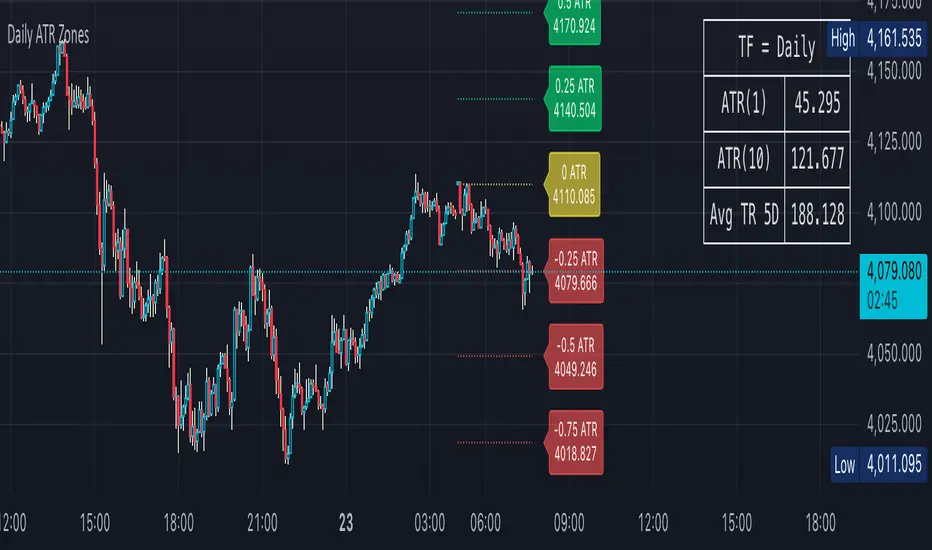
Daily ATR Zones
Dynamic Daily ATR Projection Zones
### **Description:**
This indicator projects potential price levels for the current trading day based on the Average True Range (ATR) of the previous day. It is designed to help intraday traders visualize daily volatility and identify key potential support, resistance, or target levels that are fixed for the entire session and do not repaint.
**How It Works**
The logic is based on two key components: a stable base price and a reliable volatility measure.
* **Base Price:** The indicator uses the **Open price of the current day** as the central anchor point for all projections.
* **Volatility Measure:** The calculation uses the final, completed **ATR value from the previous day**. This ensures that the projected zones are constant throughout the current trading day and are not subject to repainting.
The projection levels are then calculated using the formula:
`Current Day's Open + (Previous Day's ATR * Multiplier)`
**Features**
This script is fully customizable to fit your trading style:
* **Customizable ATR Multipliers:** Easily define your own price zones by entering a comma-separated list of multipliers (e.g., `0.5, 1.0, 1.5, -0.5, -1.0`).
* **Dynamic & Movable Labels:** The price labels are designed to stay on the right edge of the chart, ensuring they never obscure the current price action.
* **Adjustable Label Position:** Use the "Label Horizontal Offset" setting to control how far the labels are positioned from the current bar, keeping your chart clean.
* **Adjustable Label Size:** Choose from five different sizes (Tiny, Small, Normal, Large, Huge) to ensure the labels are perfectly readable on any device.
* **Toggle Labels:** You can turn all labels on or off with a single checkbox.
* **Full Color Customization:** Set unique colors for the positive (upper), negative (lower), and neutral projection zones.
**How to Use**
This tool can be integrated into various intraday trading strategies:
* **Intraday Targets:** The projected levels can serve as potential take-profit or stop-loss targets for scalpers and day traders.
* **Support & Resistance:** Watch for price reactions, such as bounces or rejections, at these ATR levels, as they often act as dynamic support and resistance zones.
* **Volatility Gauge:** The zones provide a quick visual reference for how far the price has moved relative to its recent average daily range. For example, if the price reaches the `1.0 ATR` level, it has completed an "average" day's move.
Volume Percentile Supertrend [BackQuant]Volume Percentile Supertrend
A volatility and participation aware Supertrend that automatically widens or tightens its bands based on where current volume sits inside its recent distribution. The goal is simple: fewer whipsaws when activity surges, faster reaction when the tape is quiet.
What it does
Calculates a standard Supertrend framework from an ATR on a volume weighted price source.
Measures current volume against its recent percentile and converts that context into a dynamic ATR multiplier.
Widens bands when volume is unusually high to reduce chop. Tightens bands when volume is unusually low to catch turns earlier.
Paints candles, draws the active Supertrend line and optional bands, and prints clear Long and Short signal markers.
Why volume percentile
Fixed ATR multipliers assume all bars are equal. They are not. When participation spikes, price swings expand and a static band gets sliced.
Percentiles place the current bar inside a recent distribution. If volume is in the top slice, the Supertrend allows more room. If volume is in the bottom slice, it expects smaller noise and tightens.
This keeps the same playbook usable across busy sessions and sleepy ones without constant manual retuning.
How it works
Volume distribution - A rolling window computes the Pth percentile of volume. Above that is flagged as high volume. A lower reference percentile marks quiet bars.
Dynamic multiplier - Start from a Base Multiplier. If bar is high volume, scale it up by a function of volume-to-average and a Sensitivity knob. If bar is low volume, scale it down. Smooth the result with an EMA to avoid jitter.
VWMA source - The price input for bands is a short volume weighted moving average of close. Heavy prints matter more.
ATR envelope - Compute ATR on your length. UpperBasic = VWMA + Multiplier x ATR. LowerBasic = VWMA - Multiplier x ATR.
Trailing logic - The final lines trail price so they only move in a direction that preserves Supertrend behavior. This prevents sudden flips from transient pokes.
Direction and signals - Direction flips when price crosses through the relevant trailing line. SupertrendLong and SupertrendShort mark those flips. The plotted Supertrend is the active trailing side.
Inputs and what they change
Volume Lookback - Window for percentile and average. Larger window = stabler percentile, smaller = snappier.
Volume Percentile Level - Threshold that defines high volume. Example 70 means top 30 percent of recent bars are treated as high activity.
Volume Sensitivity - Gain from volume ratio to the dynamic multiplier. Higher = bands expand more when volume spikes.
VWMA Source Length - Smoothing of the volume weighted price source for the bands.
ATR Length - Standard ATR window. Larger = slower, smaller = quicker.
Base Multiplier - Core band width before volume adjustment. Think of this as your neutral volatility setting.
Multiplier Smoothing - EMA on the dynamic multiplier. Reduces back and forth changes when volume oscillates around the threshold.
Show Supertrend on chart - Toggles the active line.
Show Upper Lower Bands - Draws both sides even when inactive. Good for context.
Paint candles according to Trend - Colors bars by trend direction.
Show Long and Short Signals - Prints 𝕃 and 𝕊 markers at flips.
Colors - Choose your long and short palette.
Reading the plot
Supertrend line - Thick line that hugs price from above in downtrends and from below in uptrends. Its distance breathes with volume.
Bands - Optional upper and lower rails. Useful to see the inactive side and judge how wide the envelope is right now.
Signals - 𝕃 prints when the trend flips long. 𝕊 prints when the trend flips short.
Candle colors - Quick bias read at a glance when painting is enabled.
Typical workflows
Trend following - Use 𝕃 flips to initiate longs and ride while bars remain colored long and price respects the lower trailing line. Mirror for shorts with 𝕊 and the upper trailing line. During high volume phases the line will give more room, which helps stay in the move.
Pullback adds - In an established trend, shallow tags toward the active line after a high volume expansion can be add points. The dynamic envelope adjusts to the session so your add distance is not fixed to a stale volatility regime.
Mean reversion filter - In quiet tape the multiplier contracts and flips come earlier. If you prefer fading, watch for quick toggles around the bands when volume percentile remains low. In high volume, avoid fading into the widened line unless you have other strong reasons.
Notes on behavior
High volume bar: the percentile gate opens, volRatio > 1 powers up the multiplier through the Sensitivity lever, bands widen, fewer false flips.
Low volume bar: multiplier contracts, bands tighten, flips can happen earlier which is useful when you want to catch regime changes in quiet conditions.
Smoothing matters: both the price source (VWMA) and the multiplier are smoothed to keep structure readable while still adapting.
Quick checklist
If you see frequent chop and today feels busy: check that volume is above your percentile. Wider bands are expected. Consider letting the trend prove itself against the expanded line before acting.
If everything feels slow and you want earlier entries: percentile likely marks low volume, so bands tighten and 𝕃 or 𝕊 can appear sooner.
If you want more or fewer flips overall: adjust Base Multiplier first. If you want more reaction specifically tied to volume surges: raise Volume Sensitivity. If the envelope breathes too fast: raise Multiplier Smoothing.
What the signals mean
SupertrendLong - Direction changed from non-long to long. 𝕃 marker prints. The active line switches to support below price.
SupertrendShort - Direction changed from non-short to short. 𝕊 marker prints. The active line switches to resistance above price.
Trend color - Bars painted long or short help validate context for entries and management.
Summary
Volume Percentile Supertrend adapts the classic Supertrend to the day you are trading. Volume percentile sets the mood, sensitivity translates it into dynamic band width, and smoothing keeps it clean. The result is a single plot that aims to stay conservative when the tape is loud and act decisively when it is quiet, without you having to constantly retune settings.

EMA21/SMA21 + ATR Bands SuiteThe EMA/SMA + ATR Bands Suite is a powerful technical overlay built around one of the most universally respected zones in trading: the 21-period moving average. By combining both the EMA21 and SMA21 into a unified framework, this tool defines the short-term mean with greater clarity and reliability, offering a more complete picture of trend structure, directional bias, and price equilibrium. These two moving averages serve as the central anchor — and from them, the script dynamically calculates adaptive ATR bands that expand and contract with market volatility. Whether you trade breakouts, pullbacks, or reversion setups, the 21 midline combined with ATR extensions offers a powerful lens for real-time market interpretation — adaptable to any timeframe or asset.
🔍 What's Inside?
✅ EMA21 + SMA21 Full Plots and Reduced-History Segments using arrays:
Enable full plots or segmented lines for the most recent candles only with automatic color coding. The reduced-history plots are perfect for reducing clutter on your chart.
✅ ATR Bands (2.5x & 5x):
Adaptive ATR-based volatility envelopes plotted around the midline (EMA21 + SMA21) to indicate:
🔸Potential reversion zones.
🔸Trend continuation breakouts.
🔸Dynamic support/resistance levels.
🔸 Expanding or contracting volatility states
🔸 Trend-aware color changes — yellow when both bands are rising, purple when falling, and gray when direction is mixed
✅ Dual MA Fills (EMA21/SMA21):
Visually track when short-term momentum shifts using a fill between EMA21 and SMA21
✅ EMA5 & EMA200 Labels:
Display anchored labels with rounded values + % difference from price, helping you track short-term + macro trends in real-time.
✅ Intelligent Bar Coloring
Bars are automatically colored based on both price direction and position relative to the EMA/SMA. This provides instant visual feedback on trend strength and structural alignment — no need to second-guess the market tone.
✅ Dynamic Close Line Tools:
Track recent price action with flexible close-following lines
✅ RSI Overlay on Candles:
Optional RSI + RSI SMA displayed above the current bar, with automatic color logic.
🎯 Use Cases
➖Trend Traders can identify when price is stacked bullishly across moving averages and breaking above ATR zones.
➖Mean Reversion Traders can fade extremes at 2.5x or 5x ATR zones.
➖Scalpers get immediate trend insight from colored bar overlays and close-following lines.
➖Swing Traders can combine multi-timeframe EMAs with volatility thresholds for higher confluence.
📌 Final Note:
As powerful as this script can be, no single indicator should be used in isolation. For best results, combine it with price action analysis, higher-timeframe context, and complementary tools like trendlines, moving averages, or support/resistance levels. Use it as part of a well-rounded trading approach to confirm setups — not to define them alone.

Ultimate ATR Extreme DetectorUltimate ATR Extreme Detector
Professional Volatility Analysis Tool for Strategic Trading
Discover Market Turning Points with Precision
Key Features
Smart Extremum Detection: Identifies when ATR reaches its highest or lowest point in your specified lookback period
Quad Visual Alert System:
▲ Green bottom triangles for low volatility signals
▼ Red top triangles for high volatility signals
Background color highlighting for instant state recognition
Status panel showing current volatility extremes
Dual Alert Modes:
TradingView native alerts ("ATR Low/High Signal")
Visual chart alerts with period details (e.g., "Alert: ATR Low (50 bars)")
4 Calculation Methods: RMA (Wilder's), SMA, EMA, and WMA
Fully Customizable:
Adjustable ATR period (default: 14)
Variable lookback window (default: 50)
Toggle features on/off via intuitive input settings
How It Works
The indicator scans volatility extremes using proprietary logic:
Calculates True Range using selected method (RMA/SMA/EMA/WMA)
Compares current ATR value against historical data
Flags critical moments when:
Volatility contracts to N-period lows (prepare for breakouts)
Volatility expands to N-period highs (watch for trend exhaustion)
Strategic Applications
markdown
复制
| SIGNAL | MARKET CONDITION | TRADING IMPLICATION |
|------------------|-----------------------|--------------------------------|
| Low Volatility | Contraction/Consolidation | Anticipate breakout moves |
| High Volatility | Expansion/Climax | Prepare for reversals or pauses |
Position Sizing: Use ATR values to determine optimal stop distances
Entry Timing: Combine with price action at key support/resistance
Risk Management: Adjust stops dynamically based on volatility regime
Optimization Guide
Day Trading: Short lookback (20-30 periods)
Swing Trading: Medium lookback (50-100 periods)
Position Trading: Long lookback (100-200 periods)
Volatility Analysis: Compare multiple timeframes simultaneously
Professional Setup Recommendations
Combine with:
Breakout Confirmation: Volume spikes, chart patterns
Reversal Signals: RSI divergence, candlestick reversals
Volatility Filters: Bollinger Band contraction, Keltner Channel breakout
Compatibility: Works flawlessly across FX, stocks, crypto, and commodities on all timeframes.
Why Traders Choose This Indicator
"Transforms complex volatility analysis into clear, actionable visual cues – the essential tool for breakout traders and risk managers alike."
Install Now to:
Spot consolidation before big moves
Identify exhaustion at trend extremes
Automate volatility-based position sizing
Receive instant alerts at critical volatility turns
Master market rhythms with professional-grade volatility intelligence!

Dynamic SL/TP Levels (ATR or Fixed %)This indicator, "Dynamic SL/TP Levels (ATR or Fixed %)", is designed to help traders visualize potential stop loss (SL) and take profit (TP) levels for both long and short positions, refreshing dynamically on each new bar. It assumes entry at the current bar's close price and uses a fixed 1:2 risk-reward ratio (TP is twice the distance of SL in the profit direction). Levels are displayed in a compact table in the chart pane for easy reference, without cluttering the main chart with lines.
Key Features:
Calculation Modes:
ATR-Based (Dynamic): SL distance is derived from the Average True Range (ATR) multiplied by a user-defined factor (default 1.5x). This adapts to the asset's volatility, providing breathing room based on recent price movements.
Fixed Percentage: SL is set as a direct percentage of the current close price (default 0.5%), offering consistent gaps regardless of volatility.
Long and Short Support: Calculates and shows SL/TP for longs (SL below close, TP above) and shorts (SL above close, TP below), with toggles to hide/show each.
Real-Time Updates: Levels recalculate every bar, making them readily available for entry decisions in your trading system.
Display: Outputs to a table in the top-right pane, showing precise values formatted to the asset's tick size (e.g., full decimal places for crypto).
How to Use:
Add the indicator to your chart via TradingView's Pine Editor or library.
Adjust settings:
Toggle "Use ATR?" on/off to switch modes.
Set "ATR Length" (default 14) and "ATR Multiplier for SL" for dynamic mode.
Set "Fixed SL %" for percentage mode.
Enable/disable "Show Long Levels" or "Show Short Levels" as needed.
Interpret the table: Use the displayed SL/TP values when your strategy signals an entry. For risk management, combine with position sizing (e.g., risk 1% of account per trade based on SL distance).
Example: On a volatile asset like BTC, ATR mode might set a wider SL for realism; on stable pairs, fixed % ensures predictability.
This tool promotes disciplined trading by tying levels to price action or fixed rules, but it's not financial advice—always backtest and use with your full strategy. Feedback welcome!

Rachas ATR AssistHey Traders!
This indicator is a simple, it uses Average True Range (ATR) data from the daily chart and the current timeframe to estimate potential range and volatility.
This indicator compares the daily ATR to the current daily wick range (from low to high), helping you gauge how much "room" might be left for price movement within the day. Alongside that, it shows the ATR over the last 14 candles and 5 candles on your current chart for intraday volatility awareness—ideal for setting stops, targets, or position sizing.
Gauge Daily Potential Movement:
The "Day Range Difference" cell shows how much of the expected daily range (based on ATR) is still unfilled. If the market has moved less than the average, there's still potential for expansion. If it's close to or above the ATR, expect a slowdown or reversal.
Position Sizing & Stop Losses:
Use the 14-period ATR and 5-period ATR on your current timeframe to understand recent volatility. This helps in choosing logical stop loss levels and adjusting position sizes based on market conditions.
Volatility Awareness:
Knowing the average daily range and how much of it has been used lets you avoid entering trades too late in the move or placing stops in overly tight spots.
Table Position & Font:
You can adjust the table location (top/bottom left/right) and font size to best fit your chart layout.

Smart Dynamic Levels [ATR-Based]Smart Dynamic Levels
Automated Support & Resistance Levels Based on Market Volatility
Overview:
This advanced indicator automatically plots dynamic support and resistance levels based on the Average True Range (ATR), creating meaningful price zones that adapt to changing market conditions. Unlike static round-number levels, these volatility-adjusted zones provide more relevant technical reference points.
Key Features:
Volatility-Responsive: Levels automatically adjust based on the asset's ATR
Smart Visualization:
Color gradient shows strength of each level (darker = stronger)
Bullish (green) levels below price, bearish (red) levels above
Customizable Settings:
Adjust ATR length (14-period default)
Modify level sensitivity with ATR multiplier (1.5x default)
Choose number of levels to display (5 above/below default)
Toggle labels and line extensions
How It Works:
Calculates the asset's true volatility using ATR
Rounds to significant price intervals based on current volatility
Plots equidistant levels above and below current price
Colors levels based on their position relative to price
Automatically updates as market conditions change
Recommended Use:
Day Trading: Identify intraday support/resistance zones
Swing Trading: Spot potential reversal areas
Breakout Trading: Watch for moves beyond key levels
Works on all markets: Stocks, Forex, Crypto, Futures
Settings Guide:
ATR Length: Higher values for smoother levels (14-20)
Multiplier: Increase for wider levels (1.5-3x)
Levels Count: More levels for higher timeframes (3-10)
Pro Tips:
Combine with trend analysis - levels are more significant when aligned with trend
Watch for price reactions at these levels for confirmation
Use wider levels (higher multiplier) for volatile assets

Adaptive Fibonacci Volatility Bands (AFVB)
**Adaptive Fibonacci Volatility Bands (AFVB)**
### **Overview**
The **Adaptive Fibonacci Volatility Bands (AFVB)** indicator enhances standard **Fibonacci retracement levels** by dynamically adjusting them based on market **volatility**. By incorporating **ATR (Average True Range) adjustments**, this indicator refines key **support and resistance zones**, helping traders identify **more reliable entry and exit points**.
**Key Features:**
- **ATR-based adaptive Fibonacci levels** that adjust to changing market volatility.
- **Buy and Sell signals** based on price interactions with dynamic support/resistance.
- **Toggleable confirmation filter** for refining trade signals.
- **Customizable color schemes** and alerts.
---
## **How This Indicator Works**
The **AFVB** operates in three main steps:
### **1️⃣ Detecting Key Fibonacci Levels**
The script calculates **swing highs and swing lows** using a user-defined lookback period. From this, it derives **Fibonacci retracement levels**:
- **0% (High)**
- **23.6%**
- **38.2%**
- **50% (Mid-Level)**
- **61.8%**
- **78.6%**
- **100% (Low)**
### **2️⃣ Adjusting for Market Volatility**
Instead of using **fixed retracement levels**, this indicator incorporates an **ATR-based adjustment**:
- **Resistance levels** shift **upward** based on ATR.
- **Support levels** shift **downward** based on ATR.
- This makes levels more **responsive** to price action.
### **3️⃣ Generating Buy & Sell Signals**
AFVB provides **two types of signals** based on price interactions with key levels:
✔ **Buy Signal**:
Occurs when price **dips below** a support level (78.6% or 100%) and **then closes back above it**.
- **Optionally**, a confirmation buffer can be enabled to require price to close **above an additional threshold** (based on ATR).
✔ **Sell Signal**:
Triggered when price **breaks above a resistance level** (0% or 23.6%) and **then closes below it**.
📌 **Important:**
- The **buy threshold setting** allows traders to **fine-tune** entry conditions.
- Turning this setting **off** generates **more frequent** buy signals.
- Keeping it **on** reduces false signals but may result in **fewer trade opportunities**.
---
## **How to Use This Indicator in Trading**
### 🔹 **Entry Strategy (Buying)**
1️⃣ Look for **buy signals** at the **78.6% or 100% Fibonacci levels**.
2️⃣ Ensure price **closes above** the support level before entering a long trade.
3️⃣ **Enable or disable** the buy threshold filter depending on desired trade strictness.
### 🔹 **Exit Strategy (Selling)**
1️⃣ Watch for **sell signals** at the **0% or 23.6% Fibonacci levels**.
2️⃣ If price **breaks above resistance and then closes below**, consider exiting long positions.
3️⃣ Can be used **alone** or **combined with trend confirmation tools** (e.g., moving averages, RSI).
### 🔹 **Using the Toggleable Buy Threshold**
- **ON**: Buy signal requires **extra confirmation** (reduces false signals but fewer trades).
- **OFF**: Buy triggers as soon as price **closes back above support** (more signals, but may include weaker setups).
---
## **User Inputs**
### **🔧 Customization Options**
- **ATR Length**: Defines the period for **ATR calculation**.
- **Swing Lookback**: Determines how far back to find **swing highs and lows**.
- **ATR Multiplier**: Adjusts the size of **volatility-based modifications**.
- **Buy/Sell Threshold Factor**: Fine-tunes the **entry signal strictness**.
- **Show Level Labels**: Enables/disables **Fibonacci level annotations**.
- **Color Settings**: Customize **support/resistance colors**.
### **📢 Alerts**
AFVB includes built-in **alert conditions** for:
- **Buy Signals** ("AFVB BUY SIGNAL - Possible reversal at support")
- **Sell Signals** ("AFVB SELL SIGNAL - Possible reversal at resistance")
- **Any Signal Triggered** (Useful for automated alerts)
---
## **Who Is This Indicator For?**
✅ **Scalpers & Day Traders** – Helps identify **short-term reversals**.
✅ **Swing Traders** – Useful for **buying dips** and **selling rallies**.
✅ **Trend Traders** – Can be combined with **momentum indicators** for confirmation.
**Best Timeframes:**
⏳ **15-minute, 1-hour, 4-hour, Daily charts** (works across multiple assets).
---
## **Limitations & Considerations**
🚨 **Important Notes**:
- **No indicator guarantees profits**. Always **combine** it with **risk management strategies**.
- Works best **in trending & mean-reverting markets**—may generate false signals in **choppy conditions**.
- Performance may vary across **different assets & timeframes**.
📢 **Backtesting is recommended** before using it for live trading.

Uptrick: Alpha TrendIntroduction
Uptrick: Alpha Trend is a comprehensive technical analysis indicator designed to provide traders with detailed insights into market trends, momentum, and risk metrics. It adapts to various trading styles—from quick scalps to longer-term positions—by dynamically adjusting its calculations and visual elements. By combining multiple smoothing techniques, advanced color schemes, and customizable data tables, the indicator offers a holistic view of market behavior.
Originality
The Alpha Trend indicator distinguishes itself by blending established technical concepts with innovative adaptations. It employs three different smoothing techniques tailored to specific trading modes (Scalp, Swing, and Position), and it dynamically adjusts its parameters to match the chosen mode. The indicator also offers a wide range of color palettes and multiple on-screen tables that display key metrics. This unique combination of features, along with its ability to adapt in real time, sets it apart as a versatile tool for both novice and experienced traders.
Features
1. Multi-Mode Trend Line
The indicator automatically selects a smoothing method based on the trading mode:
- Scalp Mode uses the Hull Moving Average (HMA) for rapid responsiveness.
- Swing Mode employs the Exponential Moving Average (EMA) for balanced reactivity.
- Position Mode applies the Weighted Moving Average (WMA) for smoother, long-term trends.
Each method is chosen to best capture the price action dynamics appropriate to the trader’s timeframe.
2. Adaptive Momentum Thresholds
It tracks bullish and bearish momentum with counters that increment as the trend confirms directional movement. When these counters exceed a user-defined threshold, the indicator generates optional buy or sell signals. This approach helps filter out minor fluctuations and highlights significant market moves.
3. Gradient Fills
Two types of fills enhance visual clarity:
- Standard Gradient Fill displays ATR-based zones above and below the trend line, indicating potential bullish and bearish areas.
- Fading Gradient Fill creates a smooth transition between the trend line and the price, visually emphasizing the distance between them.
4. Bar Coloring and Signal Markers
The indicator can color-code bars based on market conditions—bullish, bearish, or neutral—allowing for immediate visual assessment. Additionally, signal markers such as buy and sell arrows are plotted when momentum thresholds are breached.
5. Comprehensive Data Tables
Uptrick: Alpha Trend offers several optional tables for detailed analysis:
- Insider Info: Displays key metrics like the current trend value, bullish/bearish momentum counts, and ATR.
- Indicator Metrics: Lists input settings such as trend length, damping, signal threshold, and net momentum.
- Market Analysis: Summarizes overall trend direction, trend strength, Sortino ratio, return, and volatility.
- Price & Trend Dynamics: Details price deviation from the trend, trend slope, and ATR ratio.
- Momentum & Volatility Insights: Presents RSI, standard deviation (volatility), and net momentum.
- Performance & Acceleration Metrics: Focuses on the Sortino ratio, trend acceleration, return, and trend strength.
Each table can be positioned flexibly on the chart, allowing traders to customize the layout according to their needs.
Why It Combines Specific Smoothing Techniques
Smoothing techniques are essential for filtering out market noise and revealing underlying trends. The indicator combines three smoothing methods for the following reasons:
- The Hull Moving Average (HMA) in Scalp Mode minimizes lag and responds quickly to price changes, which is critical for short-term trading.
- The Exponential Moving Average (EMA) in Swing Mode gives more weight to recent data, striking a balance between speed and smoothness. This makes it suitable for mid-term trend analysis.
- The Weighted Moving Average (WMA) in Position Mode smooths out short-term fluctuations, offering a clear view of longer-term trends and reducing the impact of transient market volatility.
By using these specific methods in their respective trading modes, the indicator ensures that the trend line is appropriately responsive for the intended time frame, enhancing decision-making while maintaining clarity.
Inputs
1. Trend Length (Default: 30)
Defines the lookback period for the smoothing calculation. A shorter trend length results in a more responsive line, while a longer length produces a smoother, less volatile trend.
2. Trend Damping (Default: 0.75)
Controls the degree of smoothing applied to the trend line. Lower values lead to a smoother curve, whereas higher values increase sensitivity to price fluctuations.
3. Signal Strength Threshold (Default: 5)
Specifies the number of consecutive bullish or bearish bars required to trigger a signal. Higher thresholds reduce the frequency of signals, focusing on stronger moves.
4. Enable Bar Coloring (Default: True)
Toggles whether each price bar is colored to indicate bullish, bearish, or neutral conditions.
5. Enable Signals (Default: True)
When enabled, this option plots buy or sell arrows on the chart once the momentum thresholds are met.
6. Enable Standard Gradient Fill (Default: False)
Activates ATR-based gradient fills around the trend line to visualize potential support and resistance zones.
7. Enable Fading Gradient Fill (Default: True)
Draws a gradual color transition between the trend line and the current price, emphasizing their divergence.
8. Trading Mode (Options: Scalp, Swing, Position)
Determines which smoothing method and ATR period to use, adapting the indicator’s behavior to short-term, medium-term, or long-term trading.
9. Table Position Inputs
Allows users to select from nine possible chart positions (top, middle, bottom; left, center, right) for each data table.
10. Show Table Booleans
Separate toggles control the display of each table (Insider Info, Indicator Metrics, Market Analysis, and the three Deep Tables), enabling a customized view of the data.
Color Schemes
(Default) - The colors in the preview image of the indicator.
(Emerald)
(Sapphire)
(Golden Blaze)
(Mystic)
(Monochrome)
(Pastel)
(Vibrant)
(Earth)
(Neon)
Calculations
1. Trend Line Methods
- Scalp Mode: Utilizes the Hull Moving Average (HMA), which computes two weighted moving averages (one at half the length and one at full length), subtracts them, and then applies a final weighted average based on the square root of the length. This method minimizes lag and increases responsiveness.
- Swing Mode: Uses the Exponential Moving Average (EMA), which assigns greater weight to recent prices, thus balancing quick reaction with smoothness.
- Position Mode: Applies the Weighted Moving Average (WMA) to focus on longer-term trends by emphasizing the entire lookback period and reducing the impact of short-term volatility.
2. Momentum Tracking
The indicator maintains separate counters for bullish and bearish momentum. These counters increase as the trend confirms directional movement and reset when the trend reverses. When a counter exceeds the defined signal strength threshold, a corresponding signal (buy or sell) is triggered.
3. Volatility and ATR Zones
The Average True Range (ATR) is calculated using a period that adapts to the selected trading mode (shorter for Scalp, longer for Position). The ATR value is then used to define upper and lower zones around the trend line, highlighting the current level of market volatility.
4. Return and Trend Acceleration
- Return is calculated as the difference between the current and previous closing prices, providing a simple measure of price change.
- Trend Acceleration is derived from the change in the trend line’s movement (its first derivative) compared to the previous bar. This metric indicates whether the trend is gaining or losing momentum.
5. Sortino Ratio and Standard Deviation
- The Sortino Ratio measures risk-adjusted performance by comparing returns to downside volatility (only considering negative price changes).
- Standard Deviation is computed over the lookback period to assess the extent of price fluctuations, offering insights into market stability.
Usage
This indicator is suitable for various time frames and market instruments. Traders can enable or disable specific visual elements such as gradient fills, bar coloring, and signal markers based on their preference. For a minimalist approach, one might choose to display only the primary trend line. For a deeper analysis, enabling multiple tables can provide extensive data on momentum, volatility, trend dynamics, and risk metrics.
Important Note on Risk
Trading involves inherent risk, and no indicator can eliminate the uncertainty of the markets. Past performance is not indicative of future results. It is essential to use proper risk management, test any new tool thoroughly, and consult multiple sources or professional advice before making trading decisions.
Conclusion
Uptrick: Alpha Trend unifies a diverse set of calculations, adaptive smoothing techniques, and customizable visual elements into one powerful tool. By combining the Hull, Exponential, and Weighted Moving Averages, the indicator is able to provide a trend line that is both responsive and smooth, depending on the trading mode. Its advanced color schemes, gradient fills, and detailed data tables deliver a comprehensive analysis of market trends, momentum, and risk. Whether you are a short-term trader or a long-term investor, this indicator aims to clarify price action and assist you in making more informed trading decisions.

Johnny's Volatility-Driven Trend Identifier w/ Reversal SignalsJohnny's Volatility-Driven Trend Identifier w/ Reversal Signals is designed to identify high-probability trend shifts and reversals by incorporating volatility, momentum, and impulse-based filtering. It is specifically built for traders who want to capture strong trend movements while minimizing false signals caused by low volatility noise.
By leveraging Rate of Change (ROC), Relative Strength Index (RSI), and Average True Range (ATR)-based volatility detection, the indicator dynamically adapts to market conditions. It highlights breakout trends, reversals, and early signs of momentum shifts using strategically placed labels and color-coded trend visualization.
Inspiration taken from Top G indicator .
What This Indicator Does
The Volatility-Driven Trend Identifier works by:
Measuring Market Extremes & Momentum:
Uses ROC normalization with standard deviation to identify impulse moves in price action.
Implements RSI filtering to determine overbought/oversold conditions that validate trend strength.
Utilizes ATR-based volatility tracking to ensure signals only appear when meaningful market movements are occurring.
Identifying Key Trend Events:
Power Peak (🔥): Marks a confirmed strong downtrend, ideal for shorting opportunities.
Surge (🚀): Indicates a confirmed strong uptrend, signaling a potential long entry.
Soft Surge (↗): Highlights a mild bullish reentry or early uptrend formation.
Soft Peak (↘): Shows a mild bearish reentry or early downtrend formation.
Providing Adaptive Filtering for Reliable Signals:
Filters out weak trends with a volatility check, ensuring signals appear only in strong market conditions.
Implements multi-level confirmation by combining trend strength metrics, preventing false breakouts.
Uses gradient-based visualization to color-code market sentiment for quick interpretation.
What This Indicator Signals
Breakouts & Impulse Moves: 🚀🔥
The Surge (🚀) and Power Peak (🔥) labels indicate confirmed momentum breakouts, where the trend has been validated by a combination of ROC impulse, RSI confirmation, and ATR volatility filtering.
These signals suggest that the market is entering a strong trend, and traders can align their entries accordingly.
Early Trend Formation & Reentries: ↗ ↘
The Soft Surge (↗) and Soft Peak (↘) labels indicate areas where a trend might be forming, but is not yet fully confirmed.
These signals help traders anticipate potential entries before the trend gains full strength.
Volatility-Adaptive Trend Filtering: 📊
Since the indicator only activates in volatile conditions, it avoids the pitfalls of low-range choppy markets where false signals frequently occur.
ATR-driven adaptive windowing allows the indicator to dynamically adjust its sensitivity based on real-time volatility conditions.
How to Use This Indicator
1. Identifying High-Probability Entries
Bullish Entries (Long Trades)
Look for 🚀 Surge signals in an uptrend.
Confirm with RSI (should be above 50 for momentum).
Ensure volatility is increasing to validate the breakout.
Use ↗ Soft Surge signals for early entries before the trend fully confirms.
Bearish Entries (Short Trades)
Look for 🔥 Power Peak signals in a downtrend.
RSI should be below 50, indicating downward momentum.
Volatility should be rising, ensuring market momentum is strong.
Use ↘ Soft Peak signals for early entries before a full bearish confirmation.
2. Avoiding False Signals
Ignore signals when the market is ranging (low ATR).
Check RSI and ROC alignment to ensure trend confirmation.
Use additional confluences (e.g., price action, support/resistance levels, moving averages) for enhanced accuracy.
3. Trend Confirmation & Filtering
The stronger the trend, the higher the likelihood that Surge (🚀) and Power Peak (🔥) signals will continue in their direction.
Soft Surge (↗) and Soft Peak (↘) act as early warning signals before major breakouts occur.
What Makes This a Machine Learning-Inspired Moving Average?
While this indicator is not a direct implementation of machine learning (as Pine Script lacks AI/ML capabilities), it mimics machine learning principles by adapting dynamically to market conditions using the following techniques:
Adaptive Trend Selection:
It does not rely on fixed moving averages but instead adapts dynamically based on volatility expansion and momentum detection.
ATR-based filtering adjusts the indicator’s sensitivity to real-time conditions.
Multi-Factor Confirmation (Feature Engineering Equivalent in ML):
Combines ROC, RSI, and ATR in a structured way, similar to how ML models use multiple inputs to filter and classify data.
Implements conditional trend recognition, ensuring that only valid signals pass through the filter.
Noise Reduction with Data Smoothing:
The algorithm avoids false signals by incorporating trend intensity thresholds, much like how ML models remove outliers to refine predictions.
Adaptive filtering ensures that low-volatility environments do not produce misleading signals.
Why Use This Indicator?
✔ Reduces False Signals: Multi-factor validation ensures only high-confidence signals are triggered.
✔ Works in All Market Conditions: Volatility-adaptive nature allows the indicator to perform well in both trending and ranging markets.
✔ Great for Swing & Intraday Trading: It helps spot momentum shifts early and allows traders to catch major market moves before they fully develop.
✔ Visually Intuitive: Color-coded trends and clear signal markers make it easy to interpret.

Dynamic Score Supertrend [QuantAlgo]Dynamic Score Supertrend 📈🚀
The Dynamic Score Supertrend by QuantAlgo introduces a sophisticated trend-following tool that combines the well-known Supertrend indicator with an innovative dynamic trend scoring technique . By tracking market momentum through a scoring system that evaluates price behavior over a customizable window, this indicator adapts to changing market conditions. The result is a clearer, more adaptive tool that helps traders and investors detect and capitalize on trend shifts with greater precision.
💫 Conceptual Foundation and Innovation
At the core of the Dynamic Score Supertrend is the dynamic trend score system , which measures price movements relative to the Supertrend’s upper and lower bands. This scoring technique adds a layer of trend validation, assessing the strength of price trends over time. Unlike traditional Supertrend indicators that rely solely on ATR calculations, this system incorporates a scoring mechanism that provides more insight into trend direction, allowing traders and investors to navigate both trending and choppy markets with greater confidence.
✨ Technical Composition and Calculation
The Dynamic Score Supertrend utilizes the Average True Range (ATR) to calculate the upper and lower Supertrend bands. The dynamic trend scoring technique then compares the price to these bands over a customizable window, generating a trend score that reflects the current market direction.
When the score exceeds the uptrend or downtrend thresholds, it signals a possible shift in market direction. By adjusting the ATR settings and window length, the indicator becomes more adaptable to different market conditions, from steady trends to periods of higher volatility. This customization allows users to refine the Supertrend’s sensitivity and responsiveness based on their trading or investing style.
📈 Features and Practical Applications
Customizable ATR Settings: Adjust the ATR length and multiplier to control the sensitivity of the Supertrend bands. This allows the indicator to smooth out noise or react more quickly to price shifts, depending on market conditions.
Window Length for Dynamic Scoring: Modify the window length to adjust how many data points the scoring system considers, allowing you to tailor the indicator’s responsiveness to short-term or long-term trends.
Uptrend/Downtrend Thresholds: Set thresholds for identifying trend signals. Increase these thresholds for more reliable signals in choppy markets, or lower them for more aggressive entry points in trending markets.
Bar and Background Coloring: Visual cues such as bar coloring and background fills highlight the direction of the current trend, making it easier to spot potential reversals and trend shifts.
Trend Confirmation: The dynamic trend score system provides a clearer confirmation of trend strength, helping you identify strong, sustained movements while filtering out false signals.
⚡️ How to Use
✅ Add the Indicator: Add the Dynamic Score Supertrend to your favourites, then apply it to your chart. Adjust the ATR length, multiplier, and dynamic score settings to suit your trading or investing strategy.
👀 Monitor Trend Shifts: Track price movements relative to the Supertrend bands and use the dynamic trend score to confirm the strength of a trend. Bar and background colors make it easy to visualize key trend shifts.
🔔 Set Alerts: Configure alerts when the dynamic trend score crosses key thresholds, so you can act on significant trend changes without constantly monitoring the charts.
🌟 Summary and Usage Tips
The Dynamic Score Supertrend by QuantAlgo is a robust trend-following tool that combines the power of the Supertrend with an advanced dynamic scoring system. This approach provides more adaptable and reliable trend signals, helping traders and investors make informed decisions in trending markets. The customizable ATR settings and scoring thresholds make it versatile across various market conditions, allowing you to fine-tune the indicator for both short-term momentum and long-term trend following. To maximize its effectiveness, adjust the settings based on current market volatility and use the visual cues to confirm trend shifts. The Dynamic Score Supertrend offers a refined, probabilistic approach to trading and investing, making it a valuable addition to your toolkit.

AminioLibraryLibrary "AminioLibrary"
: this is my personal library that is being used in different indicators and strategies
calculateMA(source, len, maType)
This fuction returns a moving average value based on the type
Parameters:
source (float) : Is the time series source to calculate average from
len (simple int) : The length of the moving average, this should be integer
maType (string) : The type of moving average, acceptable types are : SMA, HMA, EMA, RMA, WMA, VWMA
Returns: value of moving average
atr(source, len)
This fuction returns atr value for a given source
Parameters:
source (float) : Is the time series source to calculate atr from
len (simple int) : The length of the atr, this should be integer
Returns: value of atr from source
superTrend(source, factor, len)
This fuction returns value of super trend indicator and the trend direction as a tupple
Parameters:
source (float) : Is the time series source to calculate super trend from
factor (simple float) : The multiplication factor for upper and lower band calcualtion, this can be a float
len (simple int) : The length of the super trend, this should be integer
Returns: value of atr from source
halfTrend(am, chdev)
This fuction returns a hTrend type carrying different values for half trend indicator
Parameters:
am (int) : This is the amplitude used for calcucating the half trend, use integers
chdev (float) : This is the Channel Deviation value used for calculating upper and lower atr channel boundaries, you can use floats
Returns: hTrend data type
hTrend
Fields:
halfTrend (series__float)
trend (series__integer)
atrHigh (series__float)
atrLow (series__float)
arrowUp (series__float)
arrowDown (series__float)
