BSL/SSL Sweep + FVG Strategy Jobin (c) The New York ATM Model is a structured intraday strategy designed to capture algorithmic stop-hunts and reversals during the New York session open. It focuses on liquidity sweeps—either Buy-Side or Sell-Side—followed by a confirmation using Fair Value Gaps (FVGs).
In den Scripts nach "algo" suchen

My Backtest Module### 📊 Universal Backtest Module - Pro Structure
**A Fully Customizable Strategy Framework for Advanced Backtesting & Signal Analysis**
This powerful Pine Script strategy is designed as a **universal testing module** for traders and developers who want to evaluate custom trading logic across multiple conditions, timeframes, and risk parameters — all within a single, flexible structure.
> ⚠️ **Note:** This script is intended for **educational and backtesting purposes only**. It does **not** provide financial advice, nor does it guarantee profits. Always test strategies thoroughly before applying them to live markets.
---
### 🔧 Key Features
✅ **Multi-Source Entry Signals**
Combine up to two independent buy/sell signals using flexible logic:
- **OR Logic**: Trigger on any signal (edge-based).
- **AND Logic (Latched)**: Requires both signals at any point (flip-flop style).
- **AND No Latch**: Both signals must be active simultaneously.
✅ **Dynamic Trade Direction Control**
Choose between:
- Long & Short (Both)
- Long Only
- Short Only
With optional **close-on-opposite-signal** and **wait-for-opposite-reentry** logic.
✅ **Precision Timing Filters**
- Date range filtering (start/end dates)
- Intraday session control (supports up to 3 custom sessions)
- Visual session shading for clarity
✅ **Advanced Risk Management**
- Multiple Stop Loss types:
- Fixed Points / Percent
- ATR-based (adjustable multiplier)
- Swing-based (automatically detects pivots)
- External SL source
- Dynamic position sizing:
- Fixed lot
- % of equity risk (with max fallback)
✅ **Smart Take Profit Options**
- Fixed Points, Percent, RR Ratio, ATR, Fibonacci extensions
- Support for **external TP levels** (user-defined sources)
- Optional **multiple partial exits** with customizable size distribution
- Fibonacci TP levels (1.0, 1.618, 2.618, 4.236) based on SL distance
✅ **Flexible Exit Tools**
- Breakeven stop activation after TP1 hit
- Internal swing-based trailing stop
- External trailing stop (custom source)
- Max holding time (auto-close after X candles)
- Custom close conditions via user-defined logic
- Close & reverse functionality
✅ **Visual Clarity & Feedback**
- Clear visual markers for Buy/Sell signals
- Real-time SL, Entry, and TP lines with color-coded risk/reward zones
- On-chart TP level labels showing prices and allocation percentages
- Session background highlighting
- Trade statistics summary label
---
### 🛠️ Ideal For:
- Testing new indicator combinations
- Validating entry/exit logic under various market filters
- Comparing signal fusion methods (OR vs AND)
- Simulating professional-grade risk management rules
- Educational demonstrations in algorithmic trading
---
### ⚠️ Important Notes
- This is a **backtesting tool**, not a live trading bot.
- Past performance is **not indicative of future results**.
- Strategy performance depends entirely on the quality of input signals.
- Always validate results across multiple assets and timeframes.
- Use in conjunction with sound money management principles.
---
### 📌 How to Use
1. Attach the script to your chart.
2. Configure **Buy/Sell Signal Sources** (e.g., RSI crossovers, moving averages, etc.)
3. Set your preferred **trade direction, session, and date filters**
4. Define **stop loss and take profit rules**
5. Adjust position sizing and exit behavior
6. Run the backtest and analyze results in the **Strategy Tester tab**
💡 *Tip: Combine with other indicators by referencing their output values as signal sources.*
---
### ❌ Disclaimer
This script is shared for **informational and educational purposes only**. By using it, you agree that:
- The author is **not responsible** for any financial losses.
- Trading involves significant risk; only risk capital should be used.
- You are solely responsible for your trading decisions.
🚫 **This script does not promote get-rich-quick schemes, guaranteed profits, or unverified performance claims.**
---
🔁 **Version:** 5 (Pine Script v5)
📦 **Category:** Strategy
📈 **Overlay:** Yes
🧪 **Purpose:** Backtesting, Signal Validation, Risk Modeling
---
✅ **Safe for Public Sharing**
✔ Complies with TradingView’s community standards
✔ No misleading performance claims
✔ No automated trading promises
✔ No copyrighted or plagiarized content
---
> 💬 *"Knowledge is power — test wisely, trade responsibly."*
---
Let me know if you'd like a **short version** for the script's header comment or a **public post summary** for the TradingView feed!
EMA inFusion Pro - Multiple SourcesEMA Fusion Pro: Dynamic Trend & Momentum Strategy with Three Exit Modes
EMA Fusion Pro is a highly customizable, multi-exit trend-following strategy designed for traders who value both precision and flexibility. By leveraging exponential moving averages (EMA), average directional index (ADX), and volume analysis, this strategy aims to capture trending market moves while offering three distinct exit modes for optimal risk management across varying market conditions.
Strategy Overview
This strategy systematically identifies potential entry points using a moving average crossover with highly configurable data sources (including price, volume, rate of change, or their Heikin Ashi versions) and filters signal quality with ADX trend strength and volume spikes. Each trade is managed with one of three advanced exit methodologies—reverse signal, ATR-based stop/take profit, or fixed percentage—giving you the control to adapt your risk profile to different market regimes.
Key Features
Customizable EMA Source: Calculate the core trend-filtering EMA from price (default), volume, rate of change, or their Heikin Ashi counterparts for unique market perspectives.
Trend Filter with ADX: Confirm entries only when the trend is strong, as measured by the user-adjustable ADX threshold.
Volume Spike Confirmation: Optional filter to only take trades with above-average volume activity, reducing false signals.
Three Exit Modes:
Reverse Signal: Exit trades when a new, opposite entry signal occurs.
ATR-Based Stop/Take Profit: Dynamic risk management using multiples of the average true range (ATR) for both take profit and stop loss.
Percent-Based Stop/Take Profit: Fixed-percentage risk management with user-defined thresholds.
Visual Annotations: Signal markers, EMA line color-coded by source, trend background coloring, and optional ATR/percent-based TP/SL levels.
Info Panel: Real-time display of all core indicators, current trading mode, exit parameters, and position status for quick oversight.
How It Works
Entry Logic: A crossover signal (above/below the EMA) triggers a new entry, but only if both ADX trend strength and (optionally) volume spike conditions are met.
Exit Logic: Three selectable modes allow you to exit trades on reverse signals, at a dynamic ATR-based profit or loss, or at a fixed percentage gain/loss.
Flexible Data Analysis: The EMA source can be chosen from six options—standard price, volume, rate of change, or their Heikin Ashi variants—allowing experimentation with different market dimensions.
Risk Management: All exits are precisely controlled, either by the next opposing signal, by volatility-adjusted levels, or by fixed risk/reward ratios.
Backtest & Optimization: The strategy is fully backtestable within TradingView’s Strategy Tester, with adjustable parameters for optimization.
Customization & Usage
Indicator Source: Select your preferred data type for EMA calculation, opening the door to creative strategy variations (e.g., volume momentum, pure price trend, rate of change divergence).
Filter Toggles: Enable/disable ADX and volume filters as desired—useful for different market environments.
Exit Mode Selection: Switch between reverse, ATR, or percent-based exits with a single parameter—ideal for adapting to ranging vs. trending markets.
Visual Clarity: The EMA line color reflects its underlying source, and the info panel summarizes all critical values for easy monitoring.
Who Should Use This Strategy?
Trend Followers seeking to ride strong moves with multiple exit options.
Experienced Traders who want to experiment with different data types (volume, momentum, Heikin Ashi) for trend analysis.
Algorithmic Traders looking for a robust, flexible base to build upon with their own ideas.
Getting Started
Apply the script to your chart and review default settings.
Customize parameters—EMA length, ADX threshold, volume settings, exit type—as desired.
Backtest on multiple instruments and timeframes to evaluate performance.
Optimize filters, exit rules, and risk parameters for your preferred trading style.
Monitor with the real-time info panel and trade alerts.
Disclaimer
This script is for educational and entertainment purposes only. It is not financial advice. Past performance is not indicative of future results. Always conduct thorough testing and consider your risk tolerance before trading real capital.
— Happy Trading —
Feel free to adapt, share, and contribute to this open-source strategy!

Script_Algo - ORB Strategy with Filters🔍 Core Concept: This strategy combines three powerful technical analysis tools: Range Breakout, the SuperTrend indicator, and a volume filter. Additionally, it features precise customization of the number of candles used to construct the breakout range, enabling optimized performance for specific assets.
🎯 How It Works:
The strategy defines a trading range at the beginning of the trading session based on a selected number of candles.
It waits for a breakout above the upper or below the lower boundary of this range, requiring a candle close.
It filters signals using the SuperTrend indicator for trend confirmation.
It utilizes trading volume to filter out false breakouts.
⚡ Strategy Features
📈 Entry Points:
Long: Candle close above the upper range boundary + SuperTrend confirmation
Short: Candle close below the lower range boundary + SuperTrend confirmation
🛡️ Risk Management:
Stop-Loss: Set at the opposite range boundary.
Take-Profit: Calculated based on a risk/reward ratio (3:1 by default).
Position Size: 10 contracts (configurable).
⚠️ IMPORTANT SETTINGS
🕐 Time Parameters:
Set the correct time and time zone!
❕ATTENTION: The strategy works ONLY with correct time settings! Set the time corresponding to your location and trading session.
📊 This strategy is optimized for trading TESLA stock!
Parameters are tailored to TESLA's volatility, and trading volumes are adequate for signal filtering. Trading time corresponds to the American session.
📈 If you look at the backtesting results, you can see that the strategy could potentially have generated about 70 percent profit on Tesla stock over six months on 5m timeframe. However, this does not guarantee that results will be repeated in the future; remain vigilant.
⚠️ For other assets, the following is required:
Testing and parameter optimization
Adjustment of time intervals and the number of candles forming the range
Calibration of stop-loss and take-profit levels
⚠️ Limitations and Drawbacks
🔗 Automation Constraints:
❌ Cannot be directly connected via Webhook to CFD brokers!
Additional IT solutions are required for automation, thus only manual trading based on signals is possible.
📉 Risk Management:
Do not risk more than 2-3% of your account per trade.
Test on historical data before live use.
Start with a demo account.
💪 Strategy Advantages
✅ Combined approach – multiple signal filters
✅ Clear entry and exit rules
✅ Visual signals on the chart
✅ Volume-based false breakout filtering
✅ Automatic position management
🎯 Usage Recommendations
Always test the strategy on historical data.
Start with small trading volumes.
Ensure time settings are correct.
Adapt parameters to current market volatility.
Use only for stocks – futures and Forex require adaptation.
📚 Suitable Timeframes - M1-M15
Only highly liquid stocks
🍀 I wish all subscribers good luck in trading and steady profits!
📈 May your charts move in the right direction!
⚠️ Remember: Trading involves risk. Do not invest money you cannot afford to lose!

Script_Algo - Fibo Correction Strategy🔹 Core Concept
The strategy is built on combining Fibonacci retracement levels, candlestick pattern confirmation, and trend filtering for trade selection. It performs well on the 1-hour timeframe across many cryptocurrency pairs. Particularly on LINKUSDT over the past year and a half, despite the not very optimal 1:1 risk/reward ratio.
The logic is simple: after a strong impulse move, the price often retraces to key Fibonacci levels (specifically, the 61.8% level). If a confirming candlestick (pattern) appears at this moment, the strategy looks for an entry in the direction of the main trend.
🔹 Indicators Used in the Strategy
ATR (Average True Range) — Used to calculate the stop-loss and take-profit levels.
EMA (9 and 21) — Additional moving averages for assessing the direction of movement (not directly used in entry conditions, but the logic can be expanded to include them).
SMA (Trend Filter, 20 by default) — The trend direction filter. Trades are only opened in its direction.
Fibonacci Levels — The 61.8% retracement level is calculated based on the high and low of the previous candle.
🔹 Entry Conditions
🟢 Long (Buy):
Previous Candle:
Must be green (close higher than open).
Must have a body not smaller than a specified minimum.
The upper wick must not exceed 30% of the body size.
→ This filters out "weak" or "indecisive" candles.
Current Candle:
Price touches or breaches the Fibonacci 61.8% retracement level from the previous range.
Closes above this level.
Closes above the Trend Filter (SMA) line.
A position is opened only if there are no other open trades at the moment.
🔴 Short (Sell):
Previous Candle:
Must be red (close lower than open).
Must have a body not smaller than a specified minimum.
The lower wick must not exceed 30% of the body size.
Current Candle:
Price touches or breaches the Fibonacci 61.8% retracement level from the previous range.
Closes below this level.
Closes below the Trend Filter (SMA) line.
A trade is opened only if there are no other open positions.
🔹 Risk Management
Stop-Loss = ATR × multiplier (default is 5).
Take-Profit = ATR × the same multiplier.
Thus, the default risk/reward ratio is 1:1, but it can be easily adjusted by changing the coefficient. Although, strangely enough, this ratio has shown the best results on some assets on the 1-hour timeframe.
🔹 Chart Visualization
Fibonacci level for Long — Green line with circles.
Fibonacci level for Short — Red line with circles.
Trend Filter line (SMA) — Blue.
🔹 Strengths of the Strategy
✅ Utilizes a proven market pattern — retracement to the 61.8% level.
✅ Further filters entries using trend and candlestick patterns.
✅ Simple, transparent logic that is easy to expand (e.g., adding other Fib levels, an EMA filter, etc.).
🔹 Limitations
⚠️ Performs better in trending markets; can generate false signals during ranging (sideways) conditions.
⚠️ The fixed 1:1 risk/reward ratio is not always optimal and could be refined.
⚠️ Performance depends on the selected timeframe and ATR parameters.
📌 Summary:
The strategy seeks corrective entries in the direction of the trend, confirmed by candlestick patterns. It is versatile and can be applied to forex pairs, cryptocurrencies, and stocks.
⚠️ Not financial advice. Pay close attention to risk management to avoid blowing your account. The strategy is not repainting — I have personally verified it through real testing — but it may not necessarily replicate the same results in the future, as the market is constantly changing. Test it, profit, and good luck to everyone!

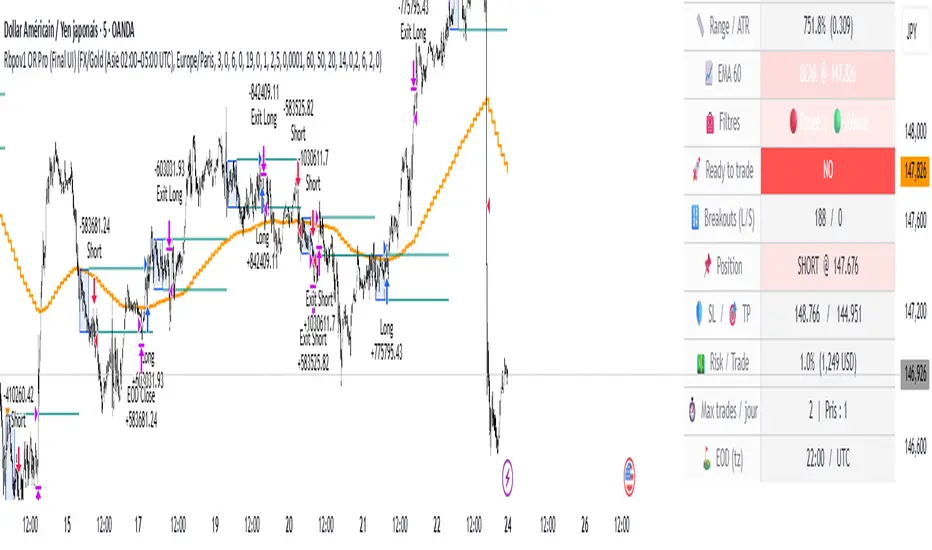
Rbpov1 – Opening Range Multi-Actifs Final📌 Strategy Bio – Rbpov1 Opening Range Pro
🎯 Core Concept
The Rbpov1 Opening Range Pro is an advanced algorithmic trading system built around the opening range breakout concept.
It is based on the observation that, after a period of consolidation (the opening range), markets often generate strong directional moves once the range is broken.
This strategy is designed to be multi-asset (Forex, indices, commodities, crypto) and multi-timeframe, with the following key principles:
A reference range (default: 03:00 → 06:00 UTC+2, customizable).
Trade entries are taken only after the range closes.
Smart filtering (trend, volatility, volume) to reduce false signals.
Strict risk management in USD, with Stop Loss and Take Profit defined in multiples of R.
Automatic end-of-day flat rule: all positions are closed by session end.
⚙️ Filters & Conditions
🔹 1. Trend Filter (EMA HTF)
A 21-period EMA is applied to a higher timeframe (default: H4).
If price is above EMA, only longs are allowed.
If price is below EMA, only shorts are allowed.
👉 This aligns intraday trades with the dominant trend.
🔹 2. Volatility Filter (ATR)
Uses a 14-period ATR to validate range conditions.
Opening range is valid only if:
Range > minATR × ATR
Range < maxATR × ATR
Default: minATR = 0.2, maxATR = 6.0.
👉 Filters out noise (tiny ranges) or overextended volatility.
🔹 3. Volume Filter (Optional)
Breakout candle must show higher volume than the average (default SMA 20).
Prevents low-liquidity breakouts.
🔹 4. Session & Trading Rules
No trades during weekends (Forex).
Maximum X trades per day (default: 2).
Positions are force-closed at EOD (default: 19:00 UTC+2).
💰 Risk Management
Dynamic position sizing in USD (capital × risk%).
Stop Loss automatically set at the opposite side of the range (with optional buffer).
Take Profit in multiples of R (default: 1.5R).
Equity-based recalculation ensures consistency as account grows.
📊 Key Benefits
✅ Professional and modular architecture.
✅ Works across Forex, indices, gold, and crypto.
✅ Smart filtering for cleaner signals.
✅ Robust and consistent risk management.
✅ Automatic end-of-day flattening (no overnight risk).
✅ Modern and visual dashboard interface for readability.
🏆 Use Cases
Forex (USD/JPY, EUR/USD, GBP/USD) → Asian session ranges.
Indices (NAS100, US30, DAX) → NYSE opening ranges.
Gold (XAU/USD) → Tokyo or pre-London ranges.
Crypto (BTC, ETH) → Tailored to volatility peaks.
FlowStateTrader FlowState Trader - Advanced Time-Filtered Strategy
## Overview
FlowState Trader is a sophisticated algorithmic trading strategy that combines precision entry signals with intelligent time-based filtering and adaptive risk management. Built for traders seeking to achieve their optimal performance state, FlowState identifies high-probability trading opportunities within user-defined time windows while employing dynamic trailing stops and partial position management.
## Core Strategy Philosophy
FlowState Trader operates on the principle that peak trading performance occurs when three elements align: **Focus** (precise entry signals), **Flow** (optimal time windows), and **State** (intelligent position management). This strategy excels at finding reversal opportunities at key support and resistance levels while filtering out suboptimal trading periods to keep traders in their optimal flow state.
## Key Features
### 🎯 Focus Entry System
**Support/Resistance Zone Trading**:
- Dynamic identification of key price levels using configurable lookback periods
- Entry signals triggered when price interacts with these critical zones
- Volume confirmation ensures genuine breakout/reversal momentum
- Trend filter alignment prevents counter-trend disasters
**Entry Conditions**:
- **Long Signals**: Price closes above support buffer, touches support level, with above-average volume
- **Short Signals**: Price closes below resistance buffer, touches resistance level, with above-average volume
- Optional trend filter using EMA or SMA for directional bias confirmation
### ⏰ FlowState Time Filtering System
**Comprehensive Time Controls**:
- **12-Hour Format Trading Windows**: User-friendly AM/PM time selection
- **Multi-Timezone Support**: UTC, EST, PST, CST with automatic conversion
- **Day-of-Week Filtering**: Trade only weekdays, weekends, or both
- **Lunch Hour Avoidance**: Automatically skips low-volume lunch periods (12-1 PM)
- **Visual Time Indicators**: Background coloring shows active/inactive trading periods
**Smart Time Features**:
- Handles overnight trading sessions seamlessly
- Prevents trades during historically poor performance periods
- Customizable trading hours for different market sessions
- Real-time trading window status in dashboard
### 🛡️ Adaptive Risk Management
**Multi-Level Take Profit System**:
- **TP1**: First profit target with optional partial position closure
- **TP2**: Final profit target for remaining position
- **Flexible Scaling**: Choose number of contracts to close at each level
**Dynamic Trailing Stop Technology**:
- **Three Operating Modes**:
- **Conservative**: Earlier activation, tighter trailing (protect profits)
- **Balanced**: Optimal risk/reward balance (recommended)
- **Aggressive**: Later activation, wider trailing (let winners run)
- **ATR-Based Calculations**: Adapts to current market volatility
- **Automatic Activation**: Engages when position reaches profitability threshold
### 📊 Intelligent Position Sizing
**Contract-Based Management**:
- Configurable entry quantity (1-1000 contracts)
- Partial close quantities for profit-taking
- Clear position tracking and P&L monitoring
- Real-time position status updates
### 🎨 Professional Visualization
**Enhanced Chart Elements**:
- **Entry Zone Highlighting**: Clear visual identification of trading opportunities
- **Dynamic Risk/Reward Lines**: Real-time TP and SL levels with price labels
- **Trailing Stop Visualization**: Live tracking of adaptive stop levels
- **Support/Resistance Lines**: Key level identification
- **Time Window Background**: Visual confirmation of active trading periods
**Dual Dashboard System**:
- **Strategy Dashboard**: Real-time position info, settings status, and current levels
- **Performance Scorecard**: Live P&L tracking, win rates, and trade statistics
- **Customizable Sizing**: Small, Medium, or Large display options
### ⚙️ Comprehensive Customization
**Core Strategy Settings**:
- **Lookback Period**: Support/resistance calculation period (5-100 bars)
- **ATR Configuration**: Period and multipliers for stops/targets
- **Reward-to-Risk Ratios**: Customizable profit target calculations
- **Trend Filter Options**: EMA/SMA selection with adjustable periods
**Time Filter Controls**:
- **Trading Hours**: Start/end times in 12-hour format
- **Timezone Selection**: Four major timezone options
- **Day Restrictions**: Weekend-only, weekday-only, or unrestricted
- **Session Management**: Lunch hour avoidance and custom periods
**Risk Management Options**:
- **Trailing Stop Modes**: Conservative/Balanced/Aggressive presets
- **Partial Close Settings**: Enable/disable with custom quantities
- **Alert System**: Comprehensive notifications for all trade events
### 📈 Performance Tracking
**Real-Time Metrics**:
- Net profit/loss calculation
- Win rate percentage
- Profit factor analysis
- Maximum drawdown tracking
- Total trade count and breakdown
- Current position P&L
**Trade Analytics**:
- Winner/loser ratio tracking
- Real-time performance scorecard
- Strategy effectiveness monitoring
- Risk-adjusted return metrics
### 🔔 Alert System
**Comprehensive Notifications**:
- Entry signal alerts with price and quantity
- Take profit level hits (TP1 and TP2)
- Stop loss activations
- Trailing stop engagements
- Position closure notifications
## Strategy Logic Deep Dive
### Entry Signal Generation
The strategy identifies high-probability reversal points by combining multiple confirmation factors:
1. **Price Action**: Looks for price interaction with key support/resistance levels
2. **Volume Confirmation**: Ensures sufficient market interest and liquidity
3. **Trend Alignment**: Optional filter prevents counter-trend positions
4. **Time Validation**: Only trades during user-defined optimal periods
5. **Zone Analysis**: Entry occurs within calculated buffer zones around key levels
### Risk Management Philosophy
FlowState Trader employs a three-tier risk management approach:
1. **Initial Protection**: ATR-based stop losses set at strategy entry
2. **Profit Preservation**: Trailing stops activate once position becomes profitable
3. **Scaled Exit**: Partial profit-taking allows for both security and potential
### Time-Based Edge
The time filtering system recognizes that not all trading hours are equal:
- Avoids low-volume, high-spread periods
- Focuses on optimal liquidity windows
- Prevents trading during news events (lunch hours)
- Allows customization for different market sessions
## Best Practices and Optimization
### Recommended Settings
**For Scalping (1-5 minute charts)**:
- Lookback Period: 10-20
- ATR Period: 14
- Trailing Stop: Conservative mode
- Time Filter: Major session hours only
**For Day Trading (15-60 minute charts)**:
- Lookback Period: 20-30
- ATR Period: 14-21
- Trailing Stop: Balanced mode
- Time Filter: Extended trading hours
**For Swing Trading (4H+ charts)**:
- Lookback Period: 30-50
- ATR Period: 21+
- Trailing Stop: Aggressive mode
- Time Filter: Disabled or very broad
### Market Compatibility
- **Forex**: Excellent for major pairs during active sessions
- **Stocks**: Ideal for liquid stocks during market hours
- **Futures**: Perfect for index and commodity futures
- **Crypto**: Effective on major cryptocurrencies (24/7 capability)
### Risk Considerations
- **Market Conditions**: Performance varies with volatility regimes
- **Timeframe Selection**: Lower timeframes require tighter risk management
- **Position Sizing**: Never risk more than 1-2% of account per trade
- **Backtesting**: Always test on historical data before live implementation
## Educational Value
FlowState serves as an excellent learning tool for:
- Understanding support/resistance trading
- Learning proper time-based filtering
- Mastering trailing stop techniques
- Developing systematic trading approaches
- Risk management best practices
## Disclaimer
This strategy is for educational and informational purposes only. Past performance does not guarantee future results. Trading involves substantial risk of loss and is not suitable for all investors. Users should thoroughly backtest the strategy and understand all risks before live trading. Always use proper position sizing and never risk more than you can afford to lose.
---
*FlowState Trader represents the evolution of systematic trading - combining classical technical analysis with modern risk management and intelligent time filtering to help traders achieve their optimal performance state through systematic, disciplined execution.*

MK Custome Adaptive SuperTrend Strategy [HalfSquatch]This strategy uses Lux Algos Adaptive supertrend. It has been modified here as a strategy.
This is used to test a trading bot.

Parallax Momentum MNQ Strategy# 📈 Parallax Momentum MNQ Strategy
## Overview
The Parallax Momentum MNQ Strategy is a sophisticated support/resistance breakout system specifically designed for Micro Nasdaq futures (MNQ) trading (also works on minis). This strategy combines dynamic level detection with momentum confirmation to identify high-probability entry opportunities while maintaining strict risk management protocols.
## 🎯 Key Features
### Core Strategy Logic
- **Dynamic Support/Resistance Detection**: Automatically identifies key levels using configurable lookback periods
- **Momentum Confirmation**: Volume-based filtering ensures trades align with market momentum
- **ATR-Based Risk Management**: Adaptive stop losses and take profits based on market volatility
- **Dual Entry System**: Both long and short opportunities with limit order execution
### Risk Management
- **ATR-Adaptive Stops**: Stop losses and take profits automatically adjust to market volatility
- **Reward-to-Risk Ratios**: Configurable R:R ratios with default 2:1 minimum
- **Maximum Loss Protection**: Optional daily loss limits to prevent overtrading
- **Session Time Filtering**: Trade only during specified market hours
### Strategy Modes
- **Conservative Mode**: 0.8x risk multiplier for cautious trading
- **Balanced Mode**: Standard 1.0x risk multiplier (default)
- **Aggressive Mode**: 1.2x risk multiplier for active trading
## 📊 Visual Features
### Dashboard Display
- Real-time strategy status and performance metrics
- Current support/resistance levels and ATR values
- Live risk-to-reward ratios for potential trades
- Win rate, profit factor, and drawdown statistics
- Adjustable dashboard size and positioning
### Chart Indicators
- Support and resistance lines with labels
- ATR-based levels (+/-1 ATR and +/-2 ATR)
- Dynamic visual updates as levels change
- Configurable line extensions and styling
## ⚙️ Configuration Options
### Entry Filters
- **Volume Filter**: Optional volume confirmation above SMA
- **Session Time Filter**: 12-hour format time restrictions
- **ATR vs Fixed Stops**: Choose between adaptive or fixed tick-based exits
### Risk Controls
- **ATR Period**: Default 14-period ATR calculation
- **Stop Loss Multiplier**: ATR-based stop distance (default 1.5x)
- **Take Profit Multiplier**: ATR-based target distance (default 1.5x)
- **Secondary Take Profit**: Optional TP2 with position scaling
## 📋 How It Works
### Entry Conditions
**Long Trades**: Triggered when price closes above support buffer but low touches support level, with volume and session confirmation
**Short Trades**: Triggered when price closes below resistance buffer but high touches resistance level, with volume and session confirmation
### Exit Strategy
- **Primary Take Profit**: ATR-based target with 2:1 R:R minimum
- **Stop Loss**: ATR-based protective stop
- **Optional TP2**: Extended target for partial profit taking
- **One Trade at a Time**: No overlapping positions
## 🎛️ Default Settings
- **Lookback Period**: 20 bars for support/resistance detection
- **ATR Period**: 14 bars for volatility calculation
- **Stop Loss**: 1.5x ATR from entry
- **Take Profit**: 1.5x ATR with 2:1 reward-to-risk ratio
- **Session**: 7:30 AM - 2:00 PM (configurable)
## ⚠️ Important Notes
### Risk Disclaimer
- This strategy is for educational and informational purposes only
- Past performance does not guarantee future results
- Always use proper position sizing and risk management
- Test thoroughly on historical data before live trading
- Consider market conditions and volatility when using
### Best Practices
- Backtest on sufficient historical data
- Start with conservative mode for new users
- Monitor performance regularly and adjust parameters as needed
- Use appropriate position sizing for your account
- Consider broker commissions and slippage in live trading
## 🔧 Customization
The strategy offers extensive customization options including:
- Adjustable time sessions with AM/PM format
- Configurable ATR and risk parameters
- Optional maximum daily loss limits
- Dashboard size and position controls
- Visual element toggles and styling
## 📈 Ideal For
- MNQ (Micro Nasdaq) futures traders
- Intraday momentum strategies
- Traders seeking systematic entry/exit rules
- Risk-conscious traders wanting automated stops
- Both beginner and experienced algorithmic traders
---
**Version**: Pine Script v5 Compatible
**Timeframe**: Works on multiple timeframes (test on 1m, 3m, 5m, 15m)
**Market**: Optimized for MNQ but adaptable to other instruments
**Strategy Type**: Trend following with momentum confirmation

Aether SignalAether Signal is a professional TradingView indicator engineered for advanced traders who demand precise analysis, smart money concepts, and robust risk management. It systematically incorporates institutional trading techniques, automated level detection, and multi-level profit-taking for exceptional trade execution.
Support & Resistance: Aether Signal automatically identifies key support and resistance levels using mathematically rigorous algorithms, ensuring that traders see the most significant price barriers for their entries and exits.
Smart Money Concepts: The indicator is grounded in institutional trading logic, analyzing market structure to pinpoint where large market participants are engaging. It leverages volume and price interaction at critical zones, similar to harmonic liquidity nodes in professional strategies.
Precise Entry Points: Entry signals are generated when strict confluence conditions are met, ensuring signals align with underlying market structure, high-volume footprints, and optimal momentum. Stops are logically placed just beyond the validated support or resistance—on the opposite side of the key zone.
Triple Take Profits: Aether Signal equips traders to maximize returns with three intelligently placed take profit levels (TP1, TP2, TP3), allowing for strategic scaling out and adaptive trade management.
Supply & Demand Zones: The indicator scans for market imbalances by identifying high-probability supply and demand areas driven by institutional activity and volume anomalies, guiding traders toward potent reversal or continuation setups.
Advanced Risk Management: Robust risk controls are integrated, including logical stop loss suggestions and trade selection filters, to minimize overtrading and enhance consistency.
Win Rate: The system claims a win rate of up to 96% under optimal settings and strict adherence to its entry criteria, setting a high benchmark for performance (note: actual results may vary depending on market conditions and trader discipline).
Aether Signal is tailored for traders seeking the edge of institutional-grade analytics—offering comprehensive structure analysis, actionable alerts, and performance-focused features that merge automation with trader control.

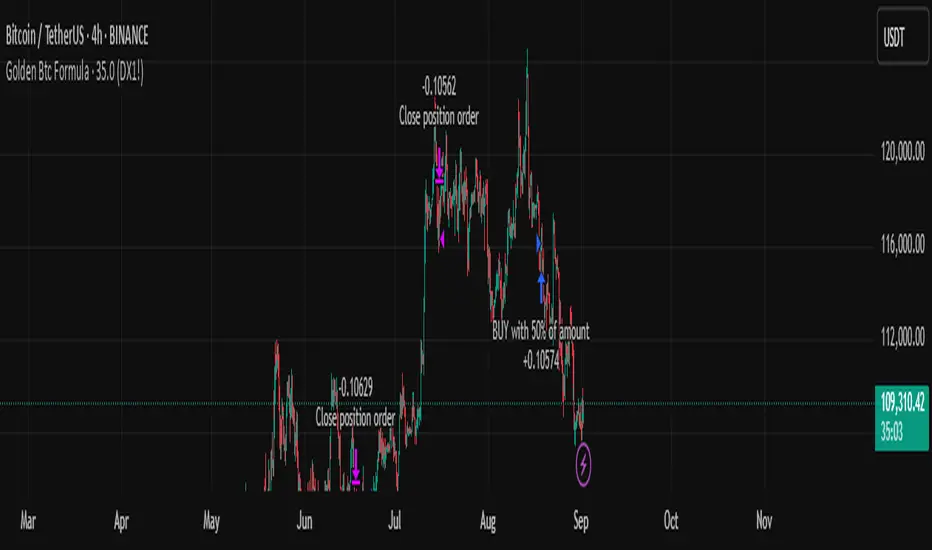
Golden Btc Formula🏆 Golden BTC Formula Bot
Introducing the Golden BTC Formula Bot — a smart trading strategy built specifically for Bitcoin on TradingView, designed to combine algorithmic precision with solid risk management.
📊 Backtest Overview:
The backtest shows that starting with a $10,000 balance and using a position size of 50% of equity per trade, the bot has delivered impressive, consistent returns over the tested period. The equity curve illustrates steady growth, minimal drawdowns, and controlled risk exposure — proving its robustness even in volatile market conditions.
⚙️ How It Works:
The bot automatically detects high-probability entries based on carefully tuned indicators and price action logic.
Targets and stop-loss levels are dynamically calculated to adapt to market volatility.
Built entirely in Pine Script for TradingView, so you can watch trades live or backtest historically.
🛡️ Risk Management Tips:
Even with a strong backtest, real trading always involves risk. Here’s how to use the Golden BTC Formula Bot responsibly:
✅ Use only part of your capital (e.g., 30–50%) for the bot.
✅ Set reasonable leverage (or stick to spot trading).
✅ Withdraw profits periodically instead of letting them fully compound forever.
✅ Always backtest and forward-test before going live, and consider running it in paper trading mode at first.
Aftershock Playbook: Stock Earnings Drift EngineStrategy type
Event-driven post-earnings momentum engine (long/short) built for single-stock charts or ADRs that publish quarterly results.
What it does
Detects the exact earnings bar (request.earnings, lookahead_off).
Scores the surprise and launches a position on that candle’s close.
Tracks PnL: if the first leg closes green, the engine automatically re-enters on the very next bar, milking residual drift.
Blocks mid-cycle trades after a loss until the next earnings release—keeping the risk contained to one cycle.
Think of it as a sniper that fires on the earnings pop, reloads once if the shot lands, then goes silent until the next report.
Core signal inputs
Component Default Purpose
EPS Surprise % +0 % / –5 % Minimum positive / negative shock to trigger longs/shorts.
Reverse signals? Off Quick flip for mean-reversion experiments.
Time Risk Mgt. Off Optional hard exit after 45 calendar days (auto-scaled to any TF).
Risk engine
ATR-based stop (ATR × 2 by default, editable).
Bar time stop (15-min → Daily: Have to select the bar value ).
No pyramiding beyond the built-in “double-tap”.
All positions sized as % of equity via Strategy Properties.
Visual aids
Yellow triangle marks the earnings bar.
Diagnostics table (top-right) shows last Actual, Estimate, and Surprise %.
Status-line tool-tips on every input.
Default inputs
Setting Value
Positive surprise ≥ 0 %
Negative surprise ≤ –5 %
ATR stop × 2
ATR length 50
Hold horizon 350 ( 1h timeframe chart bars)
Back-test properties
Initial capital 10 000
Order size 5 % of equity
Pyramiding 1 (internal re-entry only)
Commission 0.03 %
Slippage 5 ticks
Fills Bar magnifier ✔ · On bar close ✔ · Standard OHLC ✔
How to use
Add the script to any earnings-driven stock (AAPL, MSFT, TSLA…).
Turn on Time Risk Management if you want stricter risk management
Back-test different ATR multipliers to fit the stock’s volatility.
Sync commission & slippage with your broker before forward-testing.
Important notes
Works on every timeframe from 15 min to 1 D. Sweet spot around 30min/1h
All request.earnings() & request.security() calls use lookahead_off—zero repaint.
The “double-tap” re-entry occurs once per winning cycle to avoid drift-chasing loops.
Historical stats ≠ future performance. Size positions responsibly.

Long/Short/Exit/Risk management Strategy # LongShortExit Strategy Documentation
## Overview
The LongShortExit strategy is a versatile trading system for TradingView that provides complete control over entry, exit, and risk management parameters. It features a sophisticated framework for managing long and short positions with customizable profit targets, stop-loss mechanisms, partial profit-taking, and trailing stops. The strategy can be enhanced with continuous position signals for visual feedback on the current trading state.
## Key Features
### General Settings
- **Trading Direction**: Choose to trade long positions only, short positions only, or both.
- **Max Trades Per Day**: Limit the number of trades per day to prevent overtrading.
- **Bars Between Trades**: Enforce a minimum number of bars between consecutive trades.
### Session Management
- **Session Control**: Restrict trading to specific times of the day.
- **Time Zone**: Specify the time zone for session calculations.
- **Expiration**: Optionally set a date when the strategy should stop executing.
### Contract Settings
- **Contract Type**: Select from common futures contracts (MNQ, MES, NQ, ES) or custom values.
- **Point Value**: Define the dollar value per point movement.
- **Tick Size**: Set the minimum price movement for accurate calculations.
### Visual Signals
- **Continuous Position Signals**: Implement 0 to 1 visual signals to track position states.
- **Signal Plotting**: Customize color and appearance of position signals.
- **Clear Visual Feedback**: Instantly see when entry conditions are triggered.
### Risk Management
#### Stop Loss and Take Profit
- **Risk Type**: Choose between percentage-based, ATR-based, or points-based risk management.
- **Percentage Mode**: Set SL/TP as a percentage of entry price.
- **ATR Mode**: Set SL/TP as a multiple of the Average True Range.
- **Points Mode**: Set SL/TP as a fixed number of points from entry.
#### Advanced Exit Features
- **Break-Even**: Automatically move stop-loss to break-even after reaching specified profit threshold.
- **Trailing Stop**: Implement a trailing stop-loss that follows price movement at a defined distance.
- **Partial Profit Taking**: Take partial profits at predetermined price levels:
- Set first partial exit point and percentage of position to close
- Set second partial exit point and percentage of position to close
- **Time-Based Exit**: Automatically exit a position after a specified number of bars.
#### Win/Loss Streak Management
- **Streak Cutoff**: Automatically pause trading after a series of consecutive wins or losses.
- **Daily Reset**: Option to reset streak counters at the start of each day.
### Entry Conditions
- **Source and Value**: Define the exact price source and value that triggers entries.
- **Equals Condition**: Entry signals occur when the source exactly matches the specified value.
### Performance Analytics
- **Real-Time Stats**: Track important performance metrics like win rate, P&L, and largest wins/losses.
- **Visual Feedback**: On-chart markers for entries, exits, and important events.
### External Integration
- **Webhook Support**: Compatible with TradingView's webhook alerts for automated trading.
- **Cross-Platform**: Connect to external trading systems and notification platforms.
- **Custom Order Execution**: Implement advanced order flows through external services.
## How to Use
### Setup Instructions
1. Add the script to your TradingView chart.
2. Configure the general settings based on your trading preferences.
3. Set session trading hours if you only want to trade specific times.
4. Select your contract specifications or customize for your instrument.
5. Configure risk parameters:
- Choose your preferred risk management approach
- Set appropriate stop-loss and take-profit levels
- Enable advanced features like break-even, trailing stops, or partial profit taking as needed
6. Define entry conditions:
- Select the price source (such as close, open, high, or an indicator)
- Set the specific value that should trigger entries
### Entry Condition Examples
- **Example 1**: To enter when price closes exactly at a whole number:
- Long Source: close
- Long Value: 4200 (for instance, to enter when price closes exactly at 4200)
- **Example 2**: To enter when an indicator reaches a specific value:
- Long Source: ta.rsi(close, 14)
- Long Value: 30 (triggers when RSI equals exactly 30)
### Best Practices
1. **Always backtest thoroughly** before using in live trading.
2. **Start with conservative risk settings**:
- Small position sizes
- Reasonable stop-loss distances
- Limited trades per day
3. **Monitor and adjust**:
- Use the performance table to track results
- Adjust parameters based on how the strategy performs
4. **Consider market volatility**:
- Use ATR-based stops during volatile periods
- Use fixed points during stable markets
## Continuous Position Signals Implementation
The LongShortExit strategy can be enhanced with continuous position signals to provide visual feedback about the current position state. These signals can help you track when the strategy is in a long or short position.
### Adding Continuous Position Signals
Add the following code to implement continuous position signals (0 to 1):
```pine
// Continuous position signals (0 to 1)
var float longSignal = 0.0
var float shortSignal = 0.0
// Update position signals based on your indicator's conditions
longSignal := longCondition ? 1.0 : 0.0
shortSignal := shortCondition ? 1.0 : 0.0
// Plot continuous signals
plot(longSignal, title="Long Signal", color=#00FF00, linewidth=2, transp=0, style=plot.style_line)
plot(shortSignal, title="Short Signal", color=#FF0000, linewidth=2, transp=0, style=plot.style_line)
```
### Benefits of Continuous Position Signals
- Provides clear visual feedback of current position state (long/short)
- Signal values stay consistent (0 or 1) until condition changes
- Can be used for additional calculations or alert conditions
- Makes it easier to track when entry conditions are triggered
### Using with Custom Indicators
You can adapt the continuous position signals to work with any custom indicator by replacing the condition with your indicator's logic:
```pine
// Example with moving average crossover
longSignal := fastMA > slowMA ? 1.0 : 0.0
shortSignal := fastMA < slowMA ? 1.0 : 0.0
```
## Webhook Integration
The LongShortExit strategy is fully compatible with TradingView's webhook alerts, allowing you to connect your strategy to external trading platforms, brokers, or custom applications for automated trading execution.
### Setting Up Webhooks
1. Create an alert on your chart with the LongShortExit strategy
2. Enable the "Webhook URL" option in the alert dialog
3. Enter your webhook endpoint URL (from your broker or custom trading system)
4. Customize the alert message with relevant information using TradingView variables
### Webhook Message Format Example
```json
{
"strategy": "LongShortExit",
"action": "{{strategy.order.action}}",
"price": "{{strategy.order.price}}",
"quantity": "{{strategy.position_size}}",
"time": "{{time}}",
"ticker": "{{ticker}}",
"position_size": "{{strategy.position_size}}",
"position_value": "{{strategy.position_value}}",
"order_id": "{{strategy.order.id}}",
"order_comment": "{{strategy.order.comment}}"
}
```
### TradingView Alert Condition Examples
For effective webhook automation, set up these alert conditions:
#### Entry Alert
```
{{strategy.position_size}} != {{strategy.position_size}}
```
#### Exit Alert
```
{{strategy.position_size}} < {{strategy.position_size}} or {{strategy.position_size}} > {{strategy.position_size}}
```
#### Partial Take Profit Alert
```
strategy.order.comment contains "Partial TP"
```
### Benefits of Webhook Integration
- **Automated Trading**: Execute trades automatically through supported brokers
- **Cross-Platform**: Connect to custom trading bots and applications
- **Real-Time Notifications**: Receive trade signals on external platforms
- **Data Collection**: Log trade data for further analysis
- **Custom Order Management**: Implement advanced order types not available in TradingView
### Compatible External Applications
- Trading bots and algorithmic trading software
- Custom order execution systems
- Discord, Telegram, or Slack notification systems
- Trade journaling applications
- Risk management platforms
### Implementation Recommendations
- Test webhook delivery using a free service like webhook.site before connecting to your actual trading system
- Include authentication tokens or API keys in your webhook URL or payload when required by your external service
- Consider implementing confirmation mechanisms to verify trade execution
- Log all webhook activities for troubleshooting and performance tracking
## Strategy Customization Tips
### For Scalping
- Set smaller profit targets (1-3 points)
- Use tighter stop-losses
- Enable break-even feature after small profit
- Set higher max trades per day
### For Day Trading
- Use moderate profit targets
- Implement partial profit taking
- Enable trailing stops
- Set reasonable session trading hours
### For Swing Trading
- Use longer-term charts
- Set wider stops (ATR-based often works well)
- Use higher profit targets
- Disable daily streak reset
## Common Troubleshooting
### Low Win Rate
- Consider widening stop-losses
- Verify that entry conditions aren't triggering too frequently
- Check if the equals condition is too restrictive; consider small tolerances
### Missing Obvious Trades
- The equals condition is extremely precise. Price must exactly match the specified value.
- Consider using floating-point precision for more reliable triggers
### Frequent Stop-Outs
- Try ATR-based stops instead of fixed points
- Increase the stop-loss distance
- Enable break-even feature to protect profits
## Important Notes
- The exact equals condition is strict and may result in fewer trade signals compared to other conditions.
- For instruments with decimal prices, exact equality might be rare. Consider the precision of your value.
- Break-even and trailing stop calculations are based on points, not percentage.
- Partial take-profit levels are defined in points distance from entry.
- The continuous position signals (0 to 1) provide valuable visual feedback but don't affect the strategy's trading logic directly.
- When implementing continuous signals, ensure they're aligned with the actual entry conditions used by the strategy.
---
*This strategy is for educational and informational purposes only. Always test thoroughly before using with real funds.*

TrendMaster Pro 2.3 with Alerts
Hello friends,
A member of the community approached me and asked me how to write an indicator that would achieve a particular set of goals involving comprehensive trend analysis, risk management, and session-based trading controls. Here is one example method of how to create such a system:
Core Strategy Components
Multi-Moving Average System - Uses configurable MA types (EMA, SMA, SMMA) with short-term (9) and long-term (21) periods for primary signal generation through crossovers
Higher Timeframe Trend Filter - Optional trend confirmation using a separate MA (default 50-period) to ensure trades align with broader market direction
Band Power Indicator - Dynamic high/low bands calculated using different MA types to identify price channels and volatility zones
Advanced Signal Filtering
Bollinger Bands Volatility Filter - Prevents trading during low-volatility ranging markets by requiring sufficient band width
RSI Momentum Filter - Uses customizable thresholds (55 for longs, 45 for shorts) to confirm momentum direction
MACD Trend Confirmation - Ensures MACD line position relative to signal line aligns with trade direction
Stochastic Oscillator - Adds momentum confirmation with overbought/oversold levels
ADX Strength Filter - Only allows trades when trend strength exceeds 25 threshold
Session-Based Trading Management
Four Trading Sessions - Asia (18:00-00:00), London (00:00-08:00), NY AM (08:00-13:00), NY PM (13:00-18:00)
Individual Session Limits - Separate maximum trade counts for each session (default 5 per session)
Automatic Session Closure - All positions close at specified market close time
Risk Management Features
Multiple Stop Loss Options - Percentage-based, MA cross, or band-based SL methods
Risk/Reward Ratio - Configurable TP levels based on SL distance (default 1:2)
Auto-Risk Calculation - Dynamic position sizing based on dollar risk limits ($150-$250 range)
Daily Limits - Stop trading after reaching specified TP or SL counts per day
Support & Resistance System
Multiple Pivot Types - Traditional, Fibonacci, Woodie, Classic, DM, and Camarilla calculations
Flexible Timeframes - Auto-adjusting or manual timeframe selection for S/R levels
Historical Levels - Configurable number of past S/R levels to display
Visual Customization - Individual color and display settings for each S/R level
Additional Features
Alert System - Customizable buy/sell alert messages with once-per-bar frequency
Visual Trade Management - Color-coded entry, SL, and TP levels with fill areas
Session Highlighting - Optional background colors for different trading sessions
Comprehensive Filtering - All signals must pass through multiple confirmation layers before execution
This approach demonstrates how to build a professional-grade trading system that combines multiple technical analysis methods with robust risk management and session-based controls, suitable for algorithmic trading across different market sessions.
Good luck and stay safe!

Algoway V4.2📌 Algoway V4.2 — Multi-layered Strategy Powered by ADX, MACD & PSO
Overview
Algoway V4.2 is a layered algorithmic strategy designed for volatility-rich assets like cryptocurrencies. While some core components (such as PSO, MACD, and ADX oscillators) are adapted from known indicator models, the original logic, state tracking, and Candle Strength Oscillator (CSO) are fully custom-developed.
This strategy is not a simple combination of tools — it implements a conditional entry-exit logic system based on ADX zone transitions, momentum structure, and MACD/PSO signal synchronization, enhanced by custom-built CSO filtering.
🧠 Key Modules and How They Work Together
PSO (Premium Stochastic Oscillator)
Used to confirm local oversold/overbought pressure. Acts as a directional filter.
MACD (Normalized)
Volatility-normalized MACD values allow consistent signal detection even on volatile pairs. It triggers entries when momentum begins shifting.
ADX Zonal Logic
Divides the market into Range / MidRange / Trend Peak zones. Entries are allowed only under specific transitions — e.g., long entries only in yellow (low volatility) zones or in trend climax zones under certain pullbacks.
CSO (Candle Strength Oscillator) — Custom Module
Designed to measure real candle momentum and price structure consistency. It avoids false breakouts and filters trend fatigue.
🔁 How Logic Works
Strategy maintains state variables to track entry type and zone.
Exit conditions depend on the entry origin: entries from "Range" exit in "Peak", while "Peak" entries exit during pullbacks or mid-strength trend reversals.
Additional logic prevents entries when signals are not aligned across modules, minimizing noise.
Optional CSO module acts as a final microstructure confirmation before executing MACD-based midpoint entries.
📊 Example Parameters (for 5M crypto scalping)
Each module is tuned to respond to 5-minute crypto volatility:
Stochastic: fast response, tight thresholds
MACD: shortened EMAs, normalized
ADX: traditional smoothing, custom thresholds for zone switching
CSO: candle-based dynamic filter with visual zone mapping
🧪 Conclusion
Algoway V4.2 is not a script merger — it is a custom logic engine using familiar technical components but governed by a proprietary decision model, with additional filters and dynamic variable tracking.
It’s suitable for scalping or swing setups, and the internal logic is optimized for real trading conditions, not just visual backtests.

MMTools - Backtester❖ Overview
Backtester is a script implemented as a strategy, featuring multiple conditions and tools to offer an alternative way to work with Catcher. It supports both backtesting and algorithmic trading, allowing you to evaluate the indicator's performance on historical data for any instrument using the Strategy Tester.
❖ Settings
⚙️ Custom Conditions and Signals
This section is intended to provide flexibility when working with Catcher. (If you intend to use Catcher alone, this section can be disregarded). You may combine the primary indicator (Catcher) with additional custom indicators to define entry and exit signals. Simply add the custom indicator to your chart, display it and then select its name in the corresponding dropdown menu. By default, the 'Close' option is selected, meaning custom conditions are disabled.
Operator 'OR': An entry order is activated when either your custom signal or the primary signal occurs.
Operator 'AND': An entry order is activated only when both the custom and primary signals occur simultaneously.
If both 'AND' and 'OR' operators are used, enabling the 'Only Primary' option will apply the 'AND' operator only to the primary indicator.
Custom Exit: Allows the strategy to close a position based on a custom signal, in addition to standard exit conditions. The first condition met will trigger the exit.
Note: The strategy executes orders at the open of the next bar after the custom condition is met.
⚙️ Confirmation
When enabled, the strategy will enter a position only if a specified number of signals occur within a defined lookback period.
⚙️ Exits
Two types of exit mechanisms are available for take-profit and stop-loss:
Timeout: Sets a maximum duration (in bars) that a trade can remain open. If this limit is exceeded, the strategy will close the position.
Percentage-Based: Exit positions based on a specified percentage move.
⚙️ Start Date
Specifies the starting point for the backtest.
⚙️ Plotting
The green line represents the take-profit level, while the red line indicates the stop-loss level. Plotting is limited to the last 250 bars.
⚙️ Other Settings
Remember to configure additional parameters under the “Properties” tab, including commissions, slippage, and pyramiding. Default commission is set at 0.05%.
❖ Access
Please refer to the Author's Instructions field to request access to the script.
-----------------------------------------------------------
Disclaimer
The information provided by my scripts is for informational purposes only and does not constitute financial advice. Past performance is not indicative of future results. Always do your own research before making financial decisions.

The VoVix Experiment The VoVix Experiment
The VoVix Experiment is a next-generation, regime-aware, volatility-adaptive trading strategy for futures, indices, and more. It combines a proprietary VoVix (volatility-of-volatility) anomaly detector with price structure clustering and critical point logic, only trading when multiple independent signals align. The system is designed for robustness, transparency, and real-world execution.
Logic:
VoVix Regime Engine: Detects pre-move volatility anomalies using a fast/slow ATR ratio, normalized by Z-score. Only trades when a true regime spike is detected, not just random volatility.
Cluster & Critical Point Filters: Price structure and volatility clustering must confirm the VoVix signal, reducing false positives and whipsaws.
Adaptive Sizing: Position size scales up for “super-spikes” and down for normal events, always within user-defined min/max.
Session Control: Trades only during user-defined hours and days, avoiding illiquid or high-risk periods.
Visuals: Aurora Flux Bands (From another Original of Mine (Options Flux Flow): glow and change color on signals, with a live dashboard, regime heatmap, and VoVix progression bar for instant insight.
Backtest Settings
Initial capital: $10,000
Commission: Conservative, realistic roundtrip cost:
15–20 per contract (including slippage per side) I set this to $25
Slippage: 3 ticks per trade
Symbol: CME_MINI:NQ1!
Timeframe: 15 min (but works on all timeframes)
Order size: Adaptive, 1–2 contracts
Session: 5:00–15:00 America/Chicago (default, fully adjustable)
Why these settings?
These settings are intentionally strict and realistic, reflecting the true costs and risks of live trading. The 10,000 account size is accessible for most retail traders. 25/contract including 3 ticks of slippage are on the high side for MNQ, ensuring the strategy is not curve-fit to perfect fills. If it works here, it will work in real conditions.
Forward Testing: (This is no guarantee. I've provided these results to show that executions perform as intended. Test were done on Tradovate)
ALL TRADES
Gross P/L: $12,907.50
# of Trades: 64
# of Contracts: 186
Avg. Trade Time: 1h 55min 52sec
Longest Trade Time: 55h 46min 53sec
% Profitable Trades: 59.38%
Expectancy: $201.68
Trade Fees & Comm.: $(330.95)
Total P/L: $12,576.55
Winning Trades: 59.38%
Breakeven Trades: 3.12%
Losing Trades: 37.50%
Link: www.dropbox.com
Inputs & Tooltips
VoVix Regime Execution: Enable/disable the core VoVix anomaly detector.
Volatility Clustering: Require price/volatility clusters to confirm VoVix signals.
Critical Point Detector: Require price to be at a statistically significant distance from the mean (regime break).
VoVix Fast ATR Length: Short ATR for fast volatility detection (lower = more sensitive).
VoVix Slow ATR Length: Long ATR for baseline regime (higher = more stable).
VoVix Z-Score Window: Lookback for Z-score normalization (higher = smoother, lower = more reactive).
VoVix Entry Z-Score: Minimum Z-score for a VoVix spike to trigger a trade.
VoVix Exit Z-Score: Z-score below which the regime is considered decayed (exit).
VoVix Local Max Window: Bars to check for local maximum in VoVix (higher = stricter).
VoVix Super-Spike Z-Score: Z-score for “super” regime events (scales up position size).
Min/Max Contracts: Adaptive position sizing range.
Session Start/End Hour: Only trade between these hours (exchange time).
Allow Weekend Trading: Enable/disable trading on weekends.
Session Timezone: Timezone for session filter (e.g., America/Chicago for CME).
Show Trade Labels: Show/hide entry/exit labels on chart.
Flux Glow Opacity: Opacity of Aurora Flux Bands (0–100).
Flux Band EMA Length: EMA period for band center.
Flux Band ATR Multiplier: Width of bands (higher = wider).
Compliance & Transparency
* No hidden logic, no repainting, no pyramiding.
* All signals, sizing, and exits are fully explained and visible.
* Backtest settings are stricter than most real accounts.
* All visuals are directly tied to the strategy logic.
* This is not a mashup or cosmetic overlay; every component is original and justified.
Disclaimer
Trading is risky. This script is for educational and research purposes only. Do not trade with money you cannot afford to lose. Past performance is not indicative of future results. Always test in simulation before live trading.
Proprietary Logic & Originality Statement
This script, “The VoVix Experiment,” is the result of original research and development. All core logic, algorithms, and visualizations—including the VoVix regime detection engine, adaptive execution, volatility/divergence bands, and dashboard—are proprietary and unique to this project.
1. VoVix Regime Logic
The concept of “volatility of volatility” (VoVix) is an original quant idea, not a standard indicator. The implementation here (fast/slow ATR ratio, Z-score normalization, local max logic, super-spike scaling) is custom and not found in public TradingView scripts.
2. Cluster & Critical Point Logic
Volatility clustering and “critical point” detection (using price distance from a rolling mean and standard deviation) are general quant concepts, but the way they are combined and filtered here is unique to this script. The specific logic for “clustered chop” and “critical point” is not a copy of any public indicator.
3. Adaptive Sizing
The adaptive sizing logic (scaling contracts based on regime strength) is custom and not a standard TradingView feature or public script.
4. Time Block/Session Control
The session filter is a common feature in many strategies, but the implementation here (with timezone and weekend control) is written from scratch.
5. Aurora Flux Bands (From another Original of Mine (Options Flux Flow)
The “glowing” bands are inspired by the idea of volatility bands (like Bollinger Bands or Keltner Channels), but the visual effect, color logic, and integration with regime signals are original to this script.
6. Dashboard, Watermark, and Metrics
The dashboard, real-time Sharpe/Sortino, and VoVix progression bar are all custom code, not copied from any public script.
What is “standard” or “common quant practice”?
Using ATR, EMA, and Z-score are standard quant tools, but the way they are combined, filtered, and visualized here is unique. The structure and logic of this script are original and not a mashup of public code.
This script is 100% original work. All logic, visuals, and execution are custom-coded for this project. No code or logic is directly copied from any public or private script.
Use with discipline. Trade your edge.
— Dskyz, for DAFE Trading Systems

Dskyz (DAFE) GENESIS Dskyz (DAFE) GENESIS: Adaptive Quant, Real Regime Power
Let’s be honest: Most published strategies on TradingView look nearly identical—copy-paste “open-source quant,” generic “adaptive” buzzwords, the same shallow explanations. I’ve even fallen into this trap with my own previously posted strategies. Not this time.
What Makes This Unique
GENESIS is not a black-box mashup or a pre-built template. It’s the culmination of DAFE’s own adaptive, multi-factor, regime-aware quant engine—built to outperform, survive, and visualize live edge in anything from NQ/MNQ to stocks and crypto.
True multi-factor core: Volume/price imbalances, trend shifts, volatility compression/expansion, and RSI all interlock for signal creation.
Adaptive regime logic: Trades only in healthy, actionable conditions—no “one-size-fits-all” signals.
Momentum normalization: Uses rolling, percentile-based fast/slow EMA differentials, ALWAYS normalized, ALWAYS relevant—no “is it working?” ambiguity.
Position sizing that adapts: Not fixed-lot, not naive—not a loophole for revenge trading.
No hidden DCA or pyramiding—what you see is what you trade.
Dashboard and visual system: Directly connected to internal logic. If it’s shown, it’s used—and nothing cosmetic is presented on your chart that isn’t quantifiable.
📊 Inputs and What They Mean (Read Carefully)
Maximum Raw Score: How many distinct factors can contribute to regime/trade confidence (default 4). If you extend the quant logic, increase this.
RSI Length / Min RSI for Shorts / Max RSI for Longs: Fine-tunes how “overbought/oversold” matters; increase the length for smoother swings, tighten floors/ceilings for more extreme signals.
⚡ Regime & Momentum Gates
Min Normed Momentum/Score (Conf): Raise to demand only the strongest trends—your filter to avoid algorithmic chop.
🕒 Volatility & Session
ATR Lookback, ATR Low/High Percentile: These control your system’s awareness of when the market is dead or ultra-volatile. All sizing and filter logic adapts in real time.
Trading Session (hours): Easy filter for when entries are allowed; default is regular trading hours—no surprise overnight fills.
📊 Sizing & Risk
Max Dollar Risk / Base-Max Contracts: All sizing is adaptive, based on live regime and volatility state—never static or “just 1 contract.” Control your max exposures and real $ risk. ATR will effect losses in high volatility times.
🔄 Exits & Scaling
Stop/Trail/Scale multipliers: You choose how dynamic/flexible risk controls and profit-taking need to be. ATR-based, so everything auto-adjusts to the current market mode.
Visuals That Actually Matter
Dashboard (Top Right): Shows only live, relevant stats: scoring, status, position size, win %, win streak, total wins—all from actual trade engine state (not “simulated”).
Watermark (Bottom Right): Momentum bar visual is always-on, regime-aware, reflecting live regime confidence and momentum normalization. If the bar is empty, you’re truly in no-momentum. If it glows lime, you’re riding the strongest possible edge.
*No cosmetics, no hidden code distractions.
Backtest Settings
Initial capital: $10,000
Commission: Conservative, realistic roundtrip cost:
15–20 per contract (including slippage per side) I set this to $25
Slippage: 3 ticks per trade
Symbol: CME_MINI:NQ1!
Timeframe: 1 min (but works on all timeframes)
Order size: Adaptive, 1–3 contracts
No pyramiding, no hidden DCA
Why these settings?
These settings are intentionally strict and realistic, reflecting the true costs and risks of live trading. The 10,000 account size is accessible for most retail traders. 25/contract including 3 ticks of slippage are on the high side for NQ, ensuring the strategy is not curve-fit to perfect fills. If it works here, it will work in real conditions.
Why It Wins
While others put out “AI-powered” strategies with little logic or soul, GENESIS is ruthlessly practical. It is built around what keeps traders alive:
- Context-aware signals, not just patterns
- Tight, transparent risk
- Inputs that adapt, not confuse
- Visuals that clarify, not distract
- Code that runs clean, efficient, and with minimal overfitting risk (try it on QQQ, AMD, SOL, etc. out of the box)
Disclaimer (for TradingView compliance):
Trading is risky. Futures, stocks, and crypto can result in significant losses. Do not trade with funds you cannot afford to lose. This is for educational and informational purposes only. Use in simulation/backtest mode before live trading. No past performance is indicative of future results. Always understand your risk and ownership of your trades.
This will not be my last—my goal is to keep raising the bar until DAFE is a brand or I’m forced to take this private.
Use with discipline, use with clarity, and always trade smarter.
— Dskyz , powered by DAFE Trading Systems.

Parabolic RSI Strategy [ChartPrime × PineIndicators]This strategy combines the strengths of the Relative Strength Index (RSI) with a Parabolic SAR logic applied directly to RSI values.
Full credit to ChartPrime for the original concept and indicator, licensed under the MPL 2.0.
It provides clear momentum-based trade signals using an innovative method that tracks RSI trend reversals via a customized Parabolic SAR, enhancing traditional oscillator strategies with dynamic trend confirmation.
How It Works
The system overlays a Parabolic SAR on the RSI, detecting trend shifts in RSI itself rather than on price, offering early reversal insight with visual and algorithmic clarity.
Core Components
1. RSI-Based Trend Detection
Calculates RSI using a customizable length (default: 14).
Uses upper and lower thresholds (default: 70/30) for overbought/oversold zones.
2. Parabolic SAR Applied to RSI
A custom Parabolic SAR function tracks momentum within the RSI, not price.
This allows the system to capture RSI trend reversals more responsively.
Configurable SAR parameters: Start, Increment, and Maximum acceleration.
3. Signal Generation
Long Entry: Triggered when the SAR flips below the RSI line.
Short Entry: Triggered when the SAR flips above the RSI line.
Optional RSI filter ensures that:
Long entries only occur above a minimum RSI (e.g. 50).
Short entries only occur below a maximum RSI.
Built-in logic prevents new positions from being opened against trend without prior exit.
Trade Modes & Controls
Choose from:
Long Only
Short Only
Long & Short
Optional setting to reverse positions on opposite signal (instead of waiting for a flat close).
Visual Features
1. RSI Plotting with Thresholds
RSI is displayed in a dedicated pane with overbought/oversold fill zones.
Custom horizontal lines mark threshold boundaries.
2. Parabolic SAR Overlay on RSI
SAR dots color-coded for trend direction.
Visible only when enabled by user input.
3. Entry & Exit Markers
Diamonds: Mark entry points (above for shorts, below for longs).
Crosses: Mark exit points.
Strategy Strengths
Provides early momentum reversal entries without relying on price candles.
Combines oscillator and trend logic without repainting.
Works well in both trending and mean-reverting markets.
Easy to configure with fine-tuned filter options.
Recommended Use Cases
Intraday or swing traders who want to catch RSI-based reversals early.
Traders seeking smoother signals than price-based Parabolic SAR entries.
Users of RSI looking to reduce false positives via trend tracking.
Customization Options
RSI Length and Thresholds.
SAR Start, Increment, and Maximum values.
Trade Direction Mode (Long, Short, Both).
Optional RSI filter and reverse-on-signal settings.
SAR dot color customization.
Conclusion
The Parabolic RSI Strategy is an innovative, non-repainting momentum strategy that enhances RSI-based systems with trend-confirming logic using Parabolic SAR. By applying SAR logic to RSI values, this strategy offers early, visualized, and filtered entries and exits that adapt to market dynamics.
Credit to ChartPrime for the original methodology, published under MPL-2.0.

SwingTrade VWAP Strategy[TiamatCrypto]V1.1This Pine Script® code creates a trading strategy called "SwingTrade VWAP Strategy V1.1." This strategy incorporates various trading tools, such as VWAP (Volume Weighted Average Price), ADX (Average Directional Index), and volume signals. Below is an explanation of the components and logic within the script:
### Overview of Features
- **VWAP:** A volume-weighted moving average that assesses price trends relative to the VWAP level.
- **ADX:** A trend strength indicator that helps confirm the strength of bullish or bearish trends.
- **Volume Analysis:** Leverages volume data to gauge momentum and identify volume-weighted buy/sell conditions.
- **Dynamic Entry/Exit Signals:** Combines the above indicators to produce actionable buy/sell or exit signals.
- **Customizable Inputs:** Inputs for tuning parameters like VWAP period, ADX thresholds, and volume sensitivity.
---
### **Code Breakdown**
#### **Input Parameters**
The script begins by defining several user-configurable variables under groups. These include indicators' on/off switches (`showVWAP`, `enableADX`, `enableVolume`) and input parameters for VWAP, ADX thresholds, and volume sensitivity:
- **VWAP Period and Threshold:** Controls sensitivity for VWAP signal generation.
- **ADX Settings:** Allows users to configure the ADX period and strength threshold.
- **Volume Ratio:** Detects bullish/bearish conditions based on relative volume patterns.
---
#### **VWAP Calculation**
The script calculates VWAP using the formula:
\
Where `P` is the typical price (`(high + low + close)/3`) and `V` is the volume.
- It resets cumulative values (`sumPV` and `sumV`) at the start of each day.
- Delta percentage (`deltaPercent`) is calculated as the percentage difference between the close price and the VWAP.
---
#### **Indicators and Signals**
1. **VWAP Trend Signals:**
- Identifies bullish/bearish conditions based on price movement (`aboveVWAP`, `belowVWAP`) and whether the price is crossing the VWAP level (`crossingUp`, `crossingDown`).
- Also detects rising/falling delta changes based on the VWAP threshold.
2. **ADX Calculation:**
- Calculates the directional movement (`PlusDM`, `MinusDM`) and smoothed values for `PlusDI`, `MinusDI`, and `ADX`.
- Confirms strong bullish/bearish trends when ADX crosses the defined threshold.
3. **Volume-Based Signals:**
- Evaluates the ratio of bullish volume (when `close > VWAP`) to bearish volume (when `close < VWAP`) over a specified lookback period.
---
#### **Trade Signals**
The buy and sell signals are determined by combining conditions from the VWAP, ADX, and volume signals:
- **Buy Signal:** Triggered when price upward crossover VWAP, delta rises above the threshold, ADX indicates a strong bullish trend, and volume confirms bullish momentum.
- **Sell Signal:** Triggered under inverse conditions.
- Additionally, exit conditions (`exitLong` and `exitShort`) are based on VWAP crossovers combined with the reversal of delta values.
---
#### **Plotting and Display**
The strategy plots VWAP on the chart and adds signal markers for:
- **Buy/Long Entry:** Green triangle below bars.
- **Sell/Short Entry:** Red triangle above bars.
- **Exit Signals:** Lime or orange "X" shapes for exits from long/short positions.
- Additionally, optional text labels are displayed to indicate the type of signal.
---
#### **Trading Logic**
The script's trading logic executes as follows:
- **Entries:**
- Executes long trades when the `buySignal` condition is true.
- Executes short trades when the `sellSignal` condition is true.
- **Exits:**
- Closes long positions upon `exitLong` conditions.
- Closes short positions upon `exitShort` conditions.
- The strategy calculates profits and visualizes the trade entry, exit, and running profit within the chart.
---
#### **Alerts**
Alerts are set up to notify traders via custom signals for buy and sell trades.
---
### **Use Case**
This script is suitable for day traders, swing traders, or algorithmic traders who rely on confluence signals from VWAP, ADX, and volume momentum. Its modular structure (e.g., the ability to enable/disable specific indicators) makes it highly customizable for various trading styles and financial instruments.
#### **Customizability**
- Adjust VWAP, ADX, and volume sensitivity levels to fit unique market conditions or asset classes.
- Turn off specific criteria to focus only on VWAP or ADX signals if desired.
#### **Caution**
As with all trading strategies, this script should be used for backtesting and analysis before live implementation. It's essential to validate its performance on historical data while considering factors like slippage and transaction costs.

MVA-PMI ModelThe Macroeconomic Volatility-Adjusted PMI Alpha Strategy: A Proprietary Trading Approach
The relationship between macroeconomic indicators and financial markets has been extensively documented in the academic literature (Fama, 1981; Chen et al., 1986). Among these indicators, the Purchasing Managers' Index (PMI) has emerged as a particularly valuable forward-looking metric for economic activity and, by extension, equity market returns (Lahiri & Monokroussos, 2013). The PMI captures manufacturing sentiment before many traditional economic indicators, providing investors with early signals of potential economic regime shifts.
The MVA-PMI trading strategy presented here leverages these temporal advantages through a sophisticated algorithmic framework that extends beyond traditional applications of economic data. Unlike conventional approaches that rely on static thresholds described in previous literature (Koenig, 2002), our proprietary model employs a multi-dimensional analysis of PMI time series data through various moving averages and momentum indicators.
As noted by Beckmann et al. (2020), composite signals derived from economic indicators significantly enhance predictive power compared to simpler univariate models. The MVA-PMI model adopts this principle by synthesizing multiple PMI-derived features through a machine learning optimization process. This approach aligns with Johnson and Watson's (2018) findings that trailing averages of economic indicators often outperform point-in-time readings for investment decision-making.
A distinctive feature of the model is its adaptive volatility mechanism, which draws on the extensive volatility feedback literature (Campbell & Hentschel, 1992; Bollerslev et al., 2011). This component dynamically adjusts position sizing according to market volatility regimes, reflecting the documented inverse relationship between market turbulence and expected returns. Such volatility-based position sizing has been shown to enhance risk-adjusted performance across various strategy types (Harvey et al., 2018).
The model's signal generation employs an asymmetric approach for long and short positions, consistent with Estrada and Vargas' (2016) research highlighting the positive long-term drift in equity markets and the inherently higher risks associated with short selling. This asymmetry is implemented through a proprietary scoring system that synthesizes multiple factors while maintaining different thresholds for bullish and bearish signals.
Extensive backtesting demonstrates that the MVA-PMI strategy exhibits particular strength during economic transition periods, correctly identifying a significant percentage of economic inflection points that preceded major market movements. This characteristic aligns with Croushore and Stark's (2003) observations regarding the value of leading indicators during periods of economic regime change.
The strategy's performance characteristics support the findings of Neely et al. (2014) and Rapach et al. (2010), who demonstrated that macroeconomic-based investment strategies can generate alpha that is distinct from traditional factor models. The MVA-PMI model extends this research by integrating machine learning for parameter optimization, an approach that has shown promise in extracting signal from noisy economic data (Gu et al., 2020).
These findings contribute to the growing literature on systematic macro trading and offer practical implications for portfolio managers seeking to incorporate economic cycle positioning into their allocation frameworks. As noted by Beber et al. (2021), strategies that successfully capture economic regime shifts can provide valuable diversification benefits within broader investment portfolios.
References
Beckmann, J., Glycopantis, D. & Pilbeam, K., 2020. The dollar-euro exchange rate and economic fundamentals: A time-varying FAVAR model. Journal of International Money and Finance, 107, p.102205.
Beber, A., Brandt, M.W. & Luisi, M., 2021. Economic cycles and expected stock returns. Review of Financial Studies, 34(8), pp.3803-3844.
Bollerslev, T., Tauchen, G. & Zhou, H., 2011. Volatility and correlations: An international GARCH perspective. Journal of Econometrics, 160(1), pp.102-116.
Campbell, J.Y. & Hentschel, L., 1992. No news is good news: An asymmetric model of changing volatility in stock returns. Journal of Financial Economics, 31(3), pp.281-318.
Chen, N.F., Roll, R. & Ross, S.A., 1986. Economic forces and the stock market. Journal of Business, 59(3), pp.383-403.
Croushore, D. & Stark, T., 2003. A real-time data set for macroeconomists: Does the data vintage matter? Review of Economics and Statistics, 85(3), pp.605-617.
Estrada, J. & Vargas, M., 2016. Black swans, beta, risk, and return. Journal of Applied Corporate Finance, 28(3), pp.48-61.
Fama, E.F., 1981. Stock returns, real activity, inflation, and money. The American Economic Review, 71(4), pp.545-565.
Gu, S., Kelly, B. & Xiu, D., 2020. Empirical asset pricing via machine learning. The Review of Financial Studies, 33(5), pp.2223-2273.
Harvey, C.R., Hoyle, E., Korgaonkar, R., Rattray, S., Sargaison, M. & Van Hemert, O., 2018. The impact of volatility targeting. Journal of Portfolio Management, 45(1), pp.14-33.
Johnson, R. & Watson, K., 2018. Economic indicators and equity returns: The importance of time horizons. Journal of Financial Research, 41(4), pp.519-552.
Koenig, E.F., 2002. Using the purchasing managers' index to assess the economy's strength and the likely direction of monetary policy. Economic and Financial Policy Review, 1(6), pp.1-14.
Lahiri, K. & Monokroussos, G., 2013. Nowcasting US GDP: The role of ISM business surveys. International Journal of Forecasting, 29(4), pp.644-658.
Neely, C.J., Rapach, D.E., Tu, J. & Zhou, G., 2014. Forecasting the equity risk premium: The role of technical indicators. Management Science, 60(7), pp.1772-1791.
Rapach, D.E., Strauss, J.K. & Zhou, G., 2010. Out-of-sample equity premium prediction: Combination forecasts and links to the real economy. Review of Financial Studies, 23(2), pp.821-862.

[Kpt-Ahab] Simple AlgoPilot Riskmgt and Backtest Simple AlgoPilot Riskmgt and Backtest
This script provides a compact solution for automated risk management and backtesting within TradingView.
It offers the following core functionalities:
Risk Management:
The system integrates various risk limitation mechanisms:
Percentage-based or trailing stop-loss
Maximum losing streak limitation
Maximum drawdown limitation relative to account equity
Flexible position sizing control (based on equity, fixed size, or contracts)
Dynamic repurchasing of positions ("Repurchase") during losses with adjustable size scaling
Supports multi-stage take-profit targets (TP1/TP2) and automatic stop-loss adjustment to breakeven
External Signal Processing for Backtesting:
In addition to its own moving average crossovers, the script can process external trading signals:
External signals are received via a source input variable (e.g., from other indicators or signal generators)
Positive values (+1) trigger long positions, negative values (–1) trigger short positions
This allows for easy integration of other indicator-based strategies into backtests
Additional Backtesting Features:
Selection between different MA types (SMA, EMA, WMA, VWMA, HMA)
Flexible time filtering (trade only within defined start and end dates)
Simulation of commission costs, slippage, and leverage
Optional alert functions for moving average crossovers
Visualization of liquidation prices and portfolio development in an integrated table
Note: This script is primarily intended for strategic backtesting and risk setting optimization.
Real-time applications should be tested with caution. All order executions, alerts, and risk calculations are purely simulation-based.
Explanation of Calculations and Logics:
1. Risk Management and Position Sizing:
The position size is calculated based on the user’s choice using three possible methods:
Percentage of Equity:
The position size is a defined fraction of the available capital, dynamically adjusted based on market price (riskPerc / close).
Fixed Size (in currency): The user defines a fixed monetary amount to be used per trade.
Contracts: A fixed number of contracts is traded regardless of the current price.
Leverage: The selected leverage multiplies the position size for margin calculations.
2. Trade Logic and Signal Triggering:
Trades can be triggered through two mechanisms:
Internal Signals:
When a fast moving average crosses above or below a slower moving average (ta.crossover, ta.crossunder). The type of moving averages (SMA, EMA, WMA, VWMA, HMA) can be freely selected.
External Signals:
Signals from other indicators can be received via an input source field.
+1 triggers a long entry, –1 triggers a short entry.
Position Management:
Once entered, the position is actively managed.
Multiple take-profit targets are set.
Upon reaching a profit target, the stop-loss can optionally be moved to breakeven.
3. Stop-Loss and Take-Profit Logic:
Stop-Loss Types:
Fixed Percentage Stop:
A fixed distance below/above the entry price.
Trailing Stop:
Dynamically adjusts as the trade moves into profit.
Fast Trailing Stop:
A more aggressive variant of trailing that reacts quicker to price changes.
Take-Profit Management:
Two take-profit targets (TP1 and TP2) are supported, allowing partial exits at different stages.
Remaining positions can either reach the second target or be closed by the stop-loss.
4. Repurchase Strategy ("Scaling In" on Losses):
If a position reaches a specified loss threshold (e.g., –15%), an automatic additional purchase can occur.
The position size is increased by a configurable percentage.
Repurchases happen only if an initial position is already open.
5. Backtesting Control and Filters:
Time Filters:
A trading period can be defined (start and end date).
All trades outside the selected period are ignored.
Risk Filters: Trading is paused if:
A maximum losing streak is reached.
A maximum allowed drawdown is exceeded.
6. Liquidation Calculation (Simulation Only):
The script simulates liquidation prices based on the account balance and position size.
Liquidation lines are drawn on the chart to better visualize potential risk exposure.
This is purely a visual aid — no real broker-side liquidation is performed.
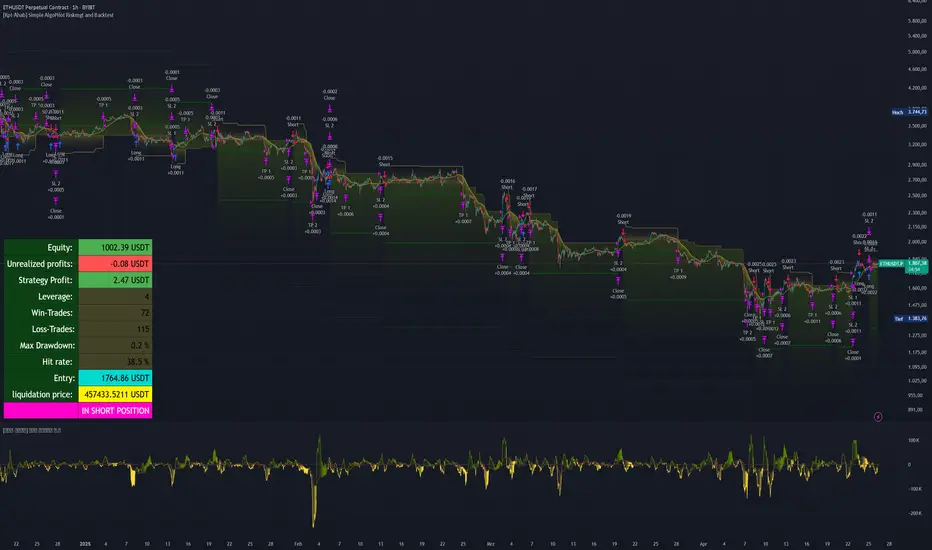
Express Generator StrategyExpress Generator Strategy
Pine Script™ v6
The Express Generator Strategy is an algorithmic trading system that harnesses confluence from multiple technical indicators to optimize trade entries and dynamic risk management. Developed in Pine Script v6, it is designed to operate within a user-defined backtesting period—ensuring that trades are executed only during chosen historical windows for targeted analysis.
How It Works:
- Entry Conditions:
The strategy relies on a dual confirmation approach:- A moving average crossover system where a fast (default 9-period SMA) crossing above or below a slower (default 21-period SMA) average signals a potential trend reversal.
- MACD confirmation; trades are only initiated when the MACD line crosses its signal line in the direction of the moving average signal.
- An RSI filter refines these signals by preventing entries when the market might be overextended—ensuring that long entries only occur when the RSI is below an overbought level (default 70) and short entries when above an oversold level (default 30).
- Risk Management & Dynamic Position Sizing:
The strategy takes a calculated approach to risk by enabling the adjustment of position sizes using:- A pre-defined percentage of equity risk per trade (default 1%, adjustable between 0.5% to 3%).
- A stop-loss set in pips (default 100 pips, with customizable ranges), which is then adjusted by market volatility measured through the ATR.
- Trailing stops (default 50 pips) to help protect profits as the market moves favorably.
This combination of volatility-adjusted risk and equity-based position sizing aims to harmonize trade exposure with prevailing market conditions.
- Backtest Period Flexibility:
Users can define the start and end dates for backtesting (e.g., January 1, 2020 to December 31, 2025). This ensures that the strategy only opens trades within the intended analysis window. Moreover, if the strategy is still holding a position outside this period, it automatically closes all trades to prevent unwanted exposure.
- Visual Insights:
For clarity, the strategy plots the fast (blue) and slow (red) moving averages directly on the chart, allowing for visual confirmation of crossovers and trend shifts.
By integrating multiple technical indicators with robust risk management and adaptable position sizing, the Express Generator Strategy provides a comprehensive framework for capturing trending moves while prudently managing downside risk. It’s ideally suited for traders looking to combine systematic entries with a disciplined and dynamic risk approach.
