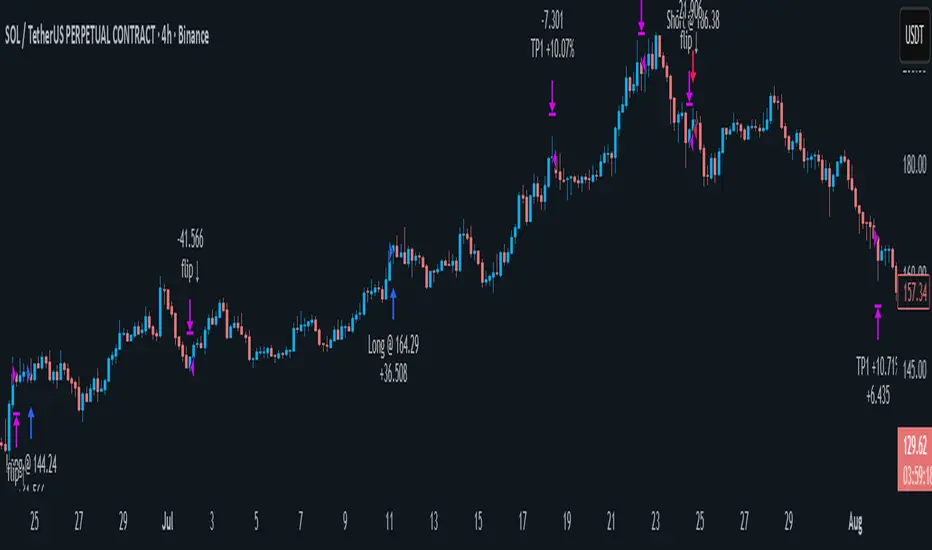
alGROWithm Premium - Strategy TesterThe alGROWithm Strategy Tester is a supplement to the original alGROWithm indicator.
Use this strategy to do your own back testing and find the best settings that work for your asset of choice.
█ WHY THIS IS IMPORTANT
Different assets require different settings for optimal results. This strategy script will allow you back test different settings for alGROWithm in order to analyze key metrics such as win rate and P/L. TradingView functionality also enables you to view a high level performance summary and even see every single individual trade made by the algo.
█ BEST PRACTICES
Depending on the asset you are testing, it is very important to update the settings as needed. For example, if you are back testing on US30, you will likely need to increase the starting capital. For other assets, you may also need to change the order size to use the Contracts option.
It is important to decide for yourself which back testing parameter you will weigh more heavily in terms of importance. For example, a day trader may want to use a setting that maximizes win rate rather than profit % since we are humans and not computers. Further, it is highly recommended to utilize all of the rich features that TradingView provides with regards to back testing. For example, using the List of Trades tab, go back to find a failed trade and analyze the trade to see if you actually would have taken it in the moment.
After finding the best sensitivity for your asset, it is important to set that sensitivity value on the non-strategy version of alGROWithm for usage. Changing settings on this version will not carry over to the non-strategy version.
█ DEFAULT SETTINGS
We have set the following default settings on the strategy:
Starting capital: $100k
Order size: 30% of equity
Sell 1/5 of position every Take Profit level
In den Scripts nach "algo" suchen

Algonize Pivot Strategy (APS)This study is based on several Price Action parameters of :-
• Pivot Points,
• Higher High and Lower Lows,
• High Low Index ,
• Support and Resistance.
► How To Use This Strategy?
This is a pure scalping strategy and it is advised to use this only with algo trading systems. Due to high trade frequency.
► This Strategy has inbuilt custom time frame backtester, which enables you to test for performance between any date or check for a single day.
► To Create Alerts for algo trading in this strategy simply Check "Activate Algo" from Settings then Create new alert , select your strategy in condition box, and now scroll down to message box and write
{{strategy.order.comment}}
That's it , Just Click on Create Alert Button
Backtest Values Used:-
Initial Capital : 1000000
Order Size (Lots) : 1 (Contract) Lots
Pyramiding : 0 orders
Commission : 0.003%
Sharpe Ratio : 1.741
Profit Factor : 1.174
Test Yourself and give feedback.
PM us to obtain access.

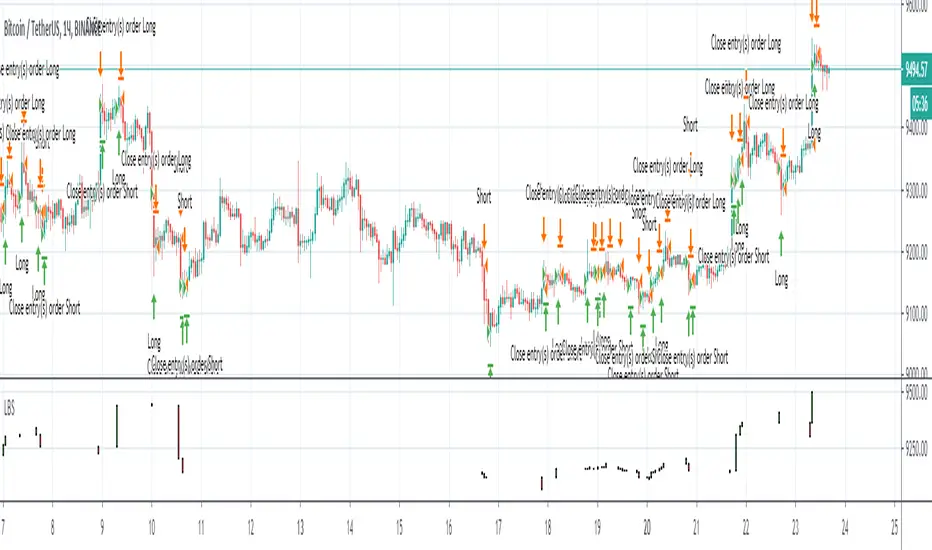
Best strategy for TradingView (fake)Hello everyone! I want to show you this strategy so you don't fall for the tricks of scammers. On TradingView, you can write an algorithm (probably more than one) that will show any profit you want: from 1% to 100,000% in one year (maybe more)! This can be done, for example, using the built-in linebreak () function and several conditions for opening long and short.
I am sure that sometimes scammers show up on TradingView showing their incredible strategies. Will a smart person sell a profitable quick strategy? When a lot of people start using the quick strategy, it stops working. Therefore, no smart person would sell you a quick strategy. It is acceptable to sell slow strategies: several transactions per month - this does not greatly affect the market.
So, don't fall for the tricks of scammers, write quick strategies yourself.
About this strategy, I can say that the linebreak () function does not work correctly in it. Accordingly, the lines are not drawn correctly on the chart. They are drawn in such a way as to show the maximum profit. I watched this algorithm on a 1m timeframe - no lines are drawn in real time. This is a fake!
T3 ICL MACD STRATEGY
Backtested manually and received approx 60% winrate. Tradingview strategy tester is skewed because this program does not specify when to sell at profit target or at a stop loss.
Uses 1 min for entry and a longer time frame for confirmation (5,10,15, etc..) (Not sure what the yellow arrows are in the picture but they can be ignored)
Ideal Long Entry - The algo uses T3 moving average (T3) and the Ichimoku Conversion Line (ICL) to determine when to enter a long or short position. In this case we are going to showcase what causes the algo to alert long. It first checks to see if the the ICL is greater than T3. Once that condition is met T3 must be green in order to enter long and finally the last closing price has to be greater than the ICL. You can use the MACD to further verify a long trend as well!
Ideal Short Entry - The algo uses T3 moving average (T3) and the Ichimoku Conversion Line (ICL) to determine when to enter a long or short position. In this case we are going to showcase what causes the algo to alert short. It first checks to see if the the ICL is less than T3. Once that condition is met T3 must be red in order to enter short and finally the last closing price has to be less than the ICL. You can use the MACD to further verify a long trend as well!

KundaliniThe Kundalini is a technical indicator. Based on algorithm calculations, this indicator extrapolates the previous price for the next bar. Plus addition Multi time frame ATR volatility Reading environment for higher conditions
Here is how Dominator is calculated:
1. The study estimates the price projected for the next bar. The estimated price is based on the algorithm method.
2. The study extrapolates this value to find a projected price change for the next bar.
The resulting extrapolated value is shown as a histogram on a lower subgraph. By default, sections of the histogram where the extrapolated value is increasing are shown in green; sections corresponding to the decreasing value are shown in red.
Note: Value projection is purely mathematical as all calculations are based on algorithm averaging of previous values.
Overlay True
The strategy includes 3 different adjustable levels for the ladder , plus automatic adjustable stop loss and takes profit calculated from your average entry price after each ladder adds.
Adjustable BAcktest Window.
1 long signals
3 ladder long add signals
1 short signals
3 ladder short add signals
1 dynamic stop calculated from your average entry price
1 dynamic take profit calculated from your average entry price
Please Private Msg me if you like more info about the script Full pdf available or if you need access to it
thx for your time and support
Dominator Ladder StrategyThe Dominator is a technical indicator. Based on algorithm calculations, this indicator extrapolates the previous price for the next bar.
Here is how Dominator is calculated:
1. The study estimates the price projected for the next bar. The estimated price is based on the algorithm method.
2. The study extrapolates this value to find a projected price change for the next bar.
The resulting extrapolated value is shown as a histogram on a lower subgraph. By default, sections of the histogram where the extrapolated value is increasing are shown in green; sections corresponding to the decreasing value are shown in red.
Note: Value projection is purely mathematical as all calculations are based on algorithm averaging of previous values.
Note: lower subgraph it's just for you to understand and view the waves during the Strategy process Study it's not included in this strategy.
Overlay True
The strategy includes 3 different adjustable levels for the ladder , plus automatic adjustable stop loss and takes profit calculated from your average entry price after each ladder adds.
Adjustable BAcktest Window.
1 long signals
3 ladder long add signals
1 short signals
3 ladder short add signals
1 dynamic stop calculated from your average entry price
1 dynamic take profit calculated from your average entry price

Detrended Price Oscillator StrategyTHIS IS THE STRATEGY VERSION
What is DPO?
A detrended price oscillator is an oscillator that strips out price trends in an effort to estimate the length of price cycles from peak to peak or trough to trough. Unlike other oscillators, such as the stochastic or moving average convergence divergence (MACD), the DPO is not a momentum indicator. It highlights peaks and troughs in price, which are used to estimate buy and sell points in line with the historical cycle.
(From Investopedia )
Indicator features:
Responds faster than the original code.
Added alternative smoothing algorithms. Defaults to Ehler's Optimum Elliptic filter instead of the orginal SMA
IPOCS - can start printing out data at day 1 instead of waiting for 14 or 20 bars
Dynamic colors
Auto timeframe detection to adjust period/length
How to use:
Buy above zero
Sell below zero
Who is it for?
Long term investors - this is the perfect indicator for those who buy and hold

CLI : micro variations strategyDisclaimer :
This script is exclusively reserved to business customers.
There's no free trial.
For any request, drop us a private message.
_____________________________________________________________
Hello TV community,
Let us present our internal script strategy :
The core algorithm focuses on micro-variations (μ.var feature) calculations.
It has been developed in order to be timeframe independent : as a consequence, μ.var feature will keep a similar value scale amongst timeframes.
Preventing from any lags, the core algorithm detects any minimal and to be considered trend change (signal feature).
It's definitely a great tool for scalpers due to its core feature (micro-variations focused).
Sincerely,
SECURIX
________________________
Risk Warning : The value of your investments can go down as well as up, so you could get back less than you invested. Past performance is no guarantee of future returns.

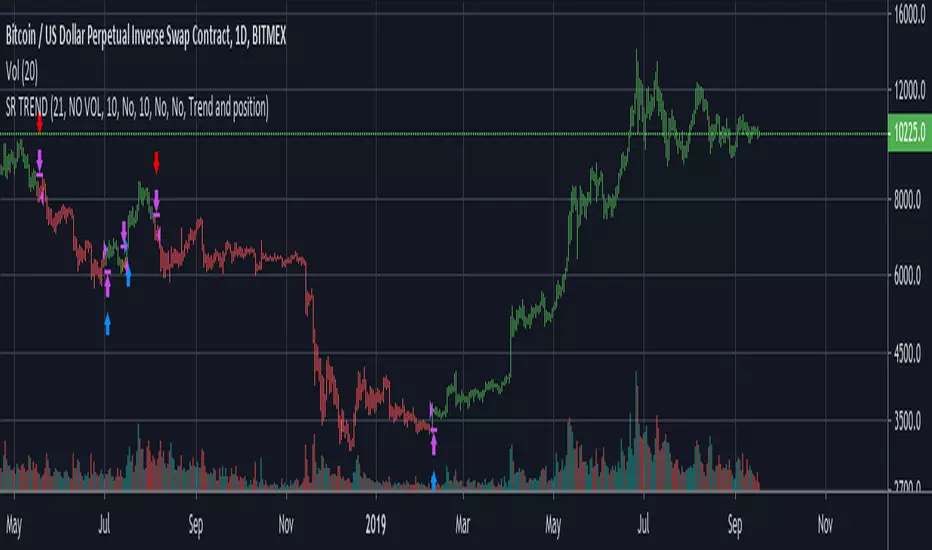
Trend SR based strategyIt is a logical continuation of my Trend SR based indicator
Algo of strategy is next
1)Detect SR levels
2)Calculate separate channels for SR made by highs and lows
3)it takes position if the current SR is breaking and close price is not in opposite channel zone
4)It closes position if prise leave current channel zone or as an option (stoploss) if SR is breaking in an opposite direction
-uses //@version=4
-no volume needed for detecting SR breaking and entering a long position
-volume confirmation of SR breaking may be used in the option section
-volume has an option to use smoothing with MA: SMA, AHMA, VIDYA
-volume has option to use volume pump as confirmation of SR breaking (simple dev function)
-stoploss as option
-uses barstate.isconfirmed (returns true if the script is calculating the last (closing) update of the current bar) for entering position on current bar close
-as an option, all or only current SR levels detected by algo can be plotted
-option to plot SR as a channel - as FILTERED whole SR history, in a long or short position it plots only stoploss level and entering opposite position level, in no position it plots long and short entering levels
It works well on 1D
For using on 4h or lower timeframes - Volume confirmation with VIDYA or AHMA may give better results
For better work especially on LTF algo needs better detection of highs and lows, now it uses fractal filter of last bars
Dompeet Pompeet (Breakout bot)Dompeet Pompeet is my first attempt at a viable swingtrading algo.
It uses volatility and some trend analysis to enter trade when the market is about to breakout or break down. Having a trailing stop locks in profits and prevents runaway losses for low drawdown and 2:1 profit factor.
Settings to use:
BTCUSD or XBTUSD
4hr Timeframe or 2hr or 1hr (not shorter)
Bars window: 13, 16 or 20 bars
Moving average settings: 100/10 EMA to confirm trend
Trade the Trend - check on to only take trades long in a confirmed uptrend (vice versa short), otherwise it will attempt to buy and sell counter trend, which increases profits but also increases loss rate.
Trailing stop, values from 2-5% give the best results.
Take with a pinch of salt, there are some bugs in pine script which are difficult to track down but overall I'm pleased with the idea.

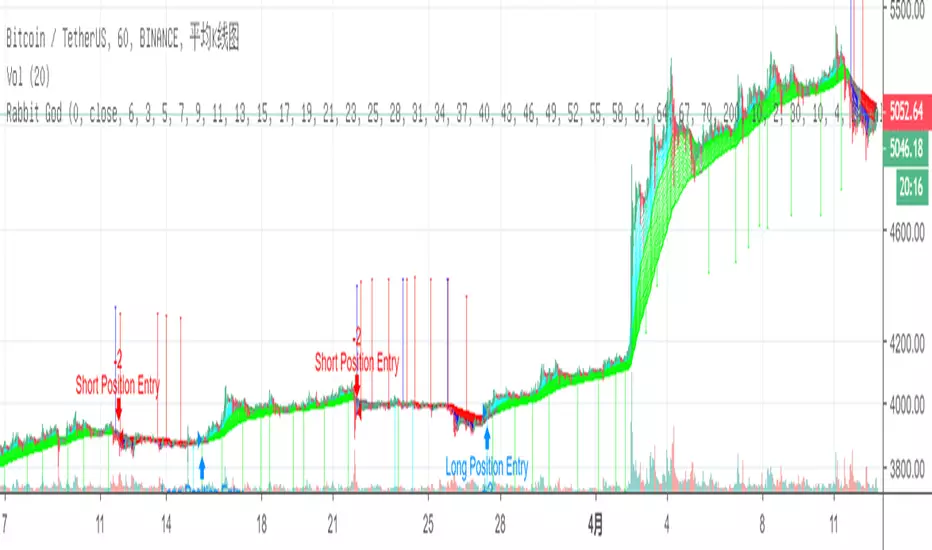
Trend tracking strategy of proprietary traders-RabbitThis is my latest strategy integration. It is a combination of trend tracking strategy and visualization trend. I believe it will bring you a clear trend discrimination and relatively reliable trading signal hints.
(Note: This strategy parameter has special parameter debugging and Optimization for BTC1h/BIANACE Heikin-ashi chart. It works best here. Other trade pairs or parameter versions of investment targets will be published specially if necessary.)
Statement of strategy concept:
The concept of strategy is trend tracking. The formation and continuation of trend is the product of speculation market for thousands of years. There are various strategies including CTA trend strategy, shock regression strategy, grid strategy, Martin strategy, Alpha strategy and so on. These strategies have their own merits just like different schools of Chinese knight-errant. Choose one, a master is not able to do hundreds of tricks, but to practice one trick thousands of times.
Every strategy has its own right and wrong. Trading is not violence, but a process of advancing, retreating, and making profits steadily. Therefore, the use of trend tracking strategy must overcome greed in human nature, profit and loss homology, dare to bear the shock of withdrawal in order to make a big profit when the real trend arrives. (Of course, this strategy has largely avoided filtering shocks, which will be explained later.)
Policy-building instructions:
Any trend tracking strategy can produce good results when there is a trend, so judging whether a trend strategy is good or bad depends on its withdrawal performance when it is shaking. This CTA trend tracking strategy uses Kauffman adaptive algorithm, fractal adaptive dimension, self-research algorithm and other tools, and has largely avoided filtering the signal in the shock without delay to follow the trend.
New version of the note:
The latest version adds the trend drawing of negativity, which can clearly distinguish the rising or falling or oscillating trend. However, the algorithm of strategy signal has no direct relationship with trend color. Trend color helps you to distinguish trend, and point signal helps you to refer to trade. This strategy is only a simple trading signal, risk control, warehouse management also need manual operation.
(Note: This strategy parameter has special parameter debugging and Optimization for BTC1h/BIANACE Heikin-ashi chart. It works best here. Other trade pairs or parameter versions of investment targets will be published specially if necessary.)
Good luck to all of you and a smooth deal.~

Trend tracking strategy of proprietary traders-RabbitThis is my latest strategy integration. It is a combination of trend tracking strategy and visualization trend. I believe it will bring you a clear trend discrimination and relatively reliable trading signal hints.
(Note: This strategy parameter has special parameter debugging and Optimization for BTC1h/BIANACE Heikin-ashi chart. It works best here. Other trade pairs or parameter versions of investment targets will be published specially if necessary.)
Statement of strategy concept:
The concept of strategy is trend tracking. The formation and continuation of trend is the product of speculation market for thousands of years. There are various strategies including CTA trend strategy, shock regression strategy, grid strategy, Martin strategy, Alpha strategy and so on. These strategies have their own merits just like different schools of Chinese knight-errant. Choose one, a master is not able to do hundreds of tricks, but to practice one trick thousands of times.
Every strategy has its own right and wrong. Trading is not violence, but a process of advancing, retreating, and making profits steadily. Therefore, the use of trend tracking strategy must overcome greed in human nature, profit and loss homology, dare to bear the shock of withdrawal in order to make a big profit when the real trend arrives. (Of course, this strategy has largely avoided filtering shocks, which will be explained later.)
Policy-building instructions:
Any trend tracking strategy can produce good results when there is a trend, so judging whether a trend strategy is good or bad depends on its withdrawal performance when it is shaking. This CTA trend tracking strategy uses Kauffman adaptive algorithm, fractal adaptive dimension, self-research algorithm and other tools, and has largely avoided filtering the signal in the shock without delay to follow the trend.
Additional notes for the new version:
The latest integrated version has increased the visualization of trends. It can clearly distinguish the trend of ups and downs or consolidation shocks based on chart color. However, trading signals are not calculated according to color changes, but the visualization helps you identify trends and signals help you to refer to sales.
This is only a simple trading signal strategy, and the other warehouse management and risk control need manual completion operation.
(Note: This strategy parameter has special parameter debugging and Optimization for BTC1h/BIANACE Heikin-ashi chart. It works best here. Other trade pairs or parameter versions of investment targets will be published specially if necessary.)
Good luck to all of you and a smooth deal.~
Readjusting Alpha (RA-1)The basis for this algorithm is an EMA 50/200 crossover protocol with one significant difference: it readjusts (or "learns") whether the original EMA crossover strategy is profitable based on its past performance and flips the conditions accordingly. The result is improved performance on relatively all timeframes in all statistical categories. There are options for long- and short-only trigger conditions. This algorithm is by invite only. If you have any questions about the algorithm, feel free to contact me.
Happy trades,
Sim

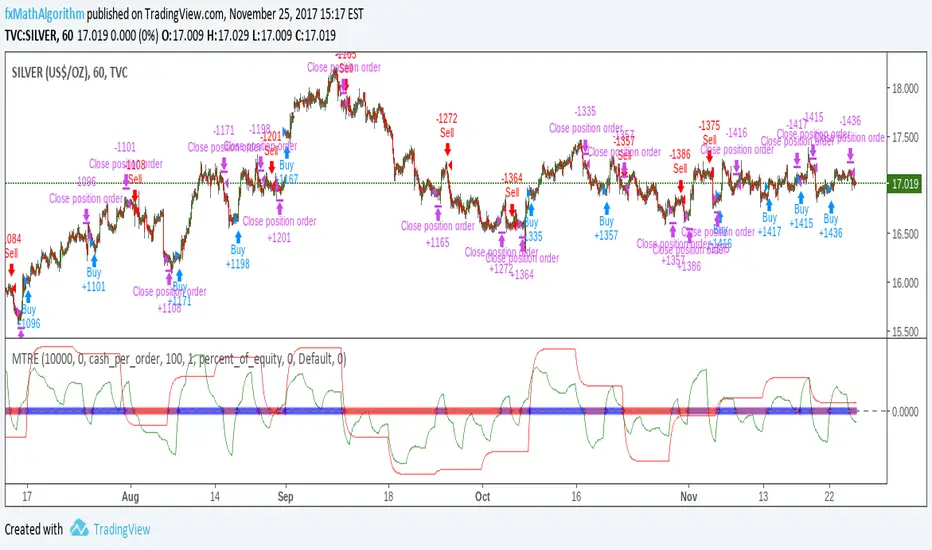
Matrix Trend Reverse EngineeringSelling algorithms.
Contact me to code your own indicators or strategy.
Strong Candle Probability Levels Tester [SYNC & TRADE]### Strategy Description: Strong Candle Probability Levels Tester
This strategy is a powerful tool for testing and visualizing probability levels based on strong candles, incorporating Volume Delta, Supertrend, and dynamic Fibonacci grids. Designed as a tester/trainer for traders analyzing price behavior around key support/resistance levels formed by strong impulse candles. It combines indicator elements for signal visualization with backtesting of trading scenarios, allowing evaluation of entry and exit effectiveness in real market conditions.
The main goal is to help traders understand how strong candles (with high volume and delta) influence subsequent price movement and test strategies based on Fibonacci extensions. It's not just an indicator but a full tester that simulates orders, stop-losses, take-profits, and advanced position management rules. Useful for beginners and experienced traders: enables practicing risk management, analyzing historical data, and optimizing approaches without real losses. Ultimately, you get visual feedback on level achievement probabilities, PNL statistics, and insights into market manipulations.
#### How the Strategy Works
The strategy identifies "strong candles" — impulse bars with elevated volume and significant delta (difference between buys and sells). Based on them, it builds a Fibonacci grid for potential entries (retracements) and exits (extensions). Additionally integrated are ATR filters for candle strength confirmation and Supertrend for trend context. The tester simulates pyramiding (adding positions), trailing stops, partial closes, and other rules to model real trading.
- **Volume Delta Analysis**: Visualizes volume deltas across timeframes to detect manipulations and impulse strength. Helpful for spotting when a candle is "strong" (high delta in the direction of movement) or "manipulative" (delta opposite to candle color).
- **Supertrend Filter**: Adds a trend indicator with an adaptive multiplier considering delta. Helps filter signals in trends, avoiding false entries.
- **Fibonacci Grid**: Automatically plots entry levels (retracements from 0% to 78.6%) and take-profits (extensions from 127.2% to 462%). The grid is "smart" — with advanced rules for profit protection and market adaptation.
The strategy does not reveal internal algorithms for strong candle detection but focuses on practical application: the tester shows how price reacts to these levels, aiding in assessing goal achievement probabilities.
#### How to Use
1. **Add to Chart**: In TradingView, select the tool, specify symbol (stocks, crypto, forex), and timeframe (recommended M5 to D1 for Volume Delta accuracy).
2. **Configure Settings**:
- **Volume Delta Section**: Enable strong candles and manipulations display. Set ATR period for filter (default 3) and minimum body size (ATR multiplier, default 0.5). This ignores weak impulses.
*(Add photo here: example chart with strong candle marked by circle and delta as colored layers on bar.)*
- **Supertrend Section**: Enable for trend filtering. Set ATR length (default 5) and multiplier (default 2.62). Delta or strong candle filter options enhance signals.
*(Photo: chart with Supertrend line colored by z-score strength and trend background.)*
- **Fibonacci Basics**: Choose direction (long/short/both), stop-loss mode (crossover or body close). Specify lot per level (default 0.1) and max active grids (default 7).
*(Photo: grid with entry and TP levels on real chart, with orders.)*
- **Advanced Rules**: Activate options like protection at 161.8%/261.8%, grid lock after 127.2%, trailing after TP1, partial close on pullback, pyramiding, time/momentum exits, or "news". This simulates complex scenarios.
- **Risk Management**: Enable exposure limit (max entry amount in USD) for safe testing.
*(Photo: PNL and risk stats in strategy table.)*
- **Entry/TP Levels**: Enable desired Fibonacci levels (retracements for entries, extensions for TP).
*(Photo: full grid with filled orders and partial TP.)*
- **Visualization**: Enable grid level display for clarity.
*(Photo: multiple grids on chart with base price and SL lines.)*
3. **Interpret Signals**:
- **Strong Candle**: Marked by circle (blue for long, red for short). Z-label in circle shows strength (2+ for significant).
- **Manipulation**: Cross (X) indicates potential trap (delta opposite to candle).
- **Grid**: Forms on strong candle. Entries — limit orders on retracements, TP on extensions. Monitor fills and closes in strategy report.
- **Supertrend**: Trend line with color gradation by strength (darker = stronger). Background highlights direction.
4. **Testing**:
- Run backtest in TradingView (select period, capital). Analyze metrics: PNL, drawdown, win-rate.
- Train: Change settings, observe rule impacts (e.g., trailing reduces risks but may miss profits).
- For live chart: Use as indicator for manual entries, ignoring orders.
#### Purpose and Benefits
This strategy is an ideal trainer for mastering probability trading based on strong candles and Fibonacci. It provides:
- **Probability Visualization**: Shows how often price hits levels (127.2%, 161.8%, etc.), helping assess risk/reward.
- **Risk Management Training**: Simulates real scenarios with pyramiding, trailing, partial closes, and exposure limits, reducing emotional errors.
- **Manipulation Analysis**: Volume Delta reveals hidden signals (weak/strong delta), useful for avoiding traps in volatile markets.
- **Trend Filter**: Supertrend with delta adaptation improves entry accuracy in trends.
- **Stats and Insights**: Report includes unrealized/realized PNL, average entry price, risk to SL. Aids in optimizing strategies for different assets.
Useful for: idea testing without risk, beginner education (visually intuitive), pro discipline improvement. Recommended to combine with other tools for signal confirmation. Remember: this is a tester, not financial advice — always demo test!

Mutanabby_AI | ONEUSDT_MR1
ONEUSDT Mean-Reversion Strategy | 74.68% Win Rate | 417% Net Profit
This is a long-only mean-reversion strategy designed specifically for ONEUSDT on the 1-hour timeframe. The core logic identifies oversold conditions following sharp declines and enters positions when selling pressure exhausts, capturing the subsequent recovery bounce.
Backtested Period: June 2019 – December 2025 (~6 years)
Performance Summary
| Metric | Value |
|--------|-------|
| Net Profit | +417.68% |
| Win Rate | 74.68% |
| Profit Factor | 4.019 |
| Total Trades | 237 |
| Sharpe Ratio | 0.364 |
| Sortino Ratio | 1.917 |
| Max Drawdown | 51.08% |
| Avg Win | +3.14% |
| Avg Loss | -2.30% |
| Buy & Hold Return | -80.44% |
Strategy Logic :
Entry Conditions (Long Only):
The strategy seeks confluence of three conditions that identify exhausted selling:
1. Prior Move Filter:*The price change from 5 bars ago to 3 bars ago must be ≥ -7% (ensures we're not entering during freefall)
2. Current Move Filter: The price change over the last 2 bars must be ≤ 0% (confirms momentum is stalling or reversing)
3. Three-Bar Decline: The price change from 5 bars ago to 3 bars ago must be ≤ -5% (confirms a significant recent drop occurred)
When all three conditions align, the strategy identifies a potential reversal point where sellers are exhausted.
Exit Conditions:
- Primary Exit: Close above the previous bar's high while the open of the previous bar is at or below the close from 9 bars ago (profit-taking on strength)
- Trailing Stop: 11x ATR trailing stop that locks in profits as price rises
Risk Management
- Position Sizing:Fixed position based on account equity divided by entry price
- Trailing Stop:11× ATR (14-period) provides wide enough room for crypto volatility while protecting gains
- Pyramiding:Up to 4 orders allowed (can scale into winning positions)
- **Commission:** 0.1% per trade (realistic exchange fees included)
Important Disclaimers
⚠️ This is NOT financial advice.
- Past performance does not guarantee future results
- Backtest results may contain look-ahead bias or curve-fitting
- Real trading involves slippage, liquidity issues, and execution delays
- This strategy is optimized for ONEUSDT specifically — results may differ on other pairs
- Always test before risking real capital
Recommended Usage
- Timeframe:*1H (as designed)
- Pair: ONEUSDT (Binance)
- Account Size: Ensure sufficient capital to survive max drawdown
Source Code
Feedback Welcome
I'm sharing this strategy freely for educational purposes. Please:
- Drop a comment with your backtesting results any you analysis
- Share any modifications that improve performance
- Let me know if you spot any issues in the logic
Happy trading
As a quant trader, do you think this strategy will survive in live trading?
Yes or No? And why?
I want to hear from you guys

Elliott Wave Full Fractal System v2.0Elliott Wave Full Fractal System v2.0 – Q.C. FINAL (Guaranteed R/R)
Elliott Wave Full Fractal System is a multi-timeframe wave engine that automatically labels Elliott impulses and ABC corrections, then builds a rule-based, ATR-driven risk/reward framework around the “W3–W4–W5” leg.
“Guaranteed R/R” here means every order is placed with a predefined stop-loss and take-profit that respect a minimum Reward:Risk ratio – it does not mean guaranteed profits.
Core Idea
This strategy turns a full fractal Elliott Wave labelling engine into a systematic trading model.
It scans fractal pivots on three wave degrees (Primary, Intermediate, Minor) to detect 5-wave impulses and ABC corrections.
A separate “Trading Degree” pivot stream, filtered by a 200-EMA trend filter and ATR-based dynamic pivots, is then used to find W4 pullback entries with a minimum, user-defined Reward:Risk ratio.
Default Properties & Risk Assumptions
The backtest uses realistic but conservative defaults:
// Default properties used for backtesting
strategy(
"Elliott Wave Full Fractal System - Q.C. FINAL (Guaranteed R/R)",
overlay = true,
initial_capital = 10000, // realistic account size
default_qty_type = strategy.percent_of_equity,
default_qty_value = 1, // 1% risk per trade
commission_type = strategy.commission.cash_per_contract,
commission_value = 0.005, // example stock commission
slippage = 0 // see notes below
)
Account size: 10,000 (can be changed to match your own account).
Position sizing: 1% of equity per trade to keep risk per idea sustainable and aligned with TradingView’s recommendations.
Commission: 0.005 cash per contract/share as a realistic example for stock trading.
Slippage: set to 0 in code for clarity of “pure logic” backtesting. Real-life trading will experience slippage, so users should adjust this according to their market and broker.
Always re-run the backtest after changing any of these values, and avoid using high risk fractions (5–10%+) as that is rarely sustainable.
1. Full Fractal Wave Engine
The script builds and maintains four pivot streams using ATR-adaptive fractals:
Primary Degree (Macro Trend):
Captures the large swings that define the major trend. Labels ①–⑤ and ⒶⒷⒸ using blue “Circle” labels and thicker lines.
Intermediate Degree (Trading Degree):
Captures the medium swings (swing-trading horizon). Uses teal labels ( (1)…(5), (A)(B)(C) ).
Minor Degree (Micro Structure):
Tracks short-term swings inside the larger waves. Uses red roman numerals (i…v, a b c).
ABC Corrections (Optional):
When enabled, the engine tries to detect standard A–B–C corrective structures that follow a completed 5-wave impulse and plots them with dashed lines.
Each degree uses a dynamic pivot lookback that expands when ATR is above its EMA, so the system naturally requires “stronger” pivots in volatile environments and reacts faster in quiet conditions.
2. Theory Rules & Strict Mode
Normal Mode: More permissive detection. Designed to show more wave structures for educational / exploratory use.
Strict Mode: Enforces key Elliott constraints:
Wave 3 not shorter than waves 1 and 5.
No invalid W4 overlap with W1 (for standard impulses).
ABC Logic: After a confirmed bullish impulse, the script expects a down-up-down corrective pattern (A,B,C). After a bearish impulse, it looks for up-down-up.
3. Trend Filter & Pivots
EMA Trend Filter: A configurable EMA (default 200) is used as a non-wave trend filter.
Price above EMA → Only long setups are considered.
Price below EMA → Only short setups are considered.
ATR-Adaptive Pivots: The pivot engine scales its left/right bars based on current ATR vs ATR EMA, making waves and trading pivots more robust in volatile regimes.
4. Dynamic Risk Management (Guaranteed R/R Engine)
The trading engine is designed around risk, not just pattern recognition:
ATR-Based Stop:
Stop-loss is placed at:
Entry ± ATR × Multiplier (user-configurable, default 2.0).
This anchors risk to current volatility.
Minimum Reward:Risk Ratio:
For each setup, the script:
Computes the distance from entry to stop (risk).
Projects a take-profit target at risk × min_rr_ratio away from entry.
Only accepts the setup if risk is positive and the required R:R ratio is achievable.
Result: Every order is created with both TP and SL at a predefined distance, so each trade starts with a known, minimum Reward:Risk profile by design.
“Guaranteed R/R” refers exclusively to this order placement logic (TP/SL geometry), not to win-rate or profitability.
5. Trading Logic – W3–W4–W5 Pattern
The Trading pivot stream (separate from visual wave degrees) looks for a simple but powerful pattern:
Bullish structure:
Sequence of pivots forms a higher-high / higher-low pattern.
Price is above the EMA trend filter.
A strong “W3” leg is confirmed with structure rules (optionally stricter in Strict mode).
Entry (Long – W4 Pullback):
The “height” of W3 is measured.
Entry is placed at a configurable Fibonacci pullback (default 50%) inside that leg.
ATR-based stop is placed below entry.
Take-profit is projected to satisfy min Reward:Risk.
Bearish structure:
Mirrored logic (lower highs/lows, price below EMA, W3 down, W4 retrace up, W5 continuation down).
Once a valid setup is found, the script draws a colored box around the entry zone and a label describing the type of signal (“LONG SETUP” or “SHORT SETUP”) with the suggested limit price.
6. Orders & Execution
Entry Orders: The strategy uses limit orders at the computed W4 level (“Sniper Long” or “Sniper Short”).
Exits: A single strategy.exit() is attached to each entry with:
Take-profit at the projected minimum R:R target.
Stop-loss at ATR-based level.
One Trade at a Time: New setups are only used when there is no open position (strategy.opentrades == 0) to keep the logic clear and risk contained.
7. Visual Guide on the Chart
Wave Labels:
Primary: ①,②,③,④,⑤, ⒶⒷⒸ
Intermediate: (1)…(5), (A)(B)(C)
Minor: i…v, a b c
Trend EMA: Single blue EMA showing the dominant trend.
Setup Boxes:
Green transparent box → long entry zone.
Red transparent box → short entry zone.
Labels: “LONG SETUP / SHORT SETUP” labels mark the proposed limit entry with price.
8. How to Use This Strategy
Attach the strategy to your chart
Choose your market (stocks, indices, FX, crypto, futures, etc.) and timeframe (for example 1h, 4h, or Daily). Then add the strategy to the chart from your Scripts list.
Start with the default settings
Leave all inputs on their defaults first. This lets you see the “intended” behaviour and the exact properties used for the published backtest (account size, 1% risk, commission, etc.).
Study the wave map
Zoom in and out and look at the three wave degrees:
Blue circles → Primary degree (big picture trend).
Teal (1)…(5) → Intermediate degree (swing structure).
Red i…v → Minor degree (micro waves).
Use this to understand how the engine is interpreting the Elliott structure on your symbol.
Watch for valid setups
Look for the coloured boxes and labels:
Green box + “LONG SETUP” label → potential W4 pullback long in an uptrend.
Red box + “SHORT SETUP” label → potential W4 pullback short in a downtrend.
Only trades in the direction of the EMA trend filter are allowed by the strategy.
Check the Reward:Risk of each idea
For each setup, inspect:
Limit entry price.
ATR-based stop level.
Projected take-profit level.
Make sure the minimum Reward:Risk ratio matches your own rules before you consider trading it.
Backtest and evaluate
Open the Strategy Tester:
Verify you have a decent sample size (ideally 100+ trades).
Check drawdowns, average trade, win-rate and R:R distribution.
Change markets and timeframes to see where the logic behaves best.
Adapt to your own risk profile
If you plan to use it live:
Set Initial Capital to your real account size.
Adjust default_qty_value to a risk level you are comfortable with (often 0.5–2% per trade).
Set commission and slippage to realistic broker values.
Re-run the backtest after every major change.
Use as a framework, not a signal machine
Treat this as a structured Elliott/R:R framework:
Filter signals by higher-timeframe trend, major S/R, volume, or fundamentals.
Optionally hide some wave degrees or ABC labels if you want a cleaner chart.
Combine the system’s structure with your own trade management and discretion.
Best Practices & Limitations
This is an approximate Elliott Wave engine based on fractal pivots. It does not replace a full discretionary Elliott analysis.
All wave counts are algorithmic and can differ from a manual analyst’s interpretation.
Like any backtest, results depend heavily on:
Symbol and timeframe.
Sample size (more trades are better).
Realistic commission/slippage settings.
The 0-slippage default is chosen only to show the “raw logic”. In real markets, slippage can significantly impact performance.
No strategy wins all the time. Losing streaks and drawdowns will still occur even with a strict R:R framework.
Disclaimer
This script is for educational and research purposes only and does not constitute financial advice or a recommendation to buy or sell any security. Past performance, whether real or simulated, is not indicative of future results. Always test on multiple symbols/timeframes, use conservative risk, and consult your financial advisor before trading live capital.

Sunny Quantum Momentum Framework (SQMF)Sunny Quantum Momentum Framework (SQMF) – Strategy Description
The Sunny Quantum Momentum Framework is a dynamic trend-adaptive trading model designed to identify early momentum shifts and capitalize on directional price movements. The strategy blends multiple market-sensitive components to filter noise, detect emerging trends, and optimize entries with precision.
SQMF works by continuously evaluating price behavior, volatility fluctuations, and short-term trend acceleration to generate actionable signals. Instead of relying on a single indicator, the framework integrates layered momentum structures and adaptive smoothing techniques to maintain signal quality across different market conditions.
The system focuses on:
Detecting momentum transitions with minimal lag
Reducing false signals through multi-stage validation
Aligning entries with broader trend conditions
Managing trades dynamically using built-in risk controls
SQMF is designed for traders seeking a balanced approach—fast enough to catch early movements, but stable enough to avoid common market noise. The strategy is suitable for intraday, swing, and algorithmic trading environments.
[iQ]PRO Quant GANN FOURIER VZO RANGE+🔮 PRO Quant GANN FOURIER VZO RANGE+
A Highly Adaptive and Proprietary Quantitative Strategy for Precision Market Analysis
This is the official description for the PRO Quant GANN FOURIER VZO RANGE+ strategy, a sophisticated, closed-source system engineered for high-level market engagement. This tool integrates multiple independent quantitative models into a single, cohesive Ensemble Signal, providing an edge through robust, multi-dimensional analysis.
🔬 Core Quantitative Architecture
The strategy is built on the convergence of several powerful, state-of-the-art analytical components, each designed to capture a distinct facet of market dynamics:
Proprietary Gann Swing Models: We utilize a dual-approach to Gann analysis.
Array–Based Gann Swing: A proprietary implementation leveraging advanced Pine Script array structures for dynamic tracking of significant price pivots and structure shifts. This component continuously monitors market momentum and potential areas of interest, including proprietary "ChoCh" (Change of Character) detection—a highly sensitive mechanism for identifying early trend inflection points. This core mechanism provides a high-frequency structural view of the market.
Composite Multi-Timeframe Gann Swing: This model synthesizes traditional swing analysis across two distinct timeframes to filter noise and confirm structural trends, ensuring the system operates with conviction against the backdrop of a higher-level market perspective.
VZO/VSA (Volume Zone Oscillator/Volume Spread Analysis) Hybrid: This module is engineered to analyze the crucial relationship between price momentum and volume flow, specifically using a Volume Zone Oscillator (VZO) approach integrated with Volume Spread Analysis (VSA) principles. It is designed to identify underlying accumulation and distribution activity with a unique dual-timeframe composite for enhanced signal quality.
Trend and Statistical Component: A dedicated module assesses the statistical bias and slope of the aggregated market movement, providing a crucial check against overextension and ensuring alignment with the underlying price regression trajectory.
⚖️ The Ensemble Signal and Trade Logic
All independent signals—Gann Array, Composite Gann, VZO/VSA, and Trend—are processed through a Weighted Ensemble Logic.
Weighted Voting: Each component's signal is assigned a customizable weight (input parameters wGannComp, wVZO, etc.) to reflect its relative importance in the current market environment.
Threshold-Based Decision: The weighted average of all signals results in an Ensemble Signal. Only when this signal decisively exceeds a customizable Signal Threshold does the system generate a Final Signal for trade execution. This rigor is key to filtering lower-conviction setups.
The strategy's execution logic is designed to open and close positions dynamically based on the Final Signal, maintaining maximum control with a default position size of 15% of equity per trade. A dedicated toggle allows for aggressive position management to "stay in" trades longer under specific conditions identified by the proprietary swing models.
⚙️ Strategic Advantages and Exclusivity
This strategy is marked by its extreme adaptability, incorporating features such as:
Higher Timeframe Synthesis: Crucial components utilize multi-timeframe confirmation to validate signals.
Price Smoothing: An optional, light-touch EMA smoothing is applied to the input price data to enhance signal clarity and reduce spurious whipsaws.
Due to the proprietary nature and complexity of the underlying swing detection algorithms and array management, the source code is kept strictly closed-source. This ensures the continued analytical edge and integrity of the model for our exclusive community.
OG INDICATOR TO MESS AROUND WITH, USE RIGHT, AND ENJOY. PRO STRATS COMING TOO
NFA.
MKNiQ

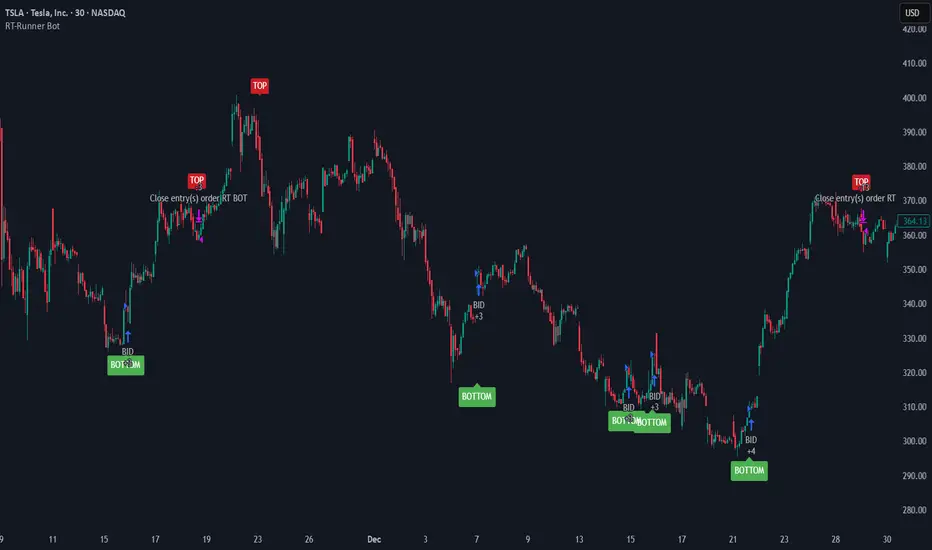
RT-Runner BotRunner Bot is a trend following tool designed to highlight when price shifts from normal back and forth rotation into stronger directional moves. It is built to help traders focus on higher quality trend legs, stay patient during chop, and avoid forcing trades when conditions are not aligned.
Blurring The Lines - Indicator vs Bot
Rainbow Trends set out to combine some of the ideas behind automated trading bots with the flexibility of trading indicators. After years of development, Runner Bot was built as an "indicator bot" that can be applied across multiple assets and multiple timeframes from the same interface.
How It Works
This tool aims to identify points where large market players - the "whales" - may be more likely to reverse the trend. It generates BOTTOM signals when its conditions suggest a potential market bottom has formed, and TOP signals when it detects that a potential top has been reached.
These signals are plotted directly on the chart so traders can visually review where Runner Bot has flagged prior tops and bottoms and compare them with their own levels, structure, and risk management.
How It Changes With Timeframe
Runner Bot identifies trend reversals based on the selected timeframe. The same logic can be applied across intraday, swing, and macro views, but its behavior will naturally change:
For macro level reversals, many traders focus on higher timeframes such as H4 to H12.
If you are scalping, you can switch to much lower timeframes, but keep in mind that bottoms detected on shorter intervals are less reliable at predicting a true long term bottom.
Choosing the timeframe intentionally is important: higher timeframes tend to highlight larger structural tops and bottoms, while lower timeframes are more sensitive to short term noise.
Tuning The Bot
Runner Bot was built to be relatively turnkey, but it does allow users to tune it for specific timeframes and assets.
To adjust the sensitivity of the TOP/BOTTOM prints, adjust the first two values in the settings column:
Decreasing these values (negative adjustments) will generally increase the number of TOP/BOTTOM signals the bot will fire.
Increasing these values will do the opposite and make TOP/BOTTOM signals less common.
This lets traders decide whether they want Runner Bot to be more selective (fewer, higher conviction style signals) or more frequent (more signals for active traders).
The trader also has the option to toggle the signals On/Off as desired. Some traders prefer to only plot TOPs and not BOTTOMs, or only BOTTOMs and not TOPs, depending on their strategy.
Limitations Of The Tool
Under the hood, Runner Bot uses internal algorithms working together to analyze price action. It can be applied across multiple timeframes, but like any tool, it has its sweet spots:
On higher ranges like 12H to 1D, you will mostly see TOP signals, which can be useful for monitoring extended moves.
On ultra low timeframes under 15 minutes, market noise can increase and short term bottoms are less reliable as long term turning points.
Fine tuning your settings to match your strategy, asset, and timeframe is recommended rather than relying on one configuration for every situation.
Preferred Settings
Over time, a few configurations have become common starting points:
H4 - A core timeframe to start catching both Tops and Bottoms across TradFi, Crypto, and Commodities.
H2/H4 Combo - Monitoring Bottoms on H2 and taking profits on H4 has been a popular combination among Rainbow Theory traders. H2 can provide earlier entries, while H4 offers a more conservative, lagging exit.
1D/H24 - Helpful for macro Tops in both TradFi and Crypto when combined with other higher timeframe context.
These are not rules, but practical examples of how some traders choose to deploy Runner Bot.
Automating Alerts
Runner Bot can also be connected to standard TradingView alerts so TOP and BOTTOM signals do not need to be watched manually on every bar.
A typical alert setup:
Symbol - Set to the asset you are charting.
Condition - Set to Runner Bot (this will use the settings you currently have on the chart).
Condition detail - Use the alert() function calls only so the tool can send alerts when TOP or BOTTOM signals fire.
Interval - Same as chart (this locks alerts to the timeframe you set them up on).
Once alerts are configured, TradingView can notify you according to your alert preferences whenever Runner Bot detects a new TOP or BOTTOM based on your current settings.
Important Note
Runner Bot is intended to provide additional context around tops, bottoms, and broader trend behavior. It is not a standalone signal generator and should always be used together with your own analysis, testing, and risk management. Historical Runner Bot signals and past market reversals do not guarantee future results.
🐋 Tight lines and happy trading!
CSS_LFU_v0.1Overview:
A multi-factor, market-adaptive swing strategy designed for intraday and short-term crypto trading. It synthesizes momentum, volatility, and trend signals into a unified composite score over a configurable lookback window. The strategy leverages a modular, signal-weighted approach to ensure robust entry timing while remaining compatible with human-in-the-loop validation and algorithmic execution.
Core Modules:
AJFFRSI (RSX-based Momentum): Measures smoothed price momentum with noise-reduction filters to detect crossovers relative to the QQE trailing stop.
QQE (Quantitative Qualitative Easing RSI): A modified RSI with a dynamic trailing stop that adapts to short-term volatility, identifying exhaustion and potential reversal points.
Keltner Channel Zones: Determines overextension relative to trend, providing buy/sell zones based on ATR-banded EMA.
WaveTrend Oscillator: Confirms short-term swings and market direction through smoothed oscillator cross signals.
Rolling Composite Score: Aggregates module signals over a unified lookback (e.g., 144 bars) to normalize noise and capture consistent trends.
Signal Logic:
Each module outputs a discrete score (+1 / 0 / -1).
The rolling composite score sums all module scores over the lookback period.
Long positions trigger when the rolling score meets or exceeds the long threshold.
Short positions trigger when the rolling score meets or falls below the short threshold.
Multi-dimensional signal aggregation reduces false positives from single indicators.
Rolling lookback ensures score normalization across different volatility regimes.
Highly modular: easy to adapt modules or weights to different instruments or timeframes.
Fully compatible with automated execution pipelines, including custom exchange screener bots.
Use Case:
Ideal for quant-driven altcoin or multi-asset strategies where high-frequency validation is critical and sequential module weighting enhances trend flip detection.

Anchor SafeSwing Gold StrategyOverview:
The Anchor SafeSwing Gold Strategy is designed for users who prefer structured, rule-based swing trading on XAUUSD. It focuses on identifying high-quality trade setups rather than frequent entries.
This strategy analyzes the market using multiple technical indicators and methods—including trend analysis, multi-chart confirmation, and support/resistance evaluation—to identify potential swing points. It also incorporates a dynamic approach to risk management through adaptive stop-loss and take-profit logic.
How the Strategy Works
1. Multi-Chart & Trend Analysis:
The strategy evaluates trend direction using several indicators and multiple charts. This helps determine whether the trend favors long or short setups.
2. Buy/Sell Conditions:
a. Buy Conditions: When the broader trend is identified as bullish, the strategy waits for the formation of a strong support zone before considering a long position.
b. Sell Conditions: When the trend is bearish, it waits for a confirmed resistance zone before initiating short positions.
3. Dynamic Take-Profit Logic
The strategy uses adaptive take-profit behavior based on evolving market conditions. It monitors new support/resistance structures and various overbought/oversold signals to dynamically exit trades.
4. Dynamic and Configurable Stop-Loss:
A flexible stop-loss system adjusts according to volatility and market structure.
Users can modify the stop-loss threshold in the settings based on their own risk tolerance and account size.
Trading Frequency :
This strategy focuses on select, high-quality setups. As a result, trade frequency is relatively low and may vary depending on market conditions. Backtesting may show roughly several trades per month, but actual live performance can differ.
Important Notes
All trading involves risk, and users should evaluate the strategy and adjust settings according to their own risk management preferences.

AlgomaticPro - Trend Sniper (BTC, ETH, SOL) 4H timeframeBest performing coins - BTC, ETH, SOL, ADA, DOGE, AVAX, DOT, NEAR, VET, KAS
Best Performing timeframe - 4H