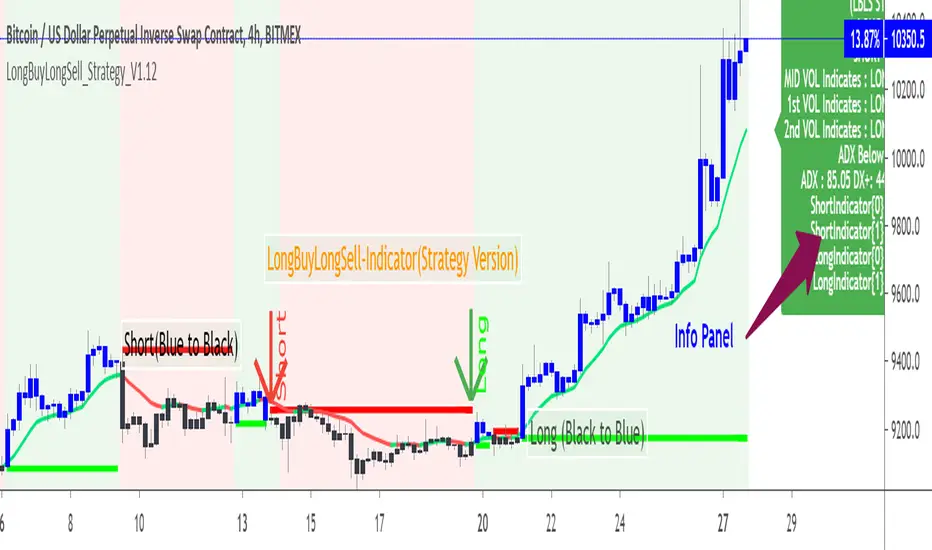
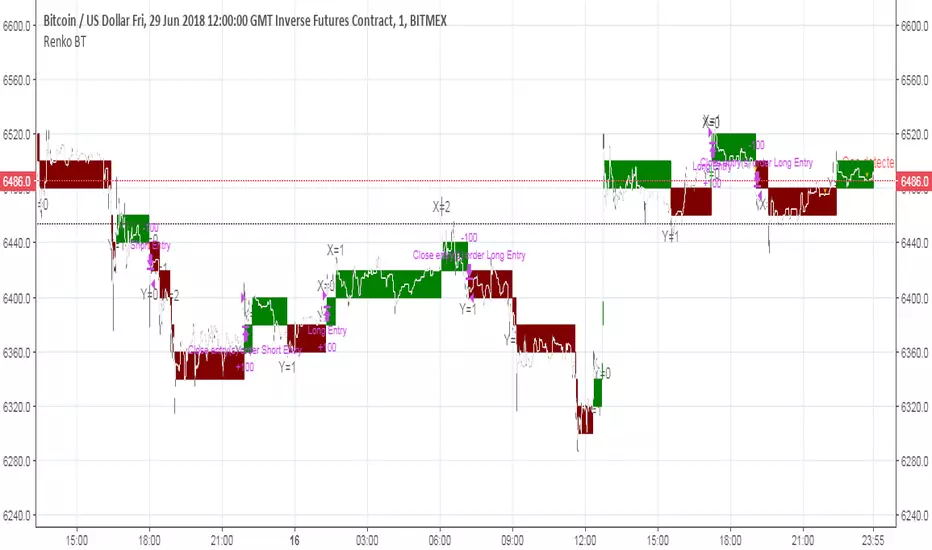
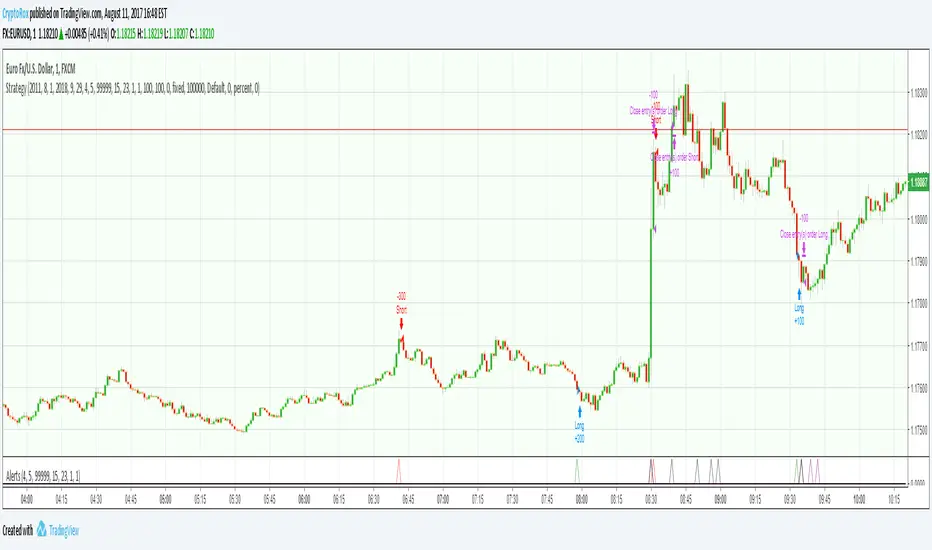
LongBuyLongSell 90% profit Excellent Win Rate Strategy indicatorI seldom prefer the strategy version ,As you have requested to share the backtest results sharing the details here for your info only. to check how the "LongBuyLongsell" indicator is working.
BTCUSD 30min time frame used ,Tested with Forex ,Equity results are >80% when right entry is predicted.
This is, published to show only the test results of the original "LongBuyLongSell" indicator that was published in tradingview initially on 27Jun.
The test scripts are only available to do testing by me and it is keycode protected,Here sharing the results of BTCUSD of 30min time frame with the improved logic in "longbuylongsell" indicator version.
This script cannot be used for generating Alerts realtime as tradingview does not support user "Alerts" in strategy scripts . So please get access for "longbuylongsell" indicator.
Information are shared to show the accuracy of this LongBuyLongsell Indicator.
No indicator will work 100% in all time ;Win rate will be 80% ; Just sharing this as a result here and as a performance report of LongBuyLongsell Indicator script available in Tradingview.
Again,This is shared only for info ,not to be used. If you wish to use the indicator check and get the access for the working "longbuylongsell" indicator version 1 and Version 2 and not to this.
In den Scripts nach "alert" suchen
Buy or Sell Zone This Indicator Signals the Buy and Sells, there is no guessing just follow the alerts.

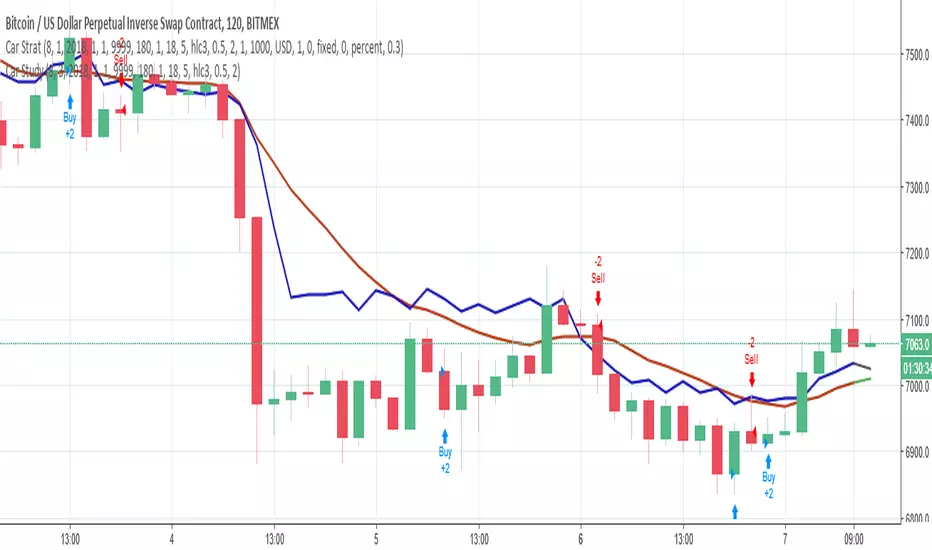
Carribean Strategy
Hi!
This is my first published strategy. This is my passport to early retirement. It is a very modified version of HCL3/Kaufman strategy. Lots of manual coding to solve repaint. Backtest/realtime differences fixed.
I'm finishing the tests but I guess it is almost done.
Using with Autovew. For now, 2 hour candles only!
Please share your results!
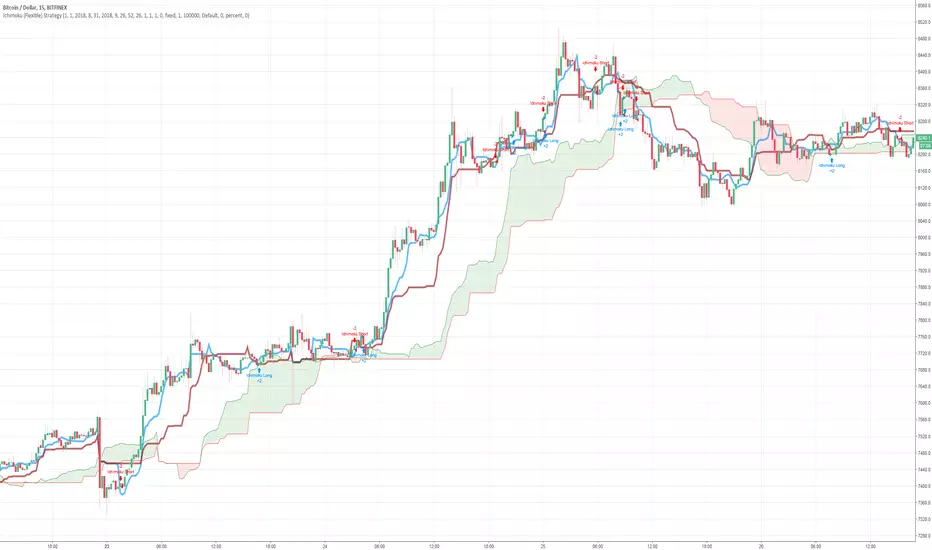
Ichimoku (Flexible) StrategyThis is the strategy for Ichimoku with Alerts (Flexible Conditions) indicator.
Please read the description from here:
You can adjust the time period you want to apply this strategy for with the inputs.
08-18 EMA Watson [BACKTEST][STRATEGY] BTC/USDTHello, it has been a while since I published something, I have been working on webdev in the last months but Here I Am again with a brand new strategy, I called it EMA Watson lol (no I'm not a fan)!
Recently Bitcoin has been outperforming almost all altcoins so I made a script for trading Bitcoin against USDT. This script should be used on a pair that is in an uptrend, just like BTC/USDT today. The script is coded in such a way that it won't make any trade if the trend goes bearish.
This is a simple buy and sell strategy, that can be used for manual trading or for a trading bot. The strategy is based upon the Exponential Moving Average trading rules, and I added my personnal touch of course.
I give access for free, just leave a comment.
More info about the script, such as inputs description, how to configure the script, strategy explanation, alert configuration can be found here : blockchainfiesta.com
The Alert Setup (indicator) script should be uploaded soon on my profile.
--------------------------------------------------------------------------------------------------------------
Commission Work: TradingView development, Reverse Engineering, Pine Script. contact@blockchainfiesta.com. You can also send me a message in TradingView or Discord
If you have too much crypto and want to help me out:
BTC address: 19sVQvCDmVfEACq7BiMnWSMqFPZ8qfSQ2K
ETH address: 0xc8a5d3a63a05db0c2363ea1c08b37a01cce9ebfb
PARSEC Bitcoin strategy for testing: SMA + ADX + Fisher transfStrategy using SMA, ADX and modified Fisher transform (I've made linear transformation on original Ehler's Fisher transform) and implemented into Bitcoin trading perspective.
Current strategy is optimized for Bitcoin.
General objectives is to add, remove indicators:
- to further improve the strategy for Bitcoin
- adjust the strategy to be feasible for wider range of cryptocurrencies (preferably for the top 2-5 or top 2-10 ones), without significantly decreasing the current profit factor and profit rates
Experienced technical analysts feel free to PM me if you want to test the strategy (at this stage up to 5 people's participation would be appreciated).
For those ones who significantly contribute, I will give life-long access to both the improved strategy and alerts.

Low Frequency Trader [LFS] - NO REPAINTLow Frequency Trading Signals - Safe to trade with low leverage leverage and make a retirement fund.
Absolutely NO REPAINT.
Very conservative approach.
Works best on 1H chart.
This is the strategy, check my profile for the indicator with alerts.
This Level of Strategy, will not be free. PM for access - Monthly Subscription.

Crypto Market Maker w/ BacktestUltimate Trading Tool. Simple af 1.07% . Follow signals, chart if you want to confirm.
Takes only trades with proper risk to reward ratio.
At times calls absolute top and bottom.
Can be used on ALTs as well.
Based on Neural Networks.
Can be used on 60m,30m,15m,5m, 3m 0.32% 0.32% -0.88% - As this is basically a SCALPER. (use with leverage)
Works best in my experience on 15m.
This is strategy for backtest, check my profile for the indicator with alerts.
This Level of Strategy, will not be free. PM for access - Monthly Subscription.

Strat_v8 - Used with Autoview… Longs / Margin TradingInvite only…
FREE Access until my bot is built (Target Date…. May 2018).
Only allowing 20 people to use.
Cost will be 10% of any profits made. Minimum account balance being traded must be $1,000.
After my bot is built, this script will ONLY be used with my bot and all access on here (Trading View) will be removed after the final sell trigger is completed!
****Can be used for just Longs.. or for Margin Trading.****
For Longs only.. Settings and Alert condition examples found here:
drive.google.com
For Margin trading... Settings and Alert condition examples found here:
drive.google.com

My Custom indicator & Strategy for trading BTC in 5min UTHello,
If your goal is to make some BTC, this script might be for you.
I tested it on the ETH/BTC Binance chart.
About the indicator :
In short, it will help you for several things :
Avoid losing BTC when the trend goes bearish.
Earn BTC during any bullish trend.
Earn BTC when the market is in trading range by bouncing off trend lines, while anticipating a new potential trend.
I based my algorithm on several technical tools such as volume, RSI, pivot, for a total of 6 boolean conditions mixed together with AND and OR gates, resulting in those entry points (shapes)
About the Strategy :
I only used long entries and exits. No shorting.
The commission rate is set to 0.05% (binance)
The backtesting results in only 40€ of net profit for a 1000€ inital capital, it may seem litle BUT during the testing period (18 days, 40 trades) the coin (ETH) dropped in BTC value ( -25% ). You make 4% while a simple Holder would lose -25%, which is 29% difference.
Since I worked hard on this script, I'll grant access to only those willing to make a small donation, that'd really help me reach my goal of making a living with trading. I will also give you any info you want and give you everything need to set up alerts. Thank you very much.

Grahn Gyllene KorsGrahn Gyllene Kors strategy is an idea that was brought to me and I was asked to create for the client to be used as an early alert signal for when BTC 0.05% is trending. The client has graciously now decided that this should be shared with everyone.
This is an EMA / Trend Explorer useful for identifying trends before EMA's cross and also identifying and experimenting with various EMA lengths and candle trends. There will be a companion Alert study for this released soon in which signals may be sent to the user via sms or email.
EMA Fast and EMA Slow may be adjusted in length and color and their display may be turned on or off.
Bullish X% F/S controls what percentage the EMA Fast should be above EMA Slow before considered bullish and is represented by the Green band on the chart.
Neutral > Y% < is what percentage surrounding the EMA Slow should be considered neutral and is represented by the Yellow band on the chart.
Bearish Z% S/F controls what percentage the EMA Fast should be below EMA Slow before considered bearish and is represented by the Red band on the chart.
Trend Enable determines whether Trend Strength is enforced in addition to EMA divergence.
Bull Strength is the number of candles ranging from 0 to 5 that should be consecutively higher in value before considered to be a trend.
Bear Strength is the number of candles ranging from 0 to 5 that should be consecutively lower in value before considered to be a trend.

How to automate this strategy for free... Version 2Hello fellow traders and automation lovers.
It has been about 2 years since we originally created Autoview to connect your exchanges/brokers with your TradingView alerts. We've since added multiple exchanges, parameters and have built a large community filled with awesome, passionate traders.
One of the first strategies we built was sadly not a viable one for trading due to it using built-in variables that resulted in the backtest results being inaccurate in comparison to placing live trades. Luckily, we did not encounter repainting until a few strategies in, however, there was a point where we published a few of them as well. We will be going through all of our scripts again to not only eliminate any repainting and update to version 3, but to also include all the code snippets that we've learned to use over the years that allow for accurate backtesting and live trading.
The first script we are redoing is our How to automate this strategy for free using a chrome extension. .
Easter egg: This includes a new snippet of code that makes controlling how many orders you pyramid within a study fast and easy.
We look forward to bringing all of our scripts and delving deep into Pine again :)
Happy Trading
Autoview
Arbitrage Bands Strategy 2.18Letting profits ride....
Combined Arbitrage Exit signals with Arbitrage Strategies to let our shorts ride longer!
Also added alerts for short and long entries to Strategies to make it easier to manage your alerts between scripts
Enjoy,
Arbitrage Trade Team

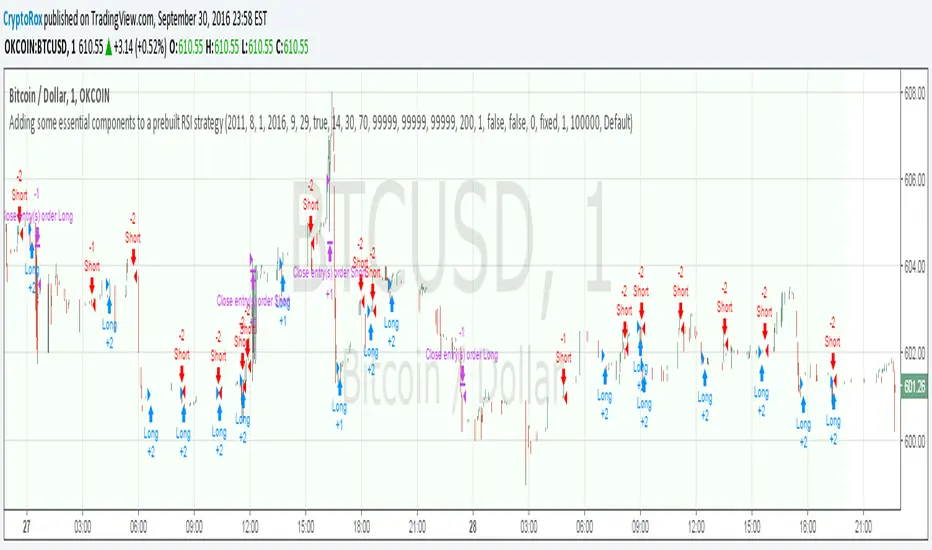
Adding some essential components to a prebuilt RSI strategyThis is more to be used as a blank_slate for any strategy build adding more effective backtesting with a period selector and inputs like TS, TP, SL that can all be used as plots for alerts.
It has the BackTest Component created by Pbergden
It also includes the standard long/short with trailing stop, take profit, stop loss and margin call.
Here is a video using the blank_slate to add in the built-in RSI Strategy.
youtu.be
We hope this brings good results and helps speed things up for everyone.
SVTR [Ultimate]SVTR v1.0 is a fully automated trading strategy designed to identify high-probability market opportunities using structured momentum, trend validation, and risk-controlled execution logic.
This strategy is not a simple signal generator.
It is a complete decision engine that evaluates market conditions, confirms entries with multiple filters, and manages trades automatically according to predefined logic.
Built for traders who want consistency, discipline, and objective execution, SVTR removes emotional bias and delivers rule-based trading across different market environments.
KEY FEATURES
• Fully automated entry and exit logic
• Multi-layer confirmation system
• Momentum and trend validation
• Smart trade filtering to reduce noise
• Works on multiple markets and timeframes
• Non-repainting logic
• Alert-ready for automation and integrations
AUTOMATED STRATEGY LOGIC
SVTR continuously analyzes the market and only executes trades when all required conditions align.
This prevents overtrading and avoids weak or low-quality setups.
The strategy is designed to:
Enter when momentum and direction are confirmed
Avoid choppy and uncertain market phases
Exit trades based on objective, rule-driven logic
Maintain consistency regardless of emotions or bias
WHY THIS STRATEGY?
Most traders fail not because of bad ideas, but because of:
Late entries
Emotional decisions
Overtrading
Lack of discipline
SVTR v1.0 solves these problems by automating the decision process and executing trades exactly as designed, every time.
You trade the system.
Not your emotions.
WHO IS IT FOR?
• Traders looking for automated execution
• System-based and rule-driven traders
• Swing traders and intraday traders
• Traders who want consistency over discretion
• Users who want a ready-to-use strategy framework
IMPORTANT NOTES
• Invite-Only / Private access
• Source code is protected
• Designed for backtesting, automation, and live monitoring
• Strategy behavior may vary depending on market conditions and settings
VERSION
v1.0 – Initial Private Release
Future updates may include optimizations, additional filters, and performance improvements.
FINAL STATEMENT
SVTR v1.0 is built for traders who value structure, confirmation, and automation over guesswork.
If you are looking for a strategy that executes with discipline, filters weak setups, and operates as a complete automated system, this strategy is designed for you.

Capitulation Detector StrategyA multi-factor capitulation detector designed to identify exhaustion points in extended trends. It focuses on fading capitulation moves after multi-leg trends with extreme volume and price extension.
━━━━━━━━━━━━━━━━━━━━━━━━━━━━━━━━━━━━━━━━
THE CONCEPT
Capitulation occurs when the last holders give up — panic selling into lows or euphoric buying into highs. These moments create asymmetric opportunities because:
Sentiment becomes maximally skewed
Weak hands are flushed out
Price deviates far from equilibrium
The "fuel" for continuation is exhausted
━━━━━━━━━━━━━━━━━━━━━━━━━━━━━━━━━━━━━━━━
THE 6 FACTORS
Trend Persistence — Price stays on one side of 38 EMA for 12+ bars, confirming a sustained directional move
Acceleration — Price stays on one side of 5 EMA for 3+ bars, showing the move is accelerating into exhaustion
Volume Spike — Current bar volume ≥ 2x the 20-bar average
Body Expansion — Candle body ≥ 1.5x average, showing conviction/panic in the move
Extension — Price is 2+ ATR away from the 38 EMA, indicating overextension from equilibrium
Multi-Leg Structure — At least 3 consecutive lower lows (for longs) or higher highs (for shorts)
━━━━━━━━━━━━━━━━━━━━━━━━━━━━━━━━━━━━━━━━
SIGNAL LOGIC
Bullish Capitulation: 4+ factors align + price below 38 EMA + down candle + volume spike
Bearish Capitulation: 4+ factors align + price above 38 EMA + up candle + volume spike
The strategy enters counter-trend, fading the exhaustion move.
━━━━━━━━━━━━━━━━━━━━━━━━━━━━━━━━━━━━━━━━
EXIT OPTIONS
ATR-based stop loss (default: 2 ATR)
ATR-based take profit (default: 3 ATR)
Optional trailing stop
Time filter for session-specific trading
━━━━━━━━━━━━━━━━━━━━━━━━━━━━━━━━━━━━━━━━
BEST PRACTICES
Works best on liquid instruments with clean trends
More reliable after 3+ legs in the trend
Higher conviction when daily AND intraday timeframes align
"The bigger and more extended, the better"
Consider VWAP as additional confirmation (not coded here)
━━━━━━━━━━━━━━━━━━━━━━━━━━━━━━━━━━━━━━━━
SETTINGS GUIDE
Min Score: Increase for fewer, higher-quality signals
Volume Spike Multiplier: 2x; increase for stricter filter
Extension ATR: Higher values = more overextended setups only
Trend Bars Min: Higher values = longer established trends required
━━━━━━━━━━━━━━━━━━━━━━━━━━━━━━━━━━━━━━━━
ALERTS
Bullish Capitulation (potential long)
Bearish Capitulation (potential short)
━━━━━━━━━━━━━━━━━━━━━━━━━━━━━━━━━━━━━━━━
DISCLAIMER
This is a counter-trend strategy — inherently higher risk than trend-following. Always use proper position sizing and risk management. Backtest thoroughly on your specific instruments and timeframes.

AlphaGen ME V.15.12AlphaGen ME V.15.10 is an ATR-based trend-following strategy with dynamic trailing stops and EMA filter, designed for automated Crypto perpetual trading.
Core Logic:
• ATR Trailing Stops: Dynamically adjusts stop-loss using ATR(10) × 3.0 multiplier
• 200 EMA Trend Filter: Optional Only takes longs above EMA, shorts below EMA
• Reversal System: Flips positions when trend changes (filter-aware)
• MACD Acceleration Exit: Optional momentum-based profit taking
Position Sizing Modes:
• Simple % of Equity (default 90%) - Safe leverage control
• Risk % of Equity - Fixed risk per trade
• Fixed Contract Size - Consistent lot sizing
Webhook Integration:
Routes signals directly to AlphaGen-AI for execution on:
• Hyperliquid DEX
• AsterDEX
Requirements:
• AlphaGen-AI Pro subscription for webhook routing
• Hyperliquid or AsterDEX Wallets
• TradingView alerts configured with passphrase
Risk Disclosure: Trading involves substantial risk. Past performance does not guarantee future results. Only trade with capital you can afford to lose.

New Age US ORB═════════════════════════════════════════════════════════════
NEW AGE US ORB
Opening Range Breakout Strategy with Neon Glow Effect
═════════════════════════════════════════════════════════════
🔒 INVITE-ONLY ACCESS
This script requires an invitation to use.
To request access, please send me a private message.
═════════════════════════════════════════════════════════════
🎯 OVERVIEW
The New Age US ORB is a clean, professional Opening Range Breakout (ORB) strategy with a futuristic visual style featuring dynamic neon glow effects.
Designed for Crypto (BTC/USD) and Indices (US100, US30, SPX) trading.
Best results on 5-minute or 15-minute chart with Regular Candles.
The strategy captures the first 15 minutes of US market activity (9:30-9:45 NY) and trades breakouts in the direction of the initial move.
💎 WHAT MAKES THIS UNIQUE
Unlike standard ORB indicators, this strategy combines:
• Proprietary 3-layer Neon Glow visualization for enhanced box visibility
• Integrated US Session backgrounds for market context
• Smart Session Filter to avoid low-probability late entries
• Separate Long/Short TP management for asymmetric markets
• Automatic EOD position closure for overnight risk control
• Daily trade limiter to prevent overtrading
• Global Timezone Support - works correctly for traders worldwide
This combination of visual design and risk management features is not available in standard ORB scripts.
Trade Smarter, not Harder.
📦 WHAT IS ORB?
The Opening Range Breakout (ORB) strategy is based on the concept that the first 15 minutes of the US market session often sets the tone for the rest of the day. The High and Low established during this period act as key support/resistance levels.
• Price breaks ABOVE ORB High → Bullish momentum (LONG)
• Price breaks BELOW ORB Low → Bearish momentum (SHORT)
⚡ KEY FEATURES
📦 ORB BOX VISUALIZATION
• Automatically captures High/Low of 9:30-9:45 NY candle
• Dynamic color change:
→ Cyan: Price ABOVE ORB High (Bullish)
→ Red: Price BELOW ORB Low (Bearish)
• Extends throughout the trading session
✨ NEON GLOW EFFECT
• 3-layer glow effect around the ORB box
• Layered borders (8px → 5px → 3px) with gradient transparency
• Creates futuristic, high-visibility appearance
• Toggle on/off in settings
🕐 US SESSION BACKGROUNDS
• US Open (9:30-11:30 NY) - Blue
• Lunch Break (11:30-13:30 NY) - Orange
• Afternoon (13:30-16:00 NY) - Green
• Visual reference only - helps identify optimal trading windows
⏱️ SESSION FILTER
• Configurable trading window (default: until 11:50 NY)
• Prevents late entries when momentum fades
• EOD auto-close in YOUR selected timezone (default: 21:45)
🎚️ RISK MANAGEMENT
• ORB Box Stop Loss: SL at opposite ORB level + buffer
• Separate Take Profit settings for Long/Short
• Points or Percentage mode
• Daily trade limit (default: 6 trades max)
📊 INFO DASHBOARD
• Real-time status panel (top right)
• Shows: Timezone, Status, Session, Direction, Trades, SL/TP, EOD, ORB levels
⚙️ SETTINGS
TIMEZONE
└── Your Timezone: Select from 12 global timezones (Default: Europe/Zurich)
Available: UTC, New York, Chicago, Los Angeles, London, Berlin,
Zurich, Paris, Tokyo, Hong Kong, Singapore, Sydney
ORB BOX (9:30-9:45 NY)
├── Show ORB Box: true/false
└── Neon Glow Effect: true/false
US SESSION BACKGROUNDS
├── Show Session Background: true/false
├── US Open Color (9:30-11:30)
├── Lunch Color (11:30-13:30)
└── Afternoon Color (13:30-16:00)
SESSION FILTER
├── Enable Session Filter: true/false
├── Session End Hour (NY): 0-23
└── Session End Minute (NY): 0-59
DAILY CLOSE (Your Timezone)
├── Enable Daily Close: true/false
├── EOD Hour: 0-23
└── EOD Minute: 0-59
TRADE LIMITS
├── Enable Daily Limit: true/false
└── Max Trades per Day: 1-10
STOP LOSS
├── Enable ORB Box SL: true/false
└── SL Buffer: Points distance from ORB level
TAKE PROFIT - LONG
├── Enable TP Long: true/false
├── Mode: Points / Percent
├── TP Long Points: Distance in points
└── TP Long Percent: Distance in %
TAKE PROFIT - SHORT
├── Enable TP Short: true/false
├── Mode: Points / Percent
├── TP Short Points: Distance in points
└── TP Short Percent: Distance in %
COLORS
├── Bullish: Default #00ffbb (Cyan)
└── Bearish: Default #ff1100 (Red)
📈 HOW TO USE
1. Apply to BTC/USD or US100 on 5min or 15min timeframe
2. Use Regular Candles for realistic results
3. Go to Strategy Properties → Enable ☑️ "Recalculate On Bar Close"
4. Select your Timezone in settings (for correct EOD close time)
5. Wait for ORB box to complete (9:45 NY)
6. Strategy enters automatically on breakout:
→ LONG when price closes above ORB High
→ SHORT when price closes below ORB Low
7. Manage risk with ORB Box SL and TP settings
8. All positions close at EOD time (in your timezone)
🔔 ALERTS
• LONG Entry - Breakout above ORB High
• SHORT Entry - Breakout below ORB Low
• EOD Close - End of day position close
💡 BEST PRACTICES
• Most effective during US Open session (9:30-11:30 NY)
• Avoid Lunch session (11:30-13:30) - lower volatility
• ORB levels act as support/resistance all day
• Wider TP for trending days, tighter for ranging markets
• Use session filter to avoid late, low-probability entries
═════════════════════════════════════════════════════════════
© AL_R4D1 - New Age Style Trading Tools
═════════════════════════════════════════════════════════════

Trend Vector Pro v2.0Trend Vector Pro v2.0
👨💻 Developed by: Mohammed Bedaiwi
💡 Strategy Overview & Coherence
Trend Vector Pro (TVPro) is a momentum-based trend & reversal strategy that uses a custom smoothed oscillator, an optional ADX filter, and classic Pivot Points to create a single, coherent trading framework.
Instead of stacking random indicators, TVPro is built around these integrated components:
A custom momentum engine (signal generation)
An optional ADX filter (trend quality control)
Daily Pivot Points (context, targets & S/R)
Swing-based “Golden Bar” trailing stops (trade management)
Optional extended bar detection (overextension alerts)
All parts are designed to work together and are documented below to address originality & usefulness requirements.
🔍 Core Components & Justification
1. Custom Momentum Engine (Main Signal Source)
TVPro’s engine is a custom oscillator derived from the bar midpoint ( hl2 ), similar in spirit to the Awesome Oscillator but adapted and fully integrated into the strategy. It measures velocity and acceleration of price, letting the script distinguish between strong impulses, weakening trends, and pure noise.
2. ADX Filter (Trend Strength Validation – Optional)
Uses Average Directional Index (ADX) as a gatekeeper.
Why this matters: This prevents the strategy from firing signals in choppy, non-trending environments (when ADX is below the threshold) and keeps trades focused on periods of clear directional strength.
3. Classic Pivot Points (Context & Targets)
Calculates Daily Pivot Points ( PP, R1-R3, S1-S3 ) via request.security() using prior session data.
Why this matters: Momentum gives the signal, ADX validates the environment, and Pivots add external structure for risk and target planning. This is a designed interaction, not a random mashup.
🧭 Trend State Logic (5-State Bar Coloring)
The strategy uses the momentum's value + slope to define five states, turning the chart into a visual momentum map:
🟢 STRONG BULL (Bright Green): Momentum accelerating UP. → Strong upside impulse.
🌲 WEAK BULL (Dark Green): Momentum decelerating DOWN (while positive). → Pullback/pause zone.
🔴 STRONG BEAR (Bright Red): Momentum accelerating DOWN. → Strong downside impulse.
🍷 WEAK BEAR (Dark Red): Momentum decelerating UP (while negative). → Rally/short-covering zone.
🔵 NEUTRAL / CHOP (Cyan): Momentum is near zero (based on noise threshold). → Consolidation / low volatility.
🎯 Signal Logic Modes
TVPro provides two selectable entry styles, controlled by input:
Reversals Only (Cleaner Mode – Default): Targets trend flips. Entry triggers when the current state is Bullish (or Bearish) and the previous state was not. This reduces noise and over-trading.
All Strong Pulses (Aggressive Mode): Targets acceleration phases. Entry triggers when the bar turns to STRONG BULL or STRONG BEAR after any other state. This mode produces more trades.
📌 Risk Management Tools
🟡 Golden Bars – Trailing Stops: Yellow “Trail” Arrows mark confirmed Swing Highs/Lows. These are used as logical trailing stop levels based on market structure.
Extended Bars: Detects when price closes outside a 2-standard-deviation channel, flagging overextension where a pullback is more likely.
Pivot Points: Used as external targets for Take Profit and structural stop placement.
⚙️ Strategy Defaults (Crucial for Publication Compliance)
To keep backtest results realistic and in line with House Rules, TVPro is published with the following fixed default settings:
Order Size: 5% of equity per trade ( default_qty_value = 5 )
Commission: 0.04% per order ( commission_value = 0.04 )
Slippage: 2 ticks ( slippage = 2 )
Initial Capital: 10,000
📘 How to Trade with Trend Vector Pro
Entry: Take Long when a Long signal appears and confirm the bar is Green (Bull state). Short for Red (Bear state).
Stop Loss: Place the initial SL near the latest swing High/Low, or near a relevant Pivot level.
Trade Management: Follow Golden (Trail) Arrows to trail your stop behind structure.
Exits: Exit when: the trailing stop is hit, Price reaches a major Pivot level, or an opposite signal prints.
🛑 Disclaimer
This script is for educational purposes only and does not constitute financial advice. Past performance does not guarantee future results. Always forward-test and use proper risk management before applying any strategy to live trading.

🔥 Ribas Waves Strategy PRO++📝 Strategy Description: Ribas Waves Strategy PRO++
The Ribas Waves Strategy PRO++ is a powerful trading system based on the identification of Wolfe Waves patterns, designed to capture high-probability reversal points with precise entries and smart risk management.
This advanced version is fully customizable, allowing traders to adapt entry confirmations, trend filters, and risk/reward ratios to their preferred trading style and market conditions.
⚙️ Key Features:
✅ Automatic detection of both Bullish and Bearish Wolfe Wave patterns
✅ Entry confirmation options:
No confirmation (pure Wolfe pattern)
Directional candle (bullish or bearish close)
Engulfing candle (bullish/bearish)
Inside bar + breakout
✅ Optional EMA trend filter
✅ Configurable take profit via:
Risk multiple (R-multiple: e.g., 3x risk)
Percentage of risk (e.g., 300% of stop-loss distance)
✅ Toggle to show or hide wave labels and structure on chart
✅ Entry cooldown to prevent overlapping trades
✅ Visual display of current strategy position: 📈 Long / 📉 Short / ⛔️ Flat
📌 How to Use:
Set pivot sensitivity based on the asset's volatility (default: 7)
Choose your preferred entry confirmation method
Enable or disable the EMA trend filter
Adjust your take profit logic (R-multiple or % of risk)
Run a backtest or use live alerts for execution
💡 Author Recommendations:
Best suited for volatile markets such as crypto, indices, and forex.
For more trades, disable confirmation filters or use “Directional Candle” mode.
Use higher timeframes or combine with volume/context filters for increased accuracy.
Regularly backtest different settings to optimize your edge on specific assets.

Profitable Pair Correlation Divergence Scanner v6This strategy identifies divergence opportunities between two correlated assets using a combination of Z-Score spread analysis, trend confirmation, RSI & MACD momentum checks, correlation filters, and ATR-based stop-loss/take-profit management. It’s optimized for positive P&L and realistic trade execution.
Key Features:
Pair Divergence Detection:
Measures deviation between returns of two assets and identifies overbought/oversold spread conditions using Z-Score.
Trend Alignment:
Trades only in the direction of the primary asset’s trend using a fast EMA vs slow EMA filter.
Momentum Confirmation:
Confirms trades with RSI and MACD to reduce false signals.
Correlation Filter:
Ensures the pair is strongly correlated before taking trades, avoiding noisy signals.
Risk Management:
Dynamic ATR-based stop-loss and take-profit ensures proper reward-to-risk ratio.
Exit Conditions:
Automatically closes positions when Z-Score normalizes, or ATR-based exits are hit.
How It Works:
Calculate Returns:
Computes returns for both assets over the selected timeframe.
Z-Score Spread:
Calculates the spread between returns and normalizes it using moving average and standard deviation.
Trend Filter:
Only takes long trades if the fast EMA is above the slow EMA, and short trades if the fast EMA is below the slow EMA.
Momentum Confirmation:
Confirms trade direction with RSI (>50 for longs, <50 for shorts) and MACD alignment.
Correlation Check:
Ensures the pair’s recent correlation is strong enough to validate divergence signals.
Trade Execution:
Opens positions when Z-Score crosses thresholds and all conditions align. Positions close when Z-Score normalizes or ATR-based SL/TP is hit.
Plot Explanation:
Z-Score: Blue line shows divergence magnitude.
Entry Levels: Red/Green lines mark long/short thresholds.
Exit Zone: Gray lines show normalization zone.
EMA Trend Lines: Purple (fast), Orange (slow) for trend alignment.
Correlation: Teal overlay shows current correlation strength.
Usage Tips:
Use highly correlated pairs for best results (e.g., EURUSD/GBPUSD).
Run on higher timeframe charts (1h or 4h) to reduce noise.
Adjust ATR multiplier based on volatility to avoid premature stops.
Combine with alerts for automated notifications or webhook execution.
Conclusion:
The Profitable Pair Correlation Divergence Scanner v6 is designed for traders who want systematic, low-risk, positive P&L trading opportunities with minimal manual monitoring. By combining trend alignment, momentum confirmation, correlation filters, and dynamic exits, it reduces false signals and improves execution reliability.
Run it on TradingView and watch how it captures divergence opportunities while maintaining positive P&L across trades.

Indian Scalper 2025 – PSAR + SMA50 + RSI≤50 + High Volume (75%)Best 1-min / 2-min scalping strategy for NIFTY, BANKNIFTY, FINNIFTY & liquid stocks in 2025
✓ PSAR flip + SMA-50 trend filter
✓ RSI ≤50 (avoids chasing)
✓ Only high-volume candles (bright colour)
✓ Loud mobile alerts with price & SL
✓ 1:2+ RR with PSAR trailing
Works like magic 9:15–11:30 AM and 2–3:20 PM
Made with love for the Indian trading community ♥
