ANN BTC MTF CM Sling Shot SystemHi all, this script was created as a result of ANN training in all time frames of bitcoin data.
Trained data is built on Chris Moody's Sling Shot system.
CM Sling Shot System :
This system automatically generates the ANN output for all time periods.
Therefore, it has multi-time-frame feature.
Artificial Neural Networks training details:
Average Errors
1 minute = 0.005570
3 minutes = 0.006674
5 minutes = 0.007067
15 minutes = 0.010000
30 minutes = 0.009398
45 minutes = 0.010000
1 Hour = 0.006848
2 Hours = 0.006901
3 Hours = 0.009608
4 Hours = 0.009774
1 Day = 0.010000
1 Week = 0.010000
The results look good (All Average Error <= 0.01 ), the Sling Shot Method is also good, but you can also refer to historically slower period averages to filter these arrows a bit more. I leave the decision to you.
Best regards.
In den Scripts nach "ai" suchen

Macroeconomic Artificial Neural Networks
This script was created by training 20 selected macroeconomic data to construct artificial neural networks on the S&P 500 index.
No technical analysis data were used.
The average error rate is 0.01.
In this respect, there is a strong relationship between the index and macroeconomic data.
Although it affects the whole world,I personally recommend using it under the following conditions: S&P 500 and related ETFs in 1W time-frame (TF = 1W SPX500USD, SP1!, SPY, SPX etc. )
Macroeconomic Parameters
Effective Federal Funds Rate (FEDFUNDS)
Initial Claims (ICSA)
Civilian Unemployment Rate (UNRATE)
10 Year Treasury Constant Maturity Rate (DGS10)
Gross Domestic Product , 1 Decimal (GDP)
Trade Weighted US Dollar Index : Major Currencies (DTWEXM)
Consumer Price Index For All Urban Consumers (CPIAUCSL)
M1 Money Stock (M1)
M2 Money Stock (M2)
2 - Year Treasury Constant Maturity Rate (DGS2)
30 Year Treasury Constant Maturity Rate (DGS30)
Industrial Production Index (INDPRO)
5-Year Treasury Constant Maturity Rate (FRED : DGS5)
Light Weight Vehicle Sales: Autos and Light Trucks (ALTSALES)
Civilian Employment Population Ratio (EMRATIO)
Capacity Utilization (TOTAL INDUSTRY) (TCU)
Average (Mean) Duration Of Unemployment (UEMPMEAN)
Manufacturing Employment Index (MAN_EMPL)
Manufacturers' New Orders (NEWORDER)
ISM Manufacturing Index (MAN : PMI)
Artificial Neural Network (ANN) Training Details :
Learning cycles: 16231
AutoSave cycles: 100
Grid
Input columns: 19
Output columns: 1
Excluded columns: 0
Training example rows: 998
Validating example rows: 0
Querying example rows: 0
Excluded example rows: 0
Duplicated example rows: 0
Network
Input nodes connected: 19
Hidden layer 1 nodes: 2
Hidden layer 2 nodes: 0
Hidden layer 3 nodes: 0
Output nodes: 1
Controls
Learning rate: 0.1000
Momentum: 0.8000 (Optimized)
Target error: 0.0100
Training error: 0.010000
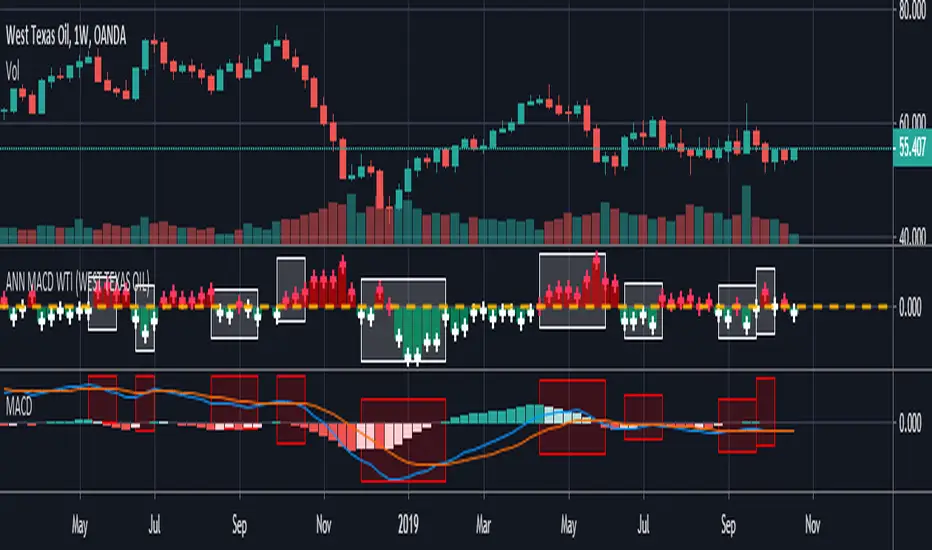
NOTE : Alerts added . The red histogram represents the bear market and the green histogram represents the bull market.
Bars subject to region changes are shown as background colors. (Teal = Bull , Maroon = Bear Market )
I hope it will be useful in your studies and analysis, regards.

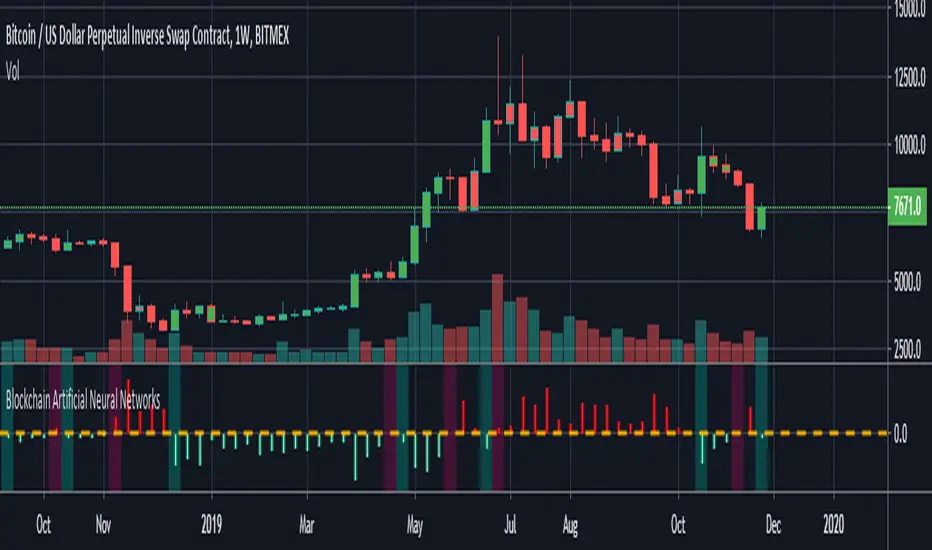
Blockchain Artificial Neural NetworksI found a very high correlation in a research-based Artificial Neural Networks.(ANN)
Trained only on daily bars with blockchain data and Bitcoin closing price.
NOTE: It does not repaint strictly during the weekly time frame. (TF = 1W)
Use only for Bitcoin .
Blockchain data can be repainted in the daily time zone according to the description time.
Alarms are available.
And you can also paint bar colors from the menu by region.
After making reminders, let's share the details of this interesting research:
INPUTS :
1. Average Block Size
2. Api Blockchain Size
3. Miners Revenue
4. Hash Rate
5. Bitcoin Cost Per Transaction
6. Bitcoin USD Exchange Trade Volume
7. Bitcoin Total Number of Transactions
OUTPUTS :
1. One day next price close (Historical)
TRAINING DETAILS :
Learning cycles: 1096436
AutoSave cycles: 100
Grid :
Input columns: 7
Output columns: 1
Excluded columns: 0
Training example rows: 446
Validating example rows: 0
Querying example rows: 0
Excluded example rows: 0
Duplicated example rows: 0
Network :
Input nodes connected: 7
Hidden layer 1 nodes: 5
Hidden layer 2 nodes: 0
Hidden layer 3 nodes: 0
Output nodes: 1
Controls :
Learning rate: 0.1000
Momentum: 0.8000
Target error: 0.0100
Training error: 0.010571
The average training error is really low, almost worth the target.
Without using technical analysis data, we established Artificial Neural Networks with blockchain data.
Interesting!
Open Source Ichimoku Kinkō hyō Keizen 改善Open Source Ichimoku Kinkō hyō Keizen 改善
First of all, thank you for using my work, making changes and continuing to share it for free.
I chose as indicator name Ichimoku Kinkō hyō Keizen logically simply by
what the word Keizen reflects a Japanese method which means continuous improvement and quality.
The goal here is to correct already any offset faults that should not be present and to try
to bring the indicator of new things that can serve and advance
and provide additional support for the decision.
A continuation will surely be planned which will bring its batch of new elements which will come
naturally be grafted to this tool.
Possibility of adding or not adding new lines Jun (76), Kan (226), Junkan A, B (676).
- Junakan To be calculated on the average of Jun / Kan 151 periods.
- Junkan B calculate over the 676 periods.
- Possibility of adding or not adding a new kinkohoyo calculate on Jun (76) and Kan (226).
- Possibility of adding or not adding a new Kumo calculate over 676 periods.
- Possibility of coloring or not the kumos or the kinkohyos.
- Possibility of adding or not Chikō 9,26,52,76,226,676.
- Ability to display or not passive lines in the future, 5 shots ahead of the movement of lines, provided that the extremes are not broken.
Thank you:
Thanks to TomQSD to have tested all the different versions of this project and to have contributed his criticism that helped me a lot to develop the tool.
Thanks to Herveo for having agreed to share his code
on the passive lines.
Remarks:
Not all options are activated at the same time.
Please do not uncheck the boxes in style, only change the colors.
To enable or disable lines, go to input parameters.
//////////////////////////////////////////////////////////////////////////////////////////////////////////////////////////////////////////////////////////////////////////////////////////////////////////////////////////////////
Open Source Ichimoku Kinkō hyō Keizen 改善
Tous d'abord, merci d'utiliser mon travail, d'apporter des modification et de continuer à le partager gratuitement.
J'ai choisi comme nom d’indicateur Ichimoku Kinkō hyō Keizen en toute logique tout simplement par
ce que le mot Keizen reflète une méthode Japonaise qui veut dire amélioration en continue et qualité.
Le but ici est de corriger déjà tout les défauts de décalage qui ne devraient pas être présents et d’essayer
d’apporter sans trop charger l’indicateur des choses nouvelles qui peuvent servir et faire progresser
et apporter une aide supplémentaire à la décision.
Une suite sera sûrement prévue qui apportera son lot d'éléments nouveaux qui viendront
naturellement se greffer à cet outil.
- Possibilité d’ajout ou non de nouvelles lignes Jun (76) , Kan (226) , Junkan A,B (676).
- Junakan A calculer sur la moyenne de Jun/Kan 151 périodes.
- Junkan B calculer sur les 676 périodes.
- Possibilité d’ajout ou non d’un nouveau kinkohoyo calculer sur le Jun (76) et le Kan (226).
- Possibilité d’ajout ou non d’un nouveau Kumo calculer sur 676 périodes.
- Possibilité de colorier ou non le ou les kumos et le ou les kinkohyos.
- Possibilité d’ajout ou non de Chikō 9,26,52,76,226,676.
- Possibilité d’afficher ou non de lignes passives dans le future, 5 coups d’avance sur les déplacement des lignes, a condition que les extrêmes ne soient pas rompu.
Remerciement :
Merci à TomQSD d'avoir tester toutes les différentes versions de ce projet et d’avoir apporter sa critique qui m'a beaucoup aidé à développer l’outil.
Merci à Herveo pour sont accord d’avoir bien voulu partager son code
sur les lignes passives.
Remarques:
Toutes les options ne sont pas toutes à activer en même temps.
Merci de ne pas décocher les cases dans style, modifiez seulement les couleurs.
Pour activer ou désactiver des lignes, allez dans paramètres en entrée.

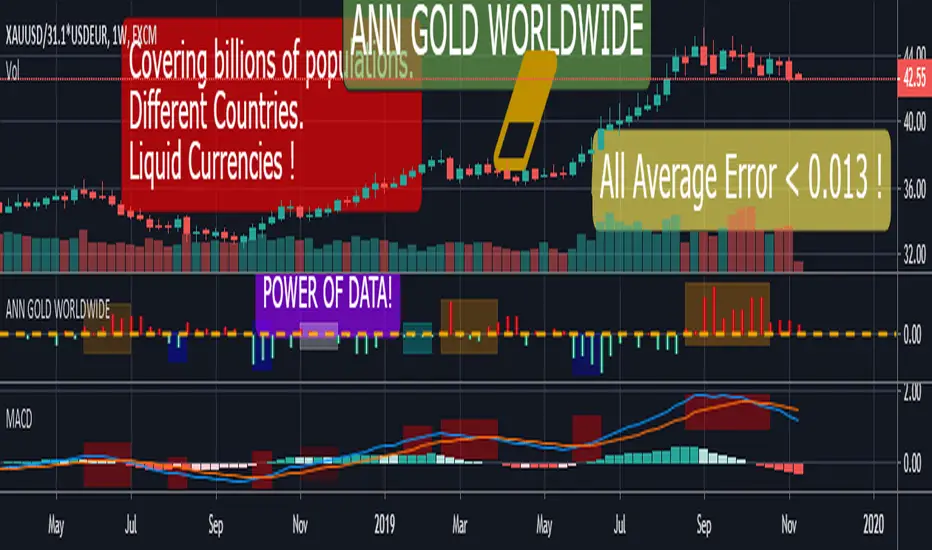
ANN GOLD WORLDWIDE This script consists of converting the value of 1 gram and / or 1 ounce of gold according to the national currencies into a system with artificial neural networks.
Why did I feel such a need?
Even though the printed products in the market are digitally circulated, only precious metals are available in full or near full.
Silver is difficult to carry because you have to buy too much because the unit price is low.
Platinum is very difficult to find and used in industry.
Gold is both practical and has less volatile movements, even more balanced than dollars, to preserve the value of money.
Uncertainty and tensions benefit gold.
Obviously this is my own opinion and is not worth the investment advice:
If there is to be an economic crisis, it is obvious that the dollar will rise against the emerging currencies, but I expect a crisis where gold and the dollar will rise together.
The world has been on a mercantilist line more than ever!
Spot gold can be bought from goldsmiths and banks.
I think this command will benefit people everywhere but in economies that are subject to developing currencies.
Now we can look at the details:
All you have to do is load the appropriate chart and select it from the menu.
Thus, the system will adjust itself to that instrument.
MENU and Tickers :
"GOLD" : XAUUSD or GC1! or GOLD (Average error = 0.0128)
"GOLDSILVER" : XAUXAG or GOLDSILVER (Gold Silver Ratio ) ( Average error : 0.01 )
"GOLD CZK " : XAUUSD/USDCZK ( 1 Ounce Gold Czech Koruna) ( Average error = 0.010879 )
"GOLD NZD " : XAUUSD/USDNZD ( 1 Ounce Gold New Zealand Dollar ) (Average error = 0.010736 )
"GOLD EURO" : XAUUSD/USDEUR ( 1 Ounce Gold Euro) ( Average error = 0.010000 )
"GOLD HUF " : XAUUSD/USDHUF ( 1 Ounce Gold Hungarian Forint ) ( Average error = 0.010000 )
"GOLD INR " : XAUUSD/USDINR (1 Ounce Gold Indian Rupee ) (Average error = 0.010458 )
"GOLD DKK" : XAUUSD/USDDKK (1 Ounce Gold Danish Krone) (Average error = 0.010671 )
"GOLD CHF" : XAUUSD/USDCHF (1 Ounce Gold Swiss Franc ) (Average error = 0.010967 )
"GOLD CNH" : XAUUSD/USDCNH(1 Ounce Gold Offshore RMB) (Average error = 0.012017 )
"GOLD MXN" : XAUUSD/USDMXN(1 Ounce Gold Mexican Peso) (Average error = 0.010000 )
"GOLD PLN" : XAUUSD/USDPLN (1 Ounce Gold Polish Zloty ) (Average error = 0.010173 )
"GOLD ZAR" : XAUUSD/USDZAR (1 Ounce Gold South African Rand (Average error = 0.010484 )
"GOLD NOK" : XAUUSD/USDNOK (1 Ounce Gold Norwegian Krone ) (Average error = 0.010842 )
"GOLD TRY" : XAUUSD/USDTRY (1 Ounce Gold Turkish Lira ) (Average error = 0.010000 )
"GOLD THB" : XAUUSD/USDTHB (1 Ounce Gold Thai Baht ) (Average error = 0.011747 )
Important note : XAUUSD/USDCUR = 1 Ounce Gold , XAUUSD/31.1*USDCUR = 1 gram Gold (CUR = Currency )
If you want to physically hold it, look gram value, because as far as I know, all goldsmiths and jewelleries in the world are selling gram gold.
I think that this command is the most useful and the concrete one that I have ever written.
I end my sentences with this anonymous proverb :
"Even if gold falls into the mud, it's still gold ! "


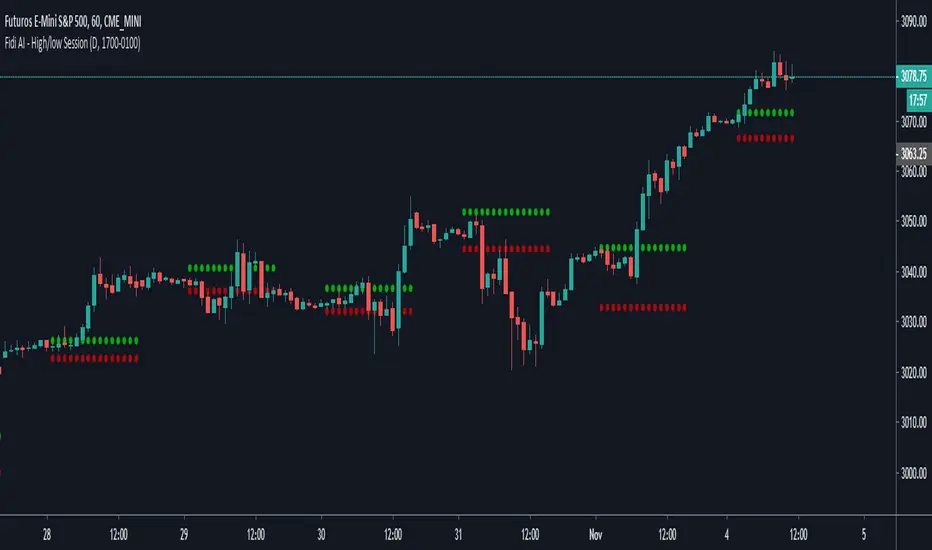
Fide AI - High/low SessionDraw the high and low of the specific session until the start the session again.
ANN MACD : 25 IN 1 SCRIPTIn this script, I tried to fit deep learning series to 1 command system up to the maximum point.
After selecting the ticker, select the instrument from the menu and the system will automatically turn on the appropriate ann system.
Listed instruments with alternative tickers and error rates:
WTI : West Texas Intermediate (WTICOUSD , USOIL , CL1! ) Average error : 0.007593
BRENT : Brent Crude Oil (BCOUSD , UKOIL , BB1! ) Average error : 0.006591
GOLD : XAUUSD , GOLD , GC1! Average error : 0.012767
SP500 : S&P 500 Index (SPX500USD , SP1!) Average error : 0.011650
EURUSD : Eurodollar (EURUSD , 6E1! , FCEU1!) Average error : 0.005500
ETHUSD : Ethereum (ETHUSD , ETHUSDT ) Average error : 0.009378
BTCUSD : Bitcoin (BTCUSD , BTCUSDT , XBTUSD , BTC1!) Average error : 0.01050
GBPUSD : British Pound (GBPUSD,6B1! , GBP1!) Average error : 0.009999
USDJPY : US Dollar / Japanese Yen (USDJPY , FCUY1!) Average error : 0.009198
USDCHF : US Dollar / Swiss Franc (USDCHF , FCUF1! ) Average error : 0.009999
USDCAD : Us Dollar / Canadian Dollar (USDCAD) Average error : 0.012162
SOYBNUSD : Soybean (SOYBNUSD , ZS1!) Average error : 0.010000
CORNUSD : Corn (ZC1! ) Average error : 0.007574
NATGASUSD : Natural Gas (NATGASUSD , NG1!) Average error : 0.010000
SUGARUSD : Sugar (SUGARUSD , SB1! ) Average error : 0.011081
WHEATUSD : Wheat (WHEATUSD , ZW1!) Average error : 0.009980
XPTUSD : Platinum (XPTUSD , PL1! ) Average error : 0.009964
XU030 : Borsa Istanbul 30 Futures ( XU030 , XU030D1! ) Average error : 0.010727
VIX : S & P 500 Volatility Index (VX1! , VIX ) Average error : 0.009999
YM : E - Mini Dow Futures (YM1! ) Average error : 0.010819
ES : S&P 500 E-Mini Futures (ES1! ) Average error : 0.010709
GAZP : Gazprom Futures (GAZP , GZ1! ) Average error : 0.008442
SSE : Shangai Stock Exchange Composite (Index ) ( 000001 ) Average error : 0.011287
XRPUSD : Ripple (XRPUSD , XRPUSDT ) Average error : 0.009803
Note 1 : Australian Dollar (AUDUSD , AUD1! , FCAU1! ) : Instrument has been removed because it has an average error rate of over 0.13.
The average error rate is 0.1850.
I didn't delete it from the menu just because there was so much request,
You can use.
Note 2 : Friends have too many requests, it took me a week in total and 1 other script that I'll share in 2 days.
Reaching these error rates is a very difficult task, and when I keep at a low learning rate, they are trained for a very long time.
If I don't see the error rate at an average low, I increase the layers and go back into a longer process.
It takes me 45 minutes per instrument to command artificial neural networks, so I'll release one more open source, and then we'll be laying 70-80 percent of the world trade volume with artificial neural networks.
Note 3 :
I would like to thank wroclai for helping me with this script.
This script is subject to MIT License on behalf of both of us.
You can review my original idea scripts from my Github page.
You can use it free but if you are going to modify it, just quote this script .
I hope it will help everyone, after 1-2 days I will share another ann script that I think is of the same importance as this, stay tuned.
Regards , Noldo .

ANN MACD WTI (West Texas Intermediate) This script created by training WTI 4 hour data , 7 indicators and 12 Guppy Exponential Moving Averages.
Details :
Learning cycles: 1
AutoSave cycles: 100
Training error: 0.007593 ( Smaller than average target ! )
Input columns: 19
Output columns: 1
Excluded columns: 0
Training example rows: 300
Validating example rows: 0
Querying example rows: 0
Excluded example rows: 0
Duplicated example rows: 0
Input nodes connected: 19
Hidden layer 1 nodes: 2
Hidden layer 2 nodes: 6
Hidden layer 3 nodes: 0
Output nodes: 1
Learning rate: 0.7000
Momentum: 0.8000
Target error: 0.0100
Special thanks to wroclai for his great effort.
Deep learning series will continue. But I need to rest my eyes a little :)
Stay tuned ! Regards.
ANN MACD BRENT CRUDE OIL (UKOIL) This script trained with Brent Crude Oil data including 7 basic indicators and 12 Guppy Exponential Moving Averages .
Details :
Learning cycles: 1
Training error: 0.006591 ( Smaller than 0.01 ! )
AutoSave cycles: 100
Input columns: 19
Output columns: 1
Excluded columns: 0
Training example rows: 300
Validating example rows: 0
Querying example rows: 0
Excluded example rows: 0
Duplicated example rows: 0
Input nodes connected: 19
Hidden layer 1 nodes: 2
Hidden layer 2 nodes: 6
Hidden layer 3 nodes: 0
Output nodes: 1
Learning rate: 0.7000
Momentum: 0.8000
Target error: 0.0100
Note : Alerts added .
Special thanks to wroclai for his great effort.
Deep learning series will continue , stay tuned ! Regards.

ANN MACD GOLD (XAUUSD)This script aims to establish artificial neural networks with gold data.(4H)
Details :
Learning cycles: 329818
Training error: 0.012767 ( Slightly above average but negligible.)
Input columns: 19
Output columns: 1
Excluded columns: 0
Training example rows: 300
Validating example rows: 0
Querying example rows: 0
Excluded example rows: 0
Duplicated example rows: 0
Input nodes connected: 19
Hidden layer 1 nodes: 5
Hidden layer 2 nodes: 1
Hidden layer 3 nodes: 0
Output nodes: 1
Learning rate: 0.7000
Momentum: 0.8000
Target error: 0.0100
NOTE : Alarms added.
And special thanks to dear wroclai for his great effort.
Deep learning series will continue . Stay tuned! Regards.

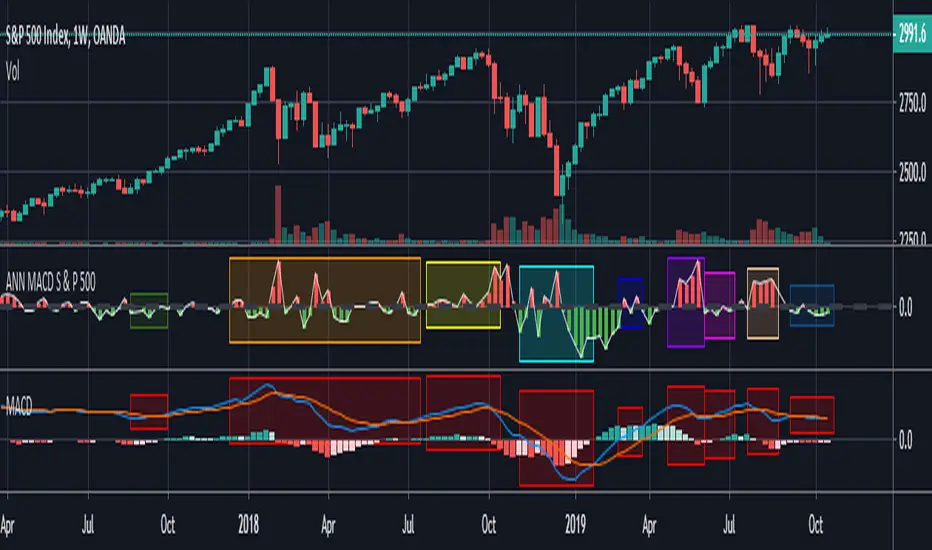
ANN MACD S&P 500 This script is formed by training the S & P 500 Index with various indicators. Details :
Learning cycles: 78089
AutoSave cycles: 100
Training error: 0.011650 (Far less than the target, but acceptable.)
Input columns: 19
Output columns: 1
Excluded columns: 0
Training example rows: 300
Validating example rows: 0
Querying example rows: 0
Excluded example rows: 0
Duplicated example rows: 0
Input nodes connected: 19
Hidden layer 1 nodes: 2
Hidden layer 2 nodes: 1
Hidden layer 3 nodes: 0
Output nodes: 1
Learning rate: 0.7000
Momentum: 0.8000
Target error: 0.0100
Note : Thanks for dear wroclai for his great effort .
Deep learning series will continue . Stay tuned! Regards.
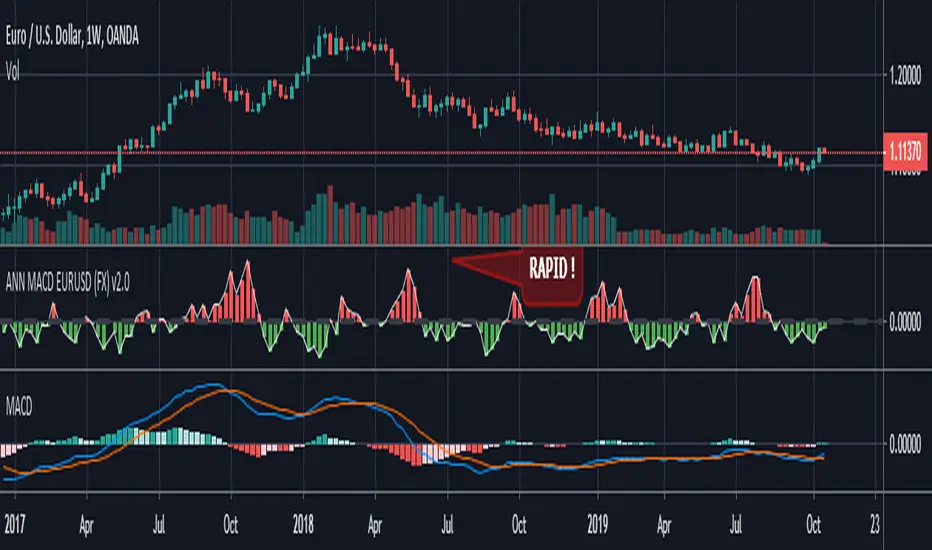
ANN MACD EURUSD (FX) Hello , this script is trained with eurusd 4-hour data. (550 columns) Details :
Learning cycles: 8327
AutoSave cycles: 100
Training error: 0.005500 ( That's a very good error coefficient.)
Input columns: 19
Output columns: 1
Excluded columns: 0
Training example rows: 550
Validating example rows: 0
Querying example rows: 0
Excluded example rows: 0
Duplicated example rows: 0
Input nodes connected: 19
Hidden layer 1 nodes: 2
Hidden layer 2 nodes: 5
Hidden layer 3 nodes: 0
Output nodes: 1
Learning rate: 0.6000
Momentum: 0.8000
Target error: 0.0055
NOTE : Use with EURUSD only.
Alarms added.
Thanks dear wroclai for his great effort.
Deep learning series will continue ! Stay tuned.
Regards , Noldo .
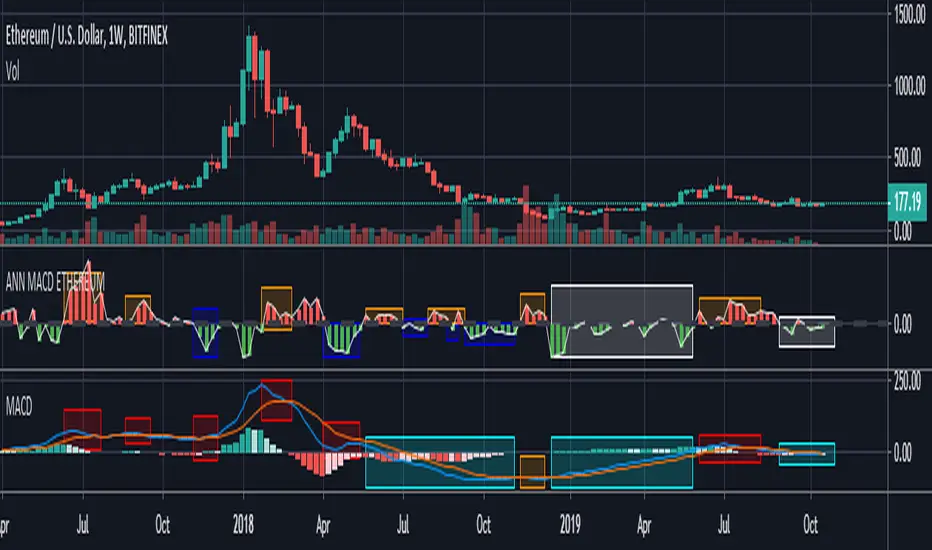
ANN MACD ETHEREUM
This script is trained with Ethereum (Timeframe : 4 hours ).
Details :
Input columns: 19
Output columns: 1
Excluded columns: 0
Training example rows: 300
Validating example rows: 0
Querying example rows: 0
Excluded example rows: 0
Duplicated example rows: 0
Input nodes connected: 19
Hidden layer 1 nodes: 8
Hidden layer 2 nodes: 1
Hidden layer 3 nodes: 0
Output nodes: 1
Learning rate: 0.7000
Momentum: 0.8000
Training error: 0.009378 ( That's a very good error coefficient. )
Many thanks to wroclai for help.
Deep learning series will continue!
ANN MACD BTC v2.0 This script is the 2nd version of the BTC Deep Learning (ANN) system.
Created with the following indicators and tools:
RSI
MACD
MOM
Bollinger Bands
Guppy Exponential Moving Averages:
(3,5,8,10,12,15,30,35,40,45,50,60)
Note: I was inspired by the CM Guppy Ema script.
Thank you very much to dear wroclai for his great help.
He has been a big help in the deep learning series.
That's why the licenses in this series are for both of us.
I'm sharing these series and thats the first. Stay tuned and regards!
Note : Alerts added.

SPY FRACTAL S-R LEVELS (FIXED ANN MACD)
This is a fractal version of my deep learning script for SPY
In addition, buy and sell conditions may appear in bar colors in green and red.
You can choose from the menu if you wish.
Fractal codes do not belong to me.
So I didn't put any license.
You can use it as you want, you can change and modify.
Regards.Noldo

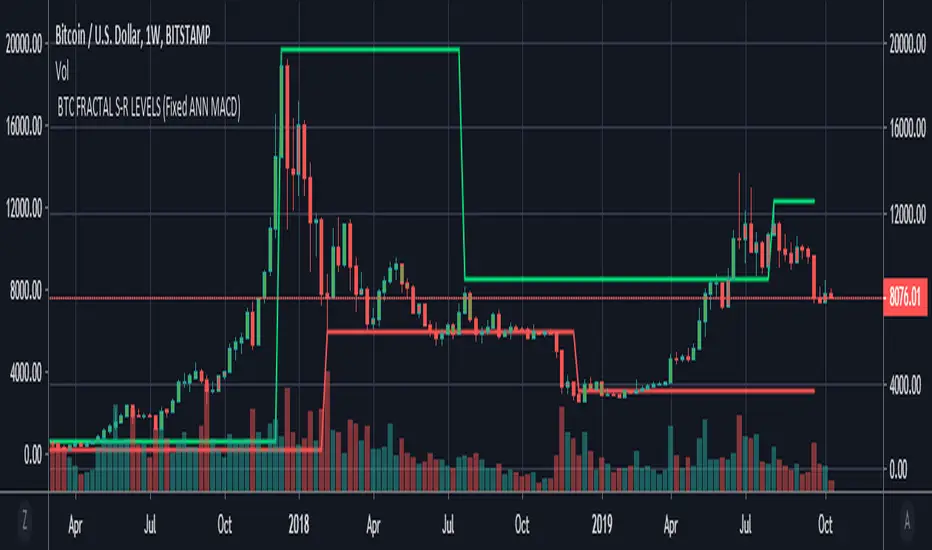
BTC FRACTAL ANN S-R LEVELS (Fixed ANN MACD)
This script is an adaptation of my deep learning system for Bitcoin to fractals.
Fractal codes are not belong to me. Original :
The code for the Deep learning (ANN MACD BTC) work belongs to me. Original:
I didn't get license for this script because the fractal codes don't belong to me.You can use it for any purpose.
This command can be a very helpful guide.You can use that fractals with your indicators for Bitcoin.
You can also combine these levels with ANN - MACD - BTC script.
Scripts about Artificial Neural Networks (ANN) will continue soon !
I hope it will help us to gain insight into technical analysis.
Best regards. Noldo.
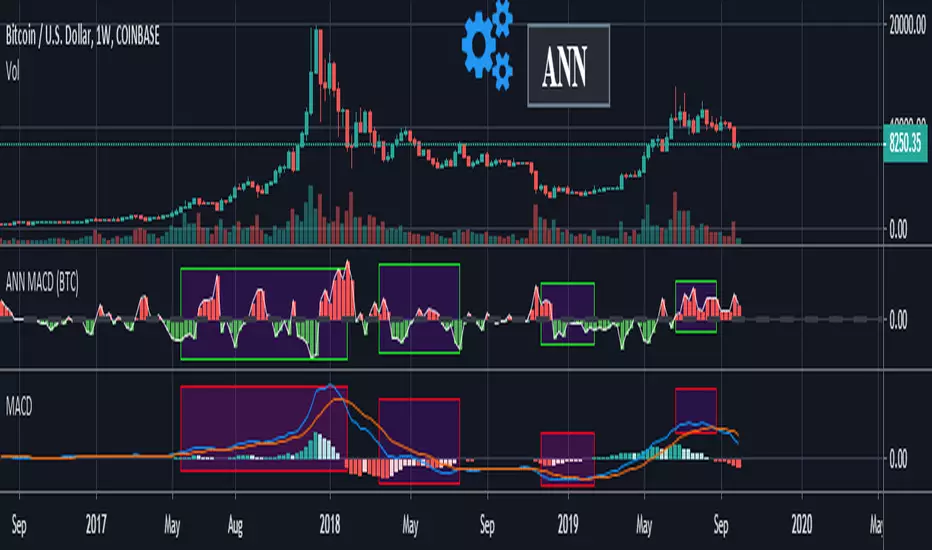
ANN MACD (BTC)
Logic is correct.
But I prefer to say experimental because the sample set is narrow. (300 columns)
Let's start:
6 inputs : Volume Change , Bollinger Low Band chg. , Bollinger Mid Band chg., Bollinger Up Band chg. , RSI change , MACD histogram change.
1 output : Future bar change (Historical)
Training timeframe : 15 mins (Analysis TF > 4 hours (My opinion))
Learning cycles : 337
Training error: 0.009999
Input columns: 6
Output columns: 1
Excluded columns: 0
Grid
Training example rows: 301
Validating example rows: 0
Querying example rows: 0
Excluded example rows: 0
Duplicated example rows: 0
Network
Input nodes connected: 6
Hidden layer 1 nodes: 8
Hidden layer 2 nodes: 0
Hidden layer 3 nodes: 0
Output nodes: 1
Learning rate : 0.6 Momentum : 0.8
More info :
EDIT : This code is open source under the MIT License. If you have any improvements or corrections to suggest, please send me a pull request via the github repository github.com
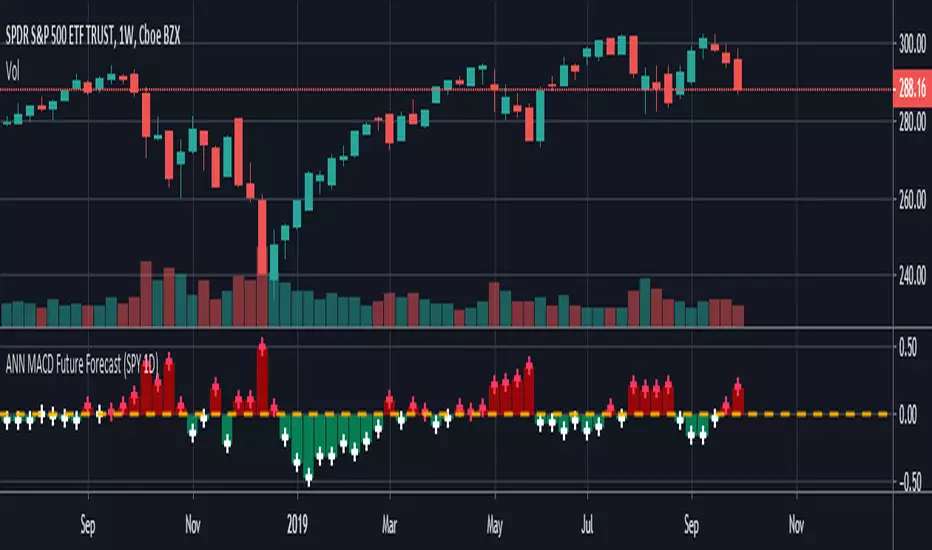
ANN MACD Future Forecast (SPY 1D) NOTE : Deep learning was conducted in a narrow sample set for testing purposes. So this script is Experimental .
This system is based on the following article and is inspired by an external program:
hackernoon.com
None of the artificial neural networks in Tradingview work and are not based on completely correct logic. Unlike others in this system:
IMPORTANT NOTE: If the tangent activation function is used, the input data must also have tangent values (compared to the previous values of 1 bar).
Inputs were prepared according to this judgment.
1. The tangent function which is the activation function is written correctly. (The tangent function in the article: ActivationFunctionTanh (v) => (1 - exp (-2 * v)) / (1 + exp (-2 * v)))
2. Missing bias parts in the formulas were added.
3. The output function is taken from the next day (historical), so that the next bar can be predicted, which is the truth.
4.The forecast value of the next bar is subtracted from the current bar change and the market direction is determined.
5.When the future forecast and the current close are added together, the resulting data is called seed.
The seed carries data both from the present and from yesterday and from the future.
6.And this seed was subjected to the MACD method.
Thus, due to exponential averages, more importance will be given to recent developments and
The acceleration situations will show us the direction.
However, a short position should be taken for crossover and a long position for crossunder .
Because the predicted values work in reverse.Even though we use the same period (9,12,26) it is much faster!
7. There is no future code that can cause Repaint.
However, the color after closing should be checked.
The system is completely correct.
However, a very narrow sample was selected.
100 data: Tangent diffs ; volume change, bollinger bands values changes (Upband , Midband , Lowband) and LazyBear's Squeeze Momentum Indicator (SQZMOM_LB) change and the next bar data (historical) price change were put into the deep learning test.
IMPORTANT NOTE : The larger the sample set and the more effective dependent variables, the higher the hit rate of the deep learning test!
EDIT : This code is open source under the MIT License. If you have any improvements or corrections to suggest, please send me a pull request via the github repository github.com
Stay tuned. Best regards!
Ichimoku trendfollowingIchimoku più che un indicatore potrebbe essere considerato un sistema di trading.
Ho quindi voluto implementare una strategia che utilizzasse soltanto i segnali che offre per l'ingresso ed uscita per verificarne l'efficacia nel lungo periodo su i diversi strumenti.
I segnali che offre sono i seguenti:
1) il prezzo taglia la tenkan (segnale molto debole per un ingresso)
2) il prezzo taglia la kijun (possibile trade in controtrend fino alla kumo)
3) tenkan incrocia la linea kijun
4) uscita della linea chikou span dal prezzo: se la linea è sotto il prezzo valutare solo short, se sopra valutare solo long, se sopra il prezzo si è in correzione ed è meglio restare flat
5) prezzo entra dentro la kumo. (Non si entra in posizione dentro la kuno)
6) la kumo cambia colore (conferma direzione del trend in atto)
7) uscita dal prezzo dalla kumo
8) uscita della tenkan dalla kumo (conferma situazione)
9) uscita kijun dalla kumo (conferma situazione)
10) trend in corso con chiusura del prezzo fra la chikou span da una parte, tenkan, kijun e kumo dall'altra.
Ichimoku è solitamente utilizzato come sistema trendfollowing, quindi considererò solo i segenti possibili ingressi:
1) breakout kumo (inizio trend di lungo periodo)
2) pullback (inizio trend di medio periodo o ripresa trend dopo correzione profonda con pullback su kumo)
le uscite tradizionali sono:
1) prezzo chiude sotto la kijun
2) SL inizialmente su minimo candela che rompe il livello
Filtri da applicare ai singoli ingressi:
Filtro long:
Close>kumo and chikou span > prezzo corrispondente and
Filtro short
Close

simple botthe AI=
value of close of candle < value of close of candle previous by 1 = sell
close > close1 = buy
closeorder on SL
closeorder on AutoProfit
closeorder on signal reverse (if openorder not in profit)
