Fusion: Machine Learning SuiteThe Fusion: Machine Learning Suite combines multiple technical analysis dimensions and harnesses the predictive power of machine learning, seamlessly integrating a diverse array of classic and novel indicators to deliver precision, adaptability, and innovation.
Features and Capabilities
Multidimensional Analysis: Fusion: MLS integrates various technical analysis dimensions to offer a more comprehensive perspective.
Machine Learning Integration: Utilizing ML algorithms, Fusion: MLS offers adaptability to market changes.
Custom Indicators: Including dimensions like "Moon Lander", "Cap Line" and "Z-Pack" the indicator expands the scope of traditional technical analysis methods.
Tailored Customization: With customization options, Fusion: MLS allows traders to configure the tool to suit their specific strategies and market focus.
In the following sections, we'll explore the features and settings of Fusion: MLS in detail, providing insights into how it can be utilized.
Major Features and Settings
The indicator consists of several core components and settings, each designed to provide specific functionalities and insights. Here's an in-depth look:
Machine Learning Component
Distance Classifier: A Strategic Approach to Market Analysis
In the world of trading and investment, the ability to classify and predict price movements is paramount. Machine learning offers powerful tools for this purpose.
The Fusion: MLS indicator among others incorporates an Approximate Nearest Neighbors (ANN)* algorithm, a machine learning classification technique, and allows the selection of various distance functions .
This flexibility sets Fusion: MLS apart from existing solutions. The available distance functions include:
Euclidean: Standard distance metric, commonly used as a default.
Chebyshev: Also known as maximum value distance.
Manhattan: Sum of absolute differences.
Minkowski: Generalized metric that includes Euclidean and Manhattan as special cases.
Mahalanobis: Measures distance between points in a correlated space.
Lorentzian: Known for its robustness to outliers and noise.
*For a deeper understanding of the Approximate Nearest Neighbors (ANN) algorithm, traders are encouraged to refer to the relevant articles that can be found in the public domain.
Alternative scoring system
Fusion: MLS also includes a custom scoring alternative based on directional price action.
"Combined: Directional" and "Alpha: Directional" scoring types represent our own directional change algorithm, simple yet effective in displaying trend direction changes early on. They are visualized by color changes when scoring becomes below or above zero.
Changes in scoring quickly reflect shifts in buyer and seller sentiment.
Traders may choose signals by Color Change in the indicator settings to get alerts when scoring color shifts, not waiting until the histogram crosses the zero level.
Application in Trading
Machine learning classification has become an integral part of modern trading, offering innovative ways to analyze and interpret financial data.
Many algorithmic trading systems leverage ML classification to automate trading decisions. By continuously learning from real-time data, these systems can adapt to changing market conditions and execute trades with increased efficiency and accuracy.
ML classification allows for the development of tailored trading strategies as traders can select specific algorithms, dimensions, and filters that align with their trading style, goals, and the particular market they are operating.
We have integrated ML classification with traditional trading tools, such as moving averages and technical indicators. This fusion creates a more robust analysis framework, combining the strengths of classical techniques with the adaptability of machine learning.
Whether used independently or in conjunction with other tools, ML classification represents a significant advancement in trading technology, opening new avenues for exploration, innovation, and success in the financial world.
ML: Weighting System
The Fusion: MLS indicator introduces a unique weighting system that allows traders to customize the influence of various technical indicators in the machine learning process. This feature is not only innovative but also provides a level of control and adaptability that sets it apart from other indicators.
Customizable Weights
The weighting system allows users to assign specific weights to different indicators such as Moon Lander, RSI, MACD, Money Flow, Bollinger Bands, Cap Line, Z-Pack, Squeeze Momentum*, and MA Crossover. These weights can be adjusted manually, providing the ability to emphasize or de-emphasize specific indicators based on the trader's strategy or market conditions.
*Note, we determined via testing that the popular "Squeeze" indicator can actually be well replicated by simply using inputs of 15 & 199 in the bedrock indicator - MACD ; while we employed the standard "Squeeze" formula (developed by J. Carter ) in Fusion: MLS, traders are hereby made aware of our research findings regarding such.
The weighting system's importance lies in its ability to provide a more nuanced and personalized analysis. By adjusting the weights of different indicators a trader focusing on momentum strategies might assign higher weights to the Squeeze Momentum and MA Crossover indicators, while a trader looking for volatility might emphasize RSI and Bollinger Bands.
The ability to customize weights adds a layer of complexity and adaptability that is rare in standard machine-learning indicators.
Custom Indicators: Moon Lander
The "Moon Lander" is not just a catchy name; it's a robust feature inspired by principles from aerospace engineering and offers a unique perspective on trading analysis. Here's a conceptual overview:
Fast EMA and Kalman Matrix
"Moon Lander" incorporates both a Fast Exponential Moving Average (EMA) and a Kalman Matrix in its design. These two elements are combined to create a histogram, providing a specific approach to data analysis.
The Kalman Matrix, or Kalman Filter, is a mathematical concept used for estimating variables that can be measured indirectly and contain noise or uncertainty. It's a standard tool in machine learning and control systems, known for its ability to provide optimal estimates based on observed data.
Kalman Filter: A Navigational Tool
The Kalman filter, an essential part of "Moon Lander," is a mathematical concept known for its applications in navigation and control systems used by NASA in the apollo program :
Guidance in Uncertainty: Just as the Kalman filter helped guide complex aerospace missions through uncertain paths, it assists traders in navigating the often unpredictable financial markets.
Filtering Noise: In trading, the Kalman filter serves to filter out market noise, allowing traders to focus on the underlying trends.
Predictive Capabilities: Its ability to predict future states makes it a valuable tool for forecasting market movements and trend directions.
Custom Indicators: Cap Line and Z-Pack
Fusion: MLS integrates our additional proprietary custom indicators that have been published on TradingView earlier:
Cap Line: Delve into the specific functionalities and applications of our proprietary "Cap Line" indicator in the published description on TradingView.
Z-Pack: Explore the analytical perspectives, focused on the z-score methodology, and custom "Z-Pack" indicator by reviewing the published description on TradingView.
Buy/Sell Signal Generation Algorithms
Fusion: MLS offers various options for generating buy/sell signals, tailored to different trading strategies and perspectives:
Fusion: Allows traders to select any number of dimensions to receive buy/sell signals from, offering customized signal generation.
ML: Utilizes the machine learning ANN distance for signal generation.
Color Change: Generates signals by selected scoring type color change.
Displayed Dimension, Alpha Dimension: Generate signals based on specific selected dimensions.
These algorithms provide flexibility in determining buy/sell signals, catering to different trading styles and market conditions.
Filters
Filters are used to refine and selectively include or exclude signals based on specific criteria. Rather than generating signals, these filters act as gatekeepers, ensuring that only the signals meeting certain conditions are considered. Here's an overview of the filters used:
Dynamic State Predictor (DSP)
The DSP employs the Kalman Matrix to evaluate existing signals by comparing the fast and slow-moving averages, both processed through the Kalman Matrix. Based on the relationship between these averages, the DSP may exclude specific signals, depending on whether they align with upward or downward trends.
Average Directional Index (ADX)
The ADX filter evaluates the strength of existing trends and filters out signals that do not meet the specified ADX threshold and length, focusing on significant market movements.
Feature Engineering: RSI
Applies a filter to the existing signals, clearing out those that do not meet the criteria for RSI overbought or oversold threshold condition.
Feature Engineering: MACD
Assesses existing signals to identify changes in the strength, direction, momentum, and duration of a trend, filtering out those that do not align with MACD trend direction.
The Visual Component
The machine learning component is an internal component. However, the indicator also offers an equally important and useful visual component. It is a graphical representation of the multiple technical analysis dimensions, that can be combined in various ways (where the name "Fusion" comes from), allowing traders to visualize the underlying data and its analysis.
Displayed Dimension: Visualization and Normalization
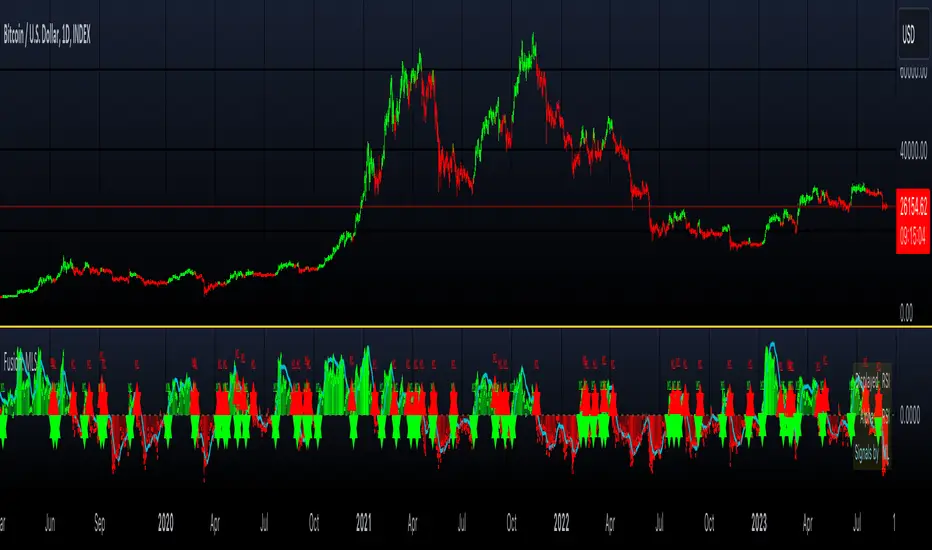
The Fusion: MLS indicator offers a "Displayed Dimension" feature that visualizes various dimensions as a histogram. These dimensions may include RSI, MAs, BBs, MACD, etc.
RSI Dimension on the image + ML signals
Normalization: Each dimension is normalized. If any dimension has extreme values, a Fisher transformation is applied to bring them within a reasonable range.
Combined Dimension: When selecting the "Combined" option , the normalized values of the selected dimensions are combined using techniques such as standardization, normalization, or winsorization. This flexibility enables tailored visualization and analysis.
Alpha Dimension: Enhancing Analysis
The "Alpha Dimension" feature allows traders to select an additional dimension alongside the Displayed Dimension. This facilitates a combined analysis, enhancing the depth of insights.
Theme Selection
Fusion: MLS offers various themes such as "Sailfish", "Iceberg", "Moon", "Perl", "Candy" and "Monochrome" Traders can select a theme that resonates with their preference, enhancing visual appeal. There is also a "Custom" theme available that allows the user to choose the colors of the theme.
Customizing Fusion: MLS for Various Markets and Strategies
Fusion: MLS is designed with customization in mind. Traders can tailor the indicator to suit various markets and trading strategies. Selecting specific dimensions allows it to align with individual trading goals.
Selecting Dimensions: Choose the dimensions that resonate with your trading approach, whether focusing on trend-following, momentum, or other strategies.
Adjusting Parameters: Fine-tune the parameters of each dimension, including custom ones like "Moon Lander," to suit specific market conditions.
Theme Customization: Select a theme that aligns with your visual preferences, enhancing your chart's readability and appeal.
Utilizing Research: Leverage the underlying algorithms and research, such as machine learning classification by ANN and the Kalman filter, to deepen your understanding and application of Fusion: MLS.
Alerts
The indicator includes an alerting system that notifies traders when new buy or sell signals are detected.
Disclaimer
The information provided herein is intended for informational purposes only and should not be construed as investment advice, endorsement, nor a recommendation to buy or sell any financial instruments. Fusion: MLS is a technical analysis tool, and like all tools, it should be used with caution and in conjunction with other forms of analysis.
Traders and investors are encouraged to consult with a licensed financial professional and conduct their own research before making any trading or investment decisions. Past performance of the Fusion: MLS indicator or any trading strategy does not guarantee future results, and all trading involves risk. Users of Fusion: MLS should understand the underlying algorithms and assumptions and consider their individual risk tolerance and investment goals when using this tool.
In den Scripts nach "adx" suchen
LNL Trend SystemLNL Trend System is an ATR based day trading system specifically designed for intra-day traders and scalpers. The System works on any chart time frame & can be applied to any market. The study consist of two components - the Trend Line and the Stop Line. Trend System is based on a special ATR calculation that is achieved by combining the previous values of the 13 EMA in relation to the ATR which creates a line of deviations that visually look similar to the basic moving average but actually produce very different results ESPECIALLY in sideways market.
Trend Line:
Trend Line is a simple line which is basically a fast gauge represented by the 13 EMA that can change the color based on the current trend structure defined by multiple averages (8,13,21,34 EMAs). Trend Line is there to simply add the confluence for the current trend. Colors of the line are pretty much self-explanatory. Whenever the line turns red it states that the current structure is bearish. Vice versa for green line. Gray line represents neutral market structure.
Stop Line:
Stop Line is an ATR deviaton line with special calculation based on the previous bar ATRs and position of the price in relation to the current and previous values of 13 EMA. As already stated, this creates an ATR deviation marker either above or below the price that trails the price up or down until they touch. Whenever the price comes into the Stop Line it means it is making an ATR expansion move up or down .This touch will usually resolve into a reaction (a bounce) which provides trade opportunities.
Trend Bars:
When turned ON, Trend Bars can provide additional confulence of the current trend alongside with the Trend Line color. Trend Bars are based on the DMI and ADX indicators. Whenever the DMI is bearish and ADX is above 20 the candles paint themselfs red. And vice versa applies for the green candles and bullish DMI. Whenever the ADX falls below the 20, candles are netural (Gray) which means there is no real trend in place at the moment.
Trend Mode:
There are total of 5 different trend modes available. Each mode is visualizing different ATR settings which provides either aggressive or more conservative approach. The more tigher the mode, the more closer the distance between the price and the Stop Line. First two modes were designed for slower markets, whereas the "Loose" and "FOMC" modes are more suitable for products with high volatility.
Trend Modes:
1. Tight
Ideal for the slowest markets. Slowest market can be any market with unusually small average true range values or just simply a market that does have a personality of a "sleeper". Tight Mode can be also used for aggresive entries in the most ridiculous trends. Sometimes price will barely pullback to the Trend Line not even the Stop Line.
2. Normal
Normal Mode is the golden mean between the modes. "Normal" provides the ideal ATR lengths for the most used markets such as S&P Futures (ES) or SPY, AAPL and plenty of other highly popular stocks. More often than not, the length of this mode is respected considering there is no breaking news or high impact market event scheduled.
3. Loose
The "Loose" mode is basically a normal mode but a little bit more loose. This mode is useful whenever the ATRs jump higher than usual or during the days of highly anticipated news events. This mode is also better suited for more active markets such as NQ futures.
4. FOMC
The FOMC mode is called FOMC for a reason. This mode provides the maximum amount of wiggle room between the price and the Stop Line. This mode was designed for the extreme volatility, breaking news events or post-FOMC trading. If the market quiets down, this mode will not get the Stop Line touch as frequently as othete modes, thus it is not very useful to run this on markets with the average volatlity. Although never properly tested, perhaps the FOMC mode can find its value in the crypto market?
5. The Net
The net mode is basically a combination of all modes into one stop line system which creates "the net" effect. The Net provides the widest Stop Line zone which can be mainly appreciated by traders that like to use scale-in scale-out methods for their trading. Not to mention the visual side of the indicator which looks pretty great with the net mode on.
HTF (Higher Time Frame) Trend System:
The system also includes additional higher time frame (HTF) trend system. This can be set to any time frame by manual HTF mode. HTF mode set to "auto" will automatically choose the best suitable higher time frame trend system based on how appropriate the aggregation is. For everything below 5min the HTF Trend System will stay on 5min. Anything between 5-15min = 30min. 30min - 120min will turn on the 240min. 180min and higher will result in Daily time frame. Anything above the Daily will result in Weekly HTF aggregation, above W = Monthly, above M = Quarterly.
Background Clouds:
In terms of visualization, each trend system is fully customizable through the inputs settings. There is also an option to turn on/off the background clouds behind the stop lines. These clouds can make the charts more clean & visible.
Tips & Tricks:
1. Different Trend Modes
Try out different modes in different markets. There is no one single mode that will fit to everyone on the same type of market. I myself actually prefer more Loose than the Normal.
2. Stop Line Mirroring
Whenever the Stop Lines start to mirror each other (there is one above the price and one below) this means the price is entering a ranging sideways market. It does not matter which Stop Line will the price touch first. They can both be faded until one of them flips.
3. Signs of the Ranging Market
Watch out for signs of ranging market. Whenever the Trend System looses its colors whether on trend line or trend bars, if everything turns neutral (gray) that is usually a solid indication of a range type action for the following moments. Also as already stated before, the Stop Line mirroring is a good sign of the range market.
4. Trailing Tool, Trend System as an Additional Study?
In case you are not a fan of the colorful green / red charts & candles. You can switch all of them off and just leave the Stop Line on. This way you can use the benefits of the trend system and still use other studies on top of that. Similarly as the Parabolic SAR is often used.
5. The Flip Setup
One of my favorite trades is the Flip Setup on the 5min charts. Whenever the Stop Line is broken , the very first opposing touch after the Trend System flips is a usually a highly participated touch. If there is a strong reaction, this means this is likely a beginning of a new trend. Once I am in the position i like to trail the Stop Line on the 1min charts.
Hope it helps.

Directional Movement Index FLEXA common problem experienced by short term traders using DMI/ADX is that the session breaks results in carry-over effects from the prior session. For example, a large gap up would result in a positive DMI, even though momentum is clearly negative. Note the extremely different results in the morning session, when the gap is reversed.
The DMI-FLEX algoritm resets the +DI and -DI values to the prior session ending midpoint, so that new momentum can be observed from the indicator. (Note for Pinescript coders: rma function does not accept series int, thus the explicit pine_rma function)
DMI-FLEX has the added feature that the ADX value, instead of a separate line, is shown as shading between the +DI and -DI lines, and the color itself is determined by whether +DI is above -DI for a bullish color, or -DI is above +DI for a bearish color.
DMI Flex also gives you the flexibility of inverse colors, in case your chart has inverted scale.
Summary and How to use:
1) Green when +DI is above -DI
2) Red when -DI is above +DI
3) Deeper shading represents a higher ADX value.

BBO-ALPHA-PHANTOMHello friends, this is the second time I am publishing this script, hopefully the description will be sufficient and you can use it reliably.
Script Description:
The script consists of several indicators and generates buy and sell signals based on their calculations. Here's a breakdown of the functions and indicators used in the script:
Moving Average Convergence Divergence (MACD):
Fast Length: The number of periods used for calculating the fast moving average.
Slow Length: The number of periods used for calculating the slow moving average.
Source: The price source used for calculations (default is the closing price).
Signal Smoothing: The number of periods used for smoothing the signal line.
Oscillator MA Type: The type of moving average used for the oscillator line (default is Exponential Moving Average).
Signal Line MA Type: The type of moving average used for the signal line (default is Exponential Moving Average).
Benefit: MACD is a trend-following momentum indicator that helps identify potential trend reversals, bullish or bearish market conditions, and generate buy and sell signals based on the crossovers of the oscillator and signal lines.
Relative Strength Index (RSI):
RSI Length: The number of periods used for calculating RSI.
RSI Source: The price source used for RSI calculations (default is (high + low + close) / 3).
MA Type: The type of moving average used for smoothing RSI values (default is Simple Moving Average).
MA Length: The number of periods used for smoothing RSI values.
Benefit: RSI is a momentum oscillator that measures the speed and change of price movements. It helps identify overbought and oversold conditions, potential trend reversals, and generate buy and sell signals based on the crossovers of RSI and its moving average.
Money Flow Index (MFI):
MFI Length: The number of periods used for calculating MFI.
Source: The price source used for MFI calculations (default is (high + low + close) / 3).
Benefit: MFI is a momentum indicator that uses both price and volume data to measure buying and selling pressure. It helps identify overbought and oversold conditions and potential trend reversals.
Directional Movement Index (DMI):
Signal Length: The number of periods used for smoothing the ADX line.
Length: The number of periods used for calculating DMI.
Benefit: DMI consists of three lines: ADX, +DI (Plus Directional Indicator), and -DI (Minus Directional Indicator). ADX measures the strength of a trend, while +DI and -DI indicate the direction of the trend. DMI helps identify trend strength, trend direction, and potential trend reversals.
Stochastic Oscillator:
SmoothK: The number of periods used for smoothing %K line.
SmoothD: The number of periods used for smoothing %D line.
Length RSI: The number of periods used for calculating RSI within Stochastic.
Length Stoch: The number of periods used for calculating Stochastic.
Benefit: Stochastic Oscillator is a momentum indicator that compares the closing price of an asset to its price range over a specific period. It helps identify overbought and oversold conditions and potential trend reversals.
Moving Averages (MA):
MA50: Simple Moving Average with a length of 50 periods.
MA200: Simple Moving Average with a length of 200 periods.
Benefit: Moving averages are commonly used to
Advantages of the script compared to common indicators:
Comprehensive analysis: The script combines several indicators such as MACD, RSI, MFI, DMI, Stochastic Oscillator and Moving Averages. It thus provides a broader and more comprehensive view of the market and its development.
Synergy of indicators: Using multiple indicators increases the reliability and confirmation of signals. Combining different indicators can provide potentially stronger and more accurate signals of a trend change.
Identifying Oversold and Overbought Levels: RSI, MFI and Stochastic Oscillator are used to identify oversold and overbought levels in the market. This can help uncover opportunities to buy or sell in line with these levels.
Identifying trends and their strength: DMI and Moving Averages help identify trends in the market and provide information about their strength. This can help traders in deciding the appropriate time to enter and exit the market.
Early signal generation: The script generates signals based on a combination of various indicators, which can help traders identify potential trading opportunities at an early stage.
The main thing for me is that it helps me from overtrading, I only trade when I get an alert or see it on the chart. I recommend
I find it best to trade in the 1h and 2h time frame. The shorter ones like 15min and 30min are perfect for me to get out of the position.
It is important to note that no indicator guarantees 100% accuracy in generating signals and trading on financial

Sniffer
╭━━━╮╱╱╱╱╭━╮╭━╮
┃╭━╮┃╱╱╱╱┃╭╯┃╭╯
┃╰━━┳━╮╭┳╯╰┳╯╰┳━━┳━╮
╰━━╮┃╭╮╋╋╮╭┻╮╭┫┃━┫╭╯
┃╰━╯┃┃┃┃┃┃┃╱┃┃┃┃━┫┃
╰━━━┻╯╰┻╯╰╯╱╰╯╰━━┻╯
Overview
A vast majority of modern data analysis & modelling techniques rely upon the idea of hidden patterns, wether it is some type of visualisation tool or some form of a complex machine learning algorithm, the one thing that they have in common is the belief, that patterns tell us what’s hidden behind plain numbers. The same philosophy has been adopted by many traders & investors worldwide, there’s an entire school of thought that operates purely based on chart patterns. This is where Sniffer comes in, it is a tool designed to simplify & quantify the job of pattern recognition on any given price chart, by combining various factors & techniques that generate high-quality results.
This tool analyses bars selected by the user, and highlights bar clusters on the chart that exhibit similar behaviour across multiple dimensions. It can detect a single candle pattern like hammers or dojis, or it can handle multiple candles like morning/evening stars or double tops/bottoms, and many more. In fact, the tool is completely independent of such specific candle formations, instead, it works on the idea of vector similarity and generates a degree of similarity for every single combination of candles. Only the top-n matches are highlighted, users get to choose which patterns they want to analyse and to what degree, by customising the feature-space.
Background
In the world of trading, a common use-case is to scan a price chart for some specific candlestick formations & price structures, and then the chart is further analysed in reference to these events. Traders are often trying to answer questions like, when was the last time price showed similar behaviour, what are the instances similar to what price is doing right now, what happens when price forms a pattern like this, what were some of other indicators doing when this happened last(RSI, CCI, ADX etc), and many other abstract ideas to have a stronger confluence or to confirm a bias.Having such a context can be vital in making better informed decisions, but doing this manually on a chart that has thousands of candles can have many disadvantages. It’s tedious, human errors are rather likely, and even if it’s done with pin-point accuracy, chances are that we’ll miss out on many pieces of information. This is the thought that gave birth to Sniffer .
Sniffer tries to provide a general solution for pattern-based analysis by deploying vector-similarity computation techniques, that cover the full-breadth of a price chart and generate a list of top-n matches based on the criteria selected by the user. Most of these techniques come from the data science space, where vector similarity is often implemented to solve classification & clustering problems. Sniffer uses same principles of vector comparison, and computes a degree of similarity for every single candle formation within the selected range, and as a result generates a similarity matrix that captures how similar or dissimilar a set of candles is to the input set selected by the user.
How It Works
A brief overview of how the tool is implemented:
- Every bar is processed, and a set of features are mapped to it.
- Bars selected by the user are captured, and saved for later use.
- Once the all the bars have been processed, candles are back-tracked and degree of similarity is computed for every single bar(max-limit is 5000 bars).
- Degree of similarity is computed by comparing attributes like price range, candle breadth & volume etc.
- Similarity matrix is sorted and top-n results are highlighted on the chart through boxes of different colors.
A brief overview of the features space for bars:
- Range: Difference between high & low
- Body: Difference between close & open
- Volume: Traded volume for that candle
- Head: Upper wick for green candles & lower wick for red candles
- Tail: Lower wick for green candles & upper wick for red candles
- BTR: Body to Range ratio
- HTR: Head to Range ratio
- TTR: Tail to Range ratio
- HTB: Head to Body ratio
- TTB: Tail to Body ratio
- ROC: Rate of change for HL2 for four different periods
- RSI: Relative Strength Index
- CCI: Commodity Channel Index
- Stochastic: Stochastic Index
- ADX: DMI+, DMI- & ADX
A brief overview of how degree of similarity is calculated:
- Each bar set is compared to the inout bar set within the selected feature space
- Features are represented as vectors, and distance between the vectors is calculated
- Shorter the distance, greater the similarity
- Different distance calculation methods are available to choose from, such as Cosine, Euclidean, Lorentzian, Manhattan, & Pearson
- Each method is likely to generate slightly different results, users are expected to select the method & the feature space that best fits their use-case
How To Use It
- Usage of this tool is relatively straightforward, users can add this indicator to their chart and similar clusters will be highlighted automatically
- Users need to select a time range that will be treated as input, and bars within that range become the input formation for similarity calculations
- Boxes will be draw around the clusters that fit the matching criteria
- Boxes are color-coded, green color boxes represent the top one-third of the top-n matches, yellow boxes represent the middle third, red boxes are for bottom third, and white box represents user-input
- Boxes colors will be adjusted as you adjust input parameters, such as number of matches or look-back period
User Settings
Users can configure the following options:
- Select the time-range to set input bars
- Select the look-back period, number of candles to backtrack for similarity search
- Select the number of top-n matches to show on the chart
- Select the method for similarity calculation
- Adjust the feature space, this enables addition of custom features, such as pattern recognition, technical indicators, rate of change etc
- Toggle verbosity, shows degree of similarity as a percentage value inside the box
Top Features
- Pattern Agnostic: Designed to work with variable number of candles & complex patterns
- Customisable Feature Space: Users get to add custom features to each bar
- Comprehensive Comparison: Generates a degree of similarity for all possible combinations
Final Note
- Similarity matches will be shown only within last 4500 bars.
- In theory, it is possible to compute similarity for any size candle formations, indicator has been tested with formations of 50+ candles, but it is recommended to select smaller range for faster & cleaner results.
- As you move to smaller time frames, selected time range will provide a larger number of candles as input, which can produce undesired results, it is advised to adjust your selection when you change time frames. Seeking suggestions on how to directly receive bars as user input, instead of time range.
- At times, users may see array index out of bound error when setting up this indicator, this generally happens when the input range is not properly configured. So, it should disappear after you select the input range, still trying to figure out where it is coming from, suggestions are welcome.
Credits
- @HeWhoMustNotBeNamed for publishing such a handy PineScript Logger, it certainly made the job a lot easier.

Futures Full FS ScreenerFull FS Screener
This indicator allows traders to have a view of multiple pairs and timeframes buy/sell signals and specific information of parameters, based on the Futures FS Indicator also developed by me.
Futures FS Indicator Fundamentals
1. Exponential Moving Average (EMAs): The base indicator is composed of moving averages of 5, 10, 11, 13, 36 and 55 exponential periods.
2. Squeeze Momentum: This indicator allows the signals to go with the trend and not against it.
3. VPVR (Volume Profile Visible Range): It allows to determine the Point of Control (POC) which is the node with the highest volume profile. This can be used as an important retest point or to calculate potential support and resistance.
4. ADX (Average Directional Index): The ADX helps the indicator to estimate the strength of the movement, always considering the DI+ and DI- to not go against the trend.
5. RSI (Relative Strength Index): The RSI helps measuring the speed and magnitude of the recent price changes to evaluate overvalued or undervalued conditions in the price of that security. The indicator considers RSI 5, 13 and 50 as bottom and top, respectively.
6. MACD (Moving average convergence divergence): The MACD is a trend-following momentum indicator that shows the relationship between moving averages. The indicator uses moving averages of 5, 8 and 21).
7. The trend is determined according to these parameters and their different values, which might indicate that we are in a bullish or bearish trend. The trend has a max positive (bullish) value of 6 and a max negative (bearish) value of -6.
Full Screener Panel
This panel allows the trader to monitor multiple pairs at a single screen, giving an immediate vision of possible entries and exits (Long/Short/Strong Long/Strong Short Signals). Moreover, allows traders to have handy all information of the Future FS Indicator that might be analyzed further for each pair. It has the following characteristics:
• It can be placed anywhere on the screen through the main menu of the indicator.
• It can be combined with the same indicator multiple times, as per screener is limited to show 40 pairs, you can select the number of panels being added to adjust position one next to each other.
• It strengthens colors when a pair has changed its signals in order to the trader to know immediate changes and then do the follow up
• The screener shows the pairs, which can be changed within the menus.
• The screener shows the Long, Short, Strong Long and Strong Short Signals in its las column but previously, it shows the parameters that determined the possible position. Therefore, the EMAs, SQZ, ADX, VPVR, RSI and MACD calculated internally, are also summarized in the screener.
For analyzing a specific pair, refer to the TwV Futures Indicator – FS, which is other indicator that might be on my TradingView Profile and that was used as base for the screener.

Futures Simple FS ScreenerSimple FS Screener
This indicator allows traders to have a simple view of multiple pairs and timeframe buy/sell signals, based on the Futures FS Indicator also developed by me.
Futures FS Indicator Fundamentals
1. Exponential Moving Average (EMAs): The base indicator is composed of moving averages of 5, 10, 11, 13, 36 and 55 exponential periods.
2. Squeeze Momentum: This indicator allows the signals to go with the trend and not against it.
3. VPVR (Volume Profile Visible Range): It allows to determine the Point of Control (POC) which is the node with the highest volume profile. This can be used as an important retest point or to calculate potential support and resistance.
4. ADX (Average Directional Index): The ADX helps the indicator to estimate the strength of the movement, always considering the DI+ and DI- to not go against the trend.
5. RSI (Relative Strength Index): The RSI helps measuring the speed and magnitude of the recent price changes to evaluate overvalued or undervalued conditions in the price of that security. The indicator considers RSI 5, 13 and 50 as bottom and top, respectively.
6. MACD (Moving average convergence divergence): The MACD is a trend-following momentum indicator that shows the relationship between moving averages. The indicator uses moving averages of 5, 8 and 21).
Simple Screener Panel
This panel allows the trader to monitor multiple pairs at a single screen, giving an immediate vision of possible entries and exits (Long/Short/Strong Long/Strong Short Signals). It has the following characteristics:
It can be placed anywhere on the screen through the main menu of the indicator.
It can be combined with the same indicator multiple times, as per screener is limited to show 40 pairs, you can select the number of panels being added to adjust position one next to each other.
It strengthens colors when a pair has changed its signals in order to the trader to know immediate changes and then do the follow up
The screener shows the pairs (which can be changed within the menus) and as part of being the simple screener it shows the Long, Short, Strong Long and Strong Short Signals. Therefore, the EMAs, SQZ, ADX, VPVR, RSI and MACD are calculated internally and its data will not be shown.
For viewing all parameters, refer to the Futures FS Full Screener or the TwV Futures Indicator – FS, which are other indicators that might be on my TradingView Profile

Miyagi (10 in 1) + AlertsMiyagi: The attempt at mastering something for the best results.
Miyagi indicators combine multiple trigger conditions and place them in one toolbox for traders to easily use, produce alerts, backtest, reduce risk and increase profitability.
VWAP has been the main condition for entry for our trading community for quite some time now, however using VWAP alone can lead to poor entries and bags.
Miyagi adds filtering conditions which can then be used to improve entries as opposed to simply using VWAP alone.
Miyagi (10-in-1) + Alerts combines multiple trigger conditions in an easy to use format.
Each trigger or filtering condition is selectable and able to be combined using the selector checkboxes.
Trigger or filter conditions can be used on a different timeframe chart than the current user selected chart.
For instance, the user's chart can be set to a 15M for entry however using filtering from a 30 minute RSI.
It is recommended to not use a lower timeframe chart setting than the current chart timeframe.
The following trigger and filter conditions are present in the 10-in-1:
EMA: Takes two "Exponential Moving Averages" into effect for filtering with user selectable chart timeframe, length and sources.
EMA Trend Type is user selectable for Trend-following or Counter-trend which allows you to counter-trade the markets.
Beside the "Simple Moving Average" the EMA has a multiplier.
Calculation is SMAxMultipier / SMAxMultiplier of the previous candle.
MACD: Takes the "Moving Average Convergence Divergence" into effect for trigger condition or filtering with user selectable chart timeframe,
source, fast & slow length and signal smoothing. MACD is a trend-following momentum indicator that shows the relationship between two moving averages of a price.
The MACD is calculated by subtracting the EMA 26 period from the EMA 12. Long alert is triggered on crossing the MACD zero line upwards and short alert vise versa.
RSI: Takes the "Relative Stregth Index" into effect for trigger condition or filtering with user selectable chart timeframe, length, source, and oversold and overbought values.
The RSI is a technical oscillator that uses price and volume data for identifying overbought or oversold signals in an asset.
It can also be used to spot divergences which warn of a trend change in price. This oscillator moves between 0 and 100.
RSI > 80 is considered overbought and an RSI < 20 is considered oversold.
Stochastic RSI: oscillator version of RSI.
Takes the stochRSI into effect for trigger condition or filtering with user selectable chart timeframe, K D, length, upper and lower length.
stochRSI = (actual RSI - lowest RSI) / (highest RSI - lowest RSI)
VWAP: Takes the "Volume Weighted Average Price" into effect for trigger condition with user selectable chart timeframe, period, and VWAP lower line (long),
or VWAP Upper line (Short) values. VWAP is calculated by totaling the money traded for every transaction (price x volume) and then dividing by the total shares traded.
The VWAP appears as a single line on charts. It looks similar to a moving average line, but smoother. In general it is a intraday/week anchored indicator that resets,
but we are using a steady version over a selectable period of candles.
TTM: Takes the TTM squeeze indicator into effect for trigger condition with user selectable chart timeframe, length, multiplier, smoothing and trend direction.
The TTM is used to identify when to enter or exit a market for the best chance of profitability. It squeezes pairs well with other indicators, such as the ADX indicator.
For Multiplicator you can use Keltner and Boilinger Bands.
ADX: Takes the "Average Directional Movement Index" into effect for trigger condition with user selectable chart timeframe, smoothing, DI-length, a long and a short setting.
The ADX is used to detect trend direction with a positive and a negative direction indicator (+DI & -DI). The factor of those is a value between 0 and 100.
A low value can be a week trend or consolidation. A value > 25 is considered as a positive trend, >50 is a strong long trend >75 extremely strong trend.
Beside timeframe, you can choose smoothing and DI length.
SuperTrend: Takes the SuperTrend into effect for filtering with user selectable chart timeframe, ATR length and factor.
As an alternative to moving averages you can keep a fix distance to determine long or short trend.
That way you can avoid a lot of switching during a consolidation phase. Once crossed it switches trend direction.
The "Average True Rage" is used for calculation of the SuperTrend distance, it measures the volatility of the coin.
MFI: Takes the "Money Flow Index" into effect for filtering with user selectable chart timeframe, length, source, long and short settings.
The MFI is a technical oscillator that uses price and volume data for identifying overbought or oversold signals in an asset.
It can also be used to spot divergences which warn of a trend change in price. Like RSI this oscillator moves between 0 and 100.
MFI > 80 is considered overbought and an MFI < 20 is considered oversold.
W-Divergence: Takes the "Wolfpack Divergence" into effect for trigger condition with user selectable chart timeframe, length, lookback, divergence and ranges.
W-Divergence is MACD 3-8 setting with added divergence hunter.
How to use: Select the VWAP, and set the VWAP up as you would normally trade with your selected timeframe, period, and VWAP settings (long and short).
All entries will be shown, based on the VWAP settings.
From here, filtering can be implemented to produce better entries, ie using EMA/MACD/RSI/SuperTrend/MFI filtering.
Happy Trading!

Self-Optimizing RSI Strategy [Kioseff Trading]Hello!
Introducing the Self-Optimizing RSI Strategy.
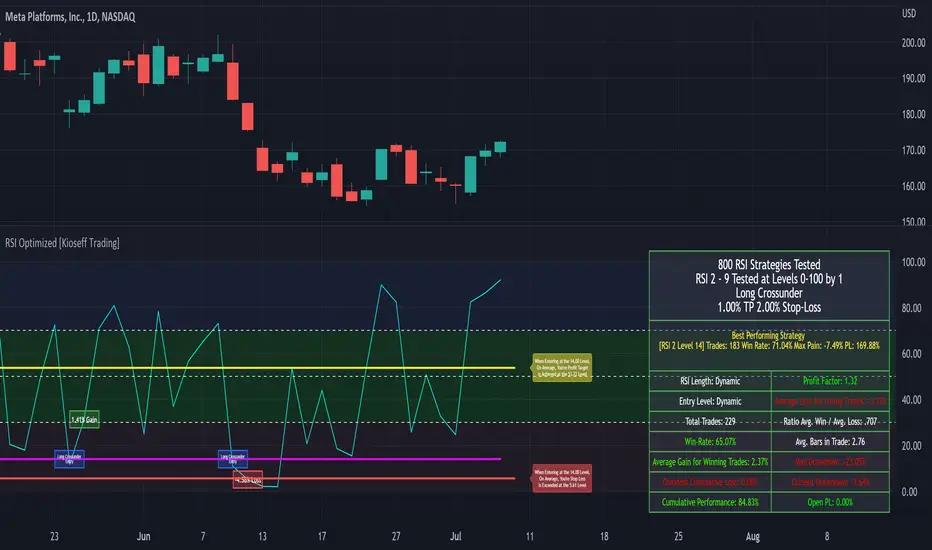
The indicator tests up to 800 RSI strategies simultaneously, looping through arrays, and auto plots the best performing parameter set.
The image above shows the result of 800 RSI strategies concurrently.
The table oriented bottom right shows the performance and risk metrics of the best performing RSI system tested across the bar set. Additionally, the conditions for entry and exit are displayed; for the image - a long entry system predicated on RSI crossunders and exit system predicated on a 1% TP and 2% SL are shown.
The indicator calculates numerous risk and performance metrics.
Calculated metrics include:
RSI Parameters
RSI Cross Entry Level
Total Trades
Win Rate
Avg. Gain for Winning Trades
Max Pain
PnL (Cumulative Performance)
Profit Factor
Avg. Loss for Losing Trades
Ratio Avg. Win / Avg. Loss
Avg. Bars in Trade
Max Drawdown
Current Drawdown
Open Position PnL
"Dynamic" indicates the performance of self-optimizing RSI system was tested.
The image above shows the performance of the greatest-performing RSI system - a fixed set of parameters - when adhering to a 1% TP and 2% fixed SL.
Trailing Stops and Profit-Taking Limit orders can be set/simulated.
The image above shows a dynamic entry level - plotted as a purple, non-transparent line.
The entry level "self-optimizes" to mimic the best performing RSI system at current time.
The image above exemplifies the functionality for all horizontal lines plotted on the chart.
The average RSI level achieved subsequent a profitable trade is shown.
The average RSI level achieved subsequent a losing trade is shown.
The entry level for RSI crossunders/crossovers is shown.
The image above show the Self-Optimizing RSI indicator recording entries & exits; gains & losses, for each executed trade.
You can "verify" trades manually.
Blue boxes reflect an entered position.
Green boxes reflect a closed, profitable trade.
Red boxes reflect a close, losing trade.
The percentage gain for a profitable trade is appended to green boxes; the percentage loss for a losing trade is appended to red boxes.
The Self-Optimizing RSI indicator plots off the chart; however, percentage gains/losses are measured against price, not RSI.
Boxes correlate to the interval a trade was entered/exited on.
The indicator hosts various methods to filter the outcome for testing.
For instance, you can:
Use trailing stops or fixed stop losses
Test RSI crossunders and crossovers
Configure the RSI settings that are tested (i.e. RSI 2 - 9, RSI 14 - 20, RSI 50 - 57)
Test short-based RSI Systems and long-based RSI systems
Simulate limit orders (Exit intrabar at fixed stop losses or trailing stop losses; exit intrabar at profit targets)
Require all tested RSIs to trend above or below their respective average (i.e. all RSIs must trend above/below their 50-interval EMA values. SMAs can also be used)
Use external indicators and require a user-defined value be exceeded, measured below, or that price exceed or measure below an indicator. The Self-Optimizing RSI indicator incorporates a few built-in technical indicators - ADX, %k, MFI, CMFI, and RSI. Consequently, you can require these indicators to measure above/below a specified level prior to entry. Additionally, you can supplement an extrinsic indicator (anything custom coded with plot values) to the entry logic for the Self-Optimizing RSI indicator. I'll show an example shortly.
Adjust the time window that's tested.
Adjust PT and SL percentages.
Override plot an RSI system to procure thorough statistics.
Require a symbol to measure above/Below or equal to a particular price level to “validate” a Long/Short entry signal. You can retrieve any data hosted by TradingView and require it measure above/below a user-defined level prior to entry. For instance, you can select "$VIX", and require the ticker to measure less than $30 prior to long/short entry. If "$VIX" measures greater than $30 prior to a long/short signal the position will not open. Alternatively, you can require a symbol to measure above a user-defined price prior to entry. If the retrieved ticker doesn't measure above the user-defined level prior to entry a trade will not open.
Use trailing stops or fixed stop losses
The image above shows results for 800 short-based RSI systems - using a trailing stop loss.
Test RSI crossunders and crossovers
The image shows results for 800 long-based RSI systems. Positions are entered subsequent to RSI crossovers.
You can select which RSI strategies are tested - you aren't not limited to testing RSI 2 - RSI 9 (:
Simulate limit orders (Exit intrabar at fixed stop losses or trailing stop losses; exit intrabar at profit targets)
The image above shows performance test results when exiting during the interval subsequent to the profit target being exceeded.
The image above shows performance test results when exiting during the interval subsequent to the stop loss being exceeded.
Require all tested RSIs to trend above or below their respective average (i.e. all RSIs must trend above/below their 50-interval EMA values. SMAs can also be used)
The image above shows an RSI EMA in addition to prerequisite condition. For each RSI strategy tested, the RSI used for the strategy must measure above an EMA of its values prior to entry. You can require RSI to measure below an EMA of its values prior to entry, use an SMA, and change the length of the MA used.
Use external indicators and require a user-defined value be exceeded, measured below, or that price exceed or measure below an indicator. The Self-Optimizing RSI indicator incorporates a few built-in technical indicators - ADX, %k, MFI, CMFI, and RSI. Consequently, you can require these indicators to measure above/below a specified level prior to entry. Additionally, you can supplement an extrinsic indicator (anything custom coded with plot values) to the entry logic for the Self-Optimizing RSI indicator. I'll show an example shortly.
The image above shows me requiring the ADX indicator to measure above "20" prior to long entry. Any of the built-indicators can be used with similar conditions; you can implement a custom-coded indicator for trade logic.
Additionally, you can supplement an extrinsic indicator (anything custom coded with plot values) to the entry logic for the Self-Optimizing RSI indicator.
The image above shows me retrieving the value for Volume Profile Point of Control - a TradingView coded indicator.
Consequently, I can require price to measure above/below the session's Poc prior to RSI long/short entry.
You can use this feature with any custom coded indicator providing historical plot values - something you or a favored author have coded.
]Adjust PT and SL percentages
The image above shows adjusted TP & SL percentages - optimize and reward/risk ratio you'd like (:
Override plot an RSI system to procure thorough statistics.
The image above shows manually plotted RSI parameters and a corresponding stat sheet.
Require a symbol to measure above/Below or equal to a particular price level to “validate” a Long/Short entry signal. You can retrieve any data hosted by TradingView and require it measure above/below a user-defined level prior to entry. For instance, you can select "$VIX", and require the ticker to measure less than $30 prior to long/short entry. If "$VIX" measures greater than $30 prior to a long/short signal the position will not open. Alternatively, you can require a symbol to measure above a user-defined price prior to entry. If the retrieved ticker doesn't measure above the user-defined level prior to entry a trade will not open.
The image above shows me requiring the ticker "$VIX" to measure below $30 prior to long/short entry. If %VIS measures greater than $30 when a long/short signal triggers a position will not be opened. Further refine your trading system with this feature - exploit correlations.
Adjust the time window that's tested.
The image above shows configurable start and end dates for the optimization period.
You won't be able to test 800 RSI strategies concomitantly on a 20,000 bar data set.
Consequently, for large data sets (intrasession data) you will have to narrow the optimization window to test a larger number of combinations.
You can test 80 (loads on all data sets), 144 (loads on all data sets), 264 (loads on ~15,000 bar data sets), 312 (loads on ~11,500 bar data sets) and 800 (loads on ~4950 bar data sets)combinations simultaneously. You can test 800 RSI strategies simultaneously on intrasession data; however, you'll likely have to narrow the tested time window.
I recently published a bar count script titled "Bar Count for Backtesting", you can access the script here:
The above script is useful for quickly calculating the number of bars in a time window, or the date for a bar that is "x" number of bars back. Therefore, implementing these scripts cooperatively should improve date selection efficiency (not arbitrarily selecting test start & end dates that fail to load).
I included a tool tip describing the near-maximum bars in a data set that the higher numbers of simultaneous RSI strategies can be tested on.
More to come; enjoy!
(P.S. The script uses private libraries and, consequently, is unable to be published open source)
An optimization script is best implemented to discover what won't work, not what will work. The best performing "optimized" parameters are not a guaranteed profitable investment system. While we may see an exceptionally positive performance for a set of parameters, it's impossible to know how much of that performance is the beneficiary of market noise in the absence of additional testing. Most market moves are noise - irreplicable sequences that offer no predictive utility - and most "good" backtests overwhelmingly benefit from these irreplicable sequences. An investor unfamiliar with this concept may be lead to believe they have found a valid correlation between an indicator sequence and subsequent price movement, despite the correlation being illusory.
Consequently, it should be assumed that the best performing parameters strongly benefitted from market noise and will not work in a live market - until further rigorous statistical tests are performed on an investment system built around the best performing parameters. This includes out-of-sample, in-sample, and forward testing in addition to testing negatively correlated, positively correlated and zero-correlation assets; testing additional assets should be treated as prerequisite to live implementation.
Of course, all trading strategies, even one's that methodically exploit a valid correlation/replicable sequence, will benefit from market noise - it's impossible to avoid. However, a "legit" trading strategy has a chance to work on future price data, while an overoptimized strategy will fail miserably on new price data!
An overoptimized strategy is virtually guaranteed to have a better backtest performance than a valid strategy. The overoptimized strategy will fail in a live market while the valid strategy has a chance of working. So, should you notice the best performing RSI parameters, be sure to build a comprehensive trading system around the parameters and perform additional tests. This is the only way to know if the optimized parameters will truly work in a live market!
Unfortunately, they often will not!
This publication does not constitute investment advice.
Market Rhythm Trading Algo with Super SignalsThe Market Rhythm trading algo is designed using many different confluence data points that gives you a virtually unlimited combination of settings to manage risk on any given underlying asset. Designed with flexibility in mind, Market Rhythm can be used on futures, stocks, options, and even crypto.
The current settings are what give you the most buy and sell signals. Be sure to change the 'Rate of Change' source to something like hl2 instead of close where it's set to get even more signals.
How to Use:
Regular vs Super - Market Rhythm includes a set of regular signals, which are given on many price bars. Super signals are a combination of regular signals based on a length of bars you set. This is an effective way to clean up the chart and give more reliable buy and sell signals.
The idea behind so many points of confluence is to give you many different ways to filter out the signals you don't want to trade, or just don't like trading. With built in filters using rate of change, rsi, and chop index, you can customize the feel of your signals based on your risk. You can even use the Settings1 and Settings2 and ADX to separate your risk management into 2 different market conditions. For lower ADX settings you can manage risk much tighter for choppier, less trending markets. For higher ADX settings you will be able to set your risk management based on stronger trends.
The Adaptive Average included also changes based on Settings1/2 to give you a better idea of changing market conditions.
The Moving Average Ribbon can be used to temper your decisions for entering or exiting a trade. For instance, if you receive a red (sell signal) during a strong up trend, and the Adaptive Average is green, and the MA Ribbon is all green, then you have a pretty good idea of whether or not its safe to stay in the trade or go ahead and take profit.
Depending on your favorite time frame, Market Rhythm can be used for intraday scalping, as well as, daily swing trading. Not sure if your favorite discord pump stock is ready to go up? Check it against Market Rhythm and you'll have a much better idea of whether it's still going up or if you've missed the move. Trade safer and happier with Market Rhythm.
The small green triangles are 'regular buy signals' and the larger green triangles are 'super buy signals'.
The small red triangles are 'regular sell signals' and the larger red triangles are 'super sell signals'.
Use this indicator against your levels or main strategy for maximum effectiveness.
Limitations:
This script does not mark reversals. It will only identify safe trade zones during periods of strong momentum.
Disclaimer:
The information contained in my scripts/indicators/ideas does not constitute financial advice or a solicitation to buy or sell any securities of any type. I will not accept liability for any loss or damage, including without limitation any loss of profit, which may arise directly or indirectly from the use of or reliance on such information.
All investments involve risk, and the past performance of a security, industry, sector, market, financial product, trading strategy, or individual’s trading does not guarantee future results or returns. Investors are fully responsible for any investment decisions they make. Such decisions should be based solely on an evaluation of their financial circumstances, investment objectives, risk tolerance, and liquidity needs.
My scripts/indicators/strategies/ideas are only for educational purposes!

Trend Strength Oscillator [Lysergik]The Trend Strength Oscillator is a clever combination of some of the most common and useful indicators. Combining the:
- Directional Movement Index (DMI)
- Average Directional Index (ADX)
- Volume (optional)
In doing so, we get a much easier to appreciate indication of both trend direction and strength at a glance that is reliable on every timeframe!
The ADX is not only part of the resulting value but also affects how bright the colors appear on the indicator. Brighter being a stronger trend direction than lighter color.
Moreover, we can quickly see if a trend is strengthening or weakening by seeing if the indication is colored aqua/yellow or white, respectively.
In the above chart you can see the volume indicator, DMI, ADX, with the TSO (Trend Strength Oscillator) on the bottom for context and to show just how much more intuitive the TSO is.

Blobbinger BandsBBANDS with:
- DI+/DI- coloring outer bands. If top BBand is green DI+ is on top; if top BBand is red DI- is on top.
- ADX Coloring - coloring of BBand background is relative to ADX performance. Blue = High, Red = Low, Black = Very Low, White = Extremely Low
- Basis Line Coloring - colored using Bollinger Band Width Percentile. Blue = Squeezing BBands, Red = Blasted Open BBands
- Histogram Lines - Denotes ADX Extremely Low

[blackcat] L3 DMIQLevel: 3
Background
The directional movement index (DMI) is an indicator developed by J. Welles Wilder in 1978 that identifies in which direction the price of an asset is moving. The indicator does this by comparing prior highs and lows and drawing two lines: a positive directional movement line (+DI) and a negative directional movement line (-DI). An optional third line, called the average directional index (ADX), can also be used to gauge the strength of the uptrend or downtrend.
Function
When +DI is above -DI, there is more upward pressure than downward pressure in the price. Conversely, if -DI is above +DI, then there is more downward pressure on the price. This indicator may help traders assess the trend direction. Crossovers between the lines are also sometimes used as trade signals to buy or sell.
The directional movement index (DMI) is a technical indicator that measures both the strength and direction of a price movement and is intended to reduce false signals.
The DMI utilizes two standard indicators, one negative (-DM) and one positive (+DN), in conjunction with a third, the average directional index (ADX), which is non-directional but shows momentum.
The larger the spread between the two primary lines, the stronger the price trend. If +DI is way above -DI the price trend is strongly up. If -DI is way above +DI then the price trend is strongly down.
ADX measures the strength of the trend, either up or down; a reading above 25 indicates a strong trend.
Remarks
Free and Open Source
Alerts are added.

Leonidas Squeeze Momentum SystemThis indicator is based on LazyBear SQ Momentum Indicator and SQ Plus Indicator.
This indicator is using ADX and Squeeze Momentum Indicator.
When you see the ADX above 0 line and the slop is positive that means the trend is strong
When the ADX is below 0 line and the trend is weak you will see the slop negative and the color gray
When we see the SQ changing the color from Red to Yellow that means the sell pressure is decreasing this could be a potential buy signal
When we see the color changing from blue to dark blue that means the buy pressure is decreasing this could be a a potential sell signal
Bull/Bear divergences supported
Added SQ signal
this signal is an exponential moving average following the SQ main signal useful for filtering fake signals.
This indicator is very powerful but offers many fake signals it is recommended using this indicator with other indicators to confirm the entries

The Witcher [30MIN] - AlertsHello,
This is the Witcher Bot
This bot is got best performance at BTCUSDTPERP BINANCE FUTURES
this is bot for leverage 1x,
I tried focusing at highest % profitable trades, bot could be optimalised to even higher profit net.
TP: 1.1
SL: 8.2
Stop-loss unfortunelly have to be high to avoid bear/bull traps
The core of this strategy is trend strenght ( MONEY FLOW INDKES)
Strategy can only open position on strong price movment, to avoid wrong decision
Settings are set for highest profitable trades %
Bot using 10 indicators to trigger basic condtition for long and short :
1) ADX - Is one of the most powerful and accurate trend indicators. ADX measures how strong a trend is, and can give valuable information on whether there is a potential trading opportunity.
2) RSI - value helps strategy to stop trade in right time. When RSI is overbought strategy don't open new longs , also when RSI is oversold strategy don't open new shorts
3) TREND STRENGHT
4) JURIK MOVING AVERAGE - The Jurik Moving Average indicator is one of the surest ways to smoothen price curves within a minimum time lag. The indicator offers currency traders one of the best price filters during strong price moves. In this time, when bitcoin price action is so strong, this indicator is necessary.
5) SAR - The parabolic SAR is a technical indicator used to determine the price direction of an asset, as well as draw attention to when the price direction is changing. SAR supporting bot, to not open new trades when the trends are slowly changing
6) TREND INDICATOR
7) MOMENTUM - Indicator istechnical analysis tool used to determine the strength or weakness of a stock's price. Momentum measures the rate of the rise or fall of stock prices. Common momentum indicators include the relative strength index ( RSI ) and moving average convergence divergence ( MACD ).
8) OBV - On-balance volume (OBV) is a technical trading momentum indicator that uses volume flow to predict changes in stock price.
9) FAST MA - like previous ones this is for better view of trends, and correctly define the trends, also Speed_MA are using for predict the future price action.
10) RANGE FILTER - this indicator is for the better view of trends, define trends, that is important for every bull/bear traps which helps a lot becouse of the very variable trends.
I decided to add momentum indicator to strategy, to make a fast-reacting decision on lower timeframes at extremly price volatility
Also bot got additional EMA scalping option, which increase profit net but, in some situation, that could be risky.
For max security I recommend to turn off this option.
Commision are set at standard binancefutures VIP-0 = 0.04%
After converting strategy into study version, bot is ready for automation.
All the ploting color depends of adx value.
Strategy are not Repainting
For the source code I tried to keep as clean as I could
Enjoy

Trading Made Easy ATR BandsAs always, this is not financial advice and use at your own risk. Trading is risky and can cost you significant sums of money if you are not careful. Make sure you always have a proper entry and exit plan that includes defining your risk before you enter a trade.
Background:
This is my take on two relatively famous indicators that paint the colour of your candles in order to help identify trend direction and smooth out market noise. The Elder Impulse System was designed by Dr . Alexander Elder in his book Come Into My Trading Room and attempts to identify the change of trends and when these trends speed up and slow down (school.stockcharts.com). The system used a 13 period EMA and a MACD histogram, and compared each of these indicators to the previous period. In short, when both the histogram and the EMA were rising, the trend was accelerating to the upside and when both were falling, accelerating to the downside. Conversely, when the indicators were not in alignment, say the MACD falling but the EMA rising, it signaled a slowing down of momentum. The downside of this indicator is that it be can rather jumpy, focusing on a short period EMA for 50% of its calculation, leaving a trader to potentially sit on the sidelines during opportune pull backs to enter winning positions, or exit early when there is still a lot of gas left in the tank.
A similar concept has been employed by John Carter and his organization, SimplerTrading, with the 10X bars indicator. However, here they use the famous Directional Movement Index (DMI) created by J. Welles Wilder as the basis for their bars (www.simplertrading.com). John Carter states that the use of this indicator can lead to getting in earlier on more, bigger, and faster setups. The downside of this indicator is the reliance on the ADX calculations to keep you out of rangebound trades. Anyone who is familiar with the DMI system understands it has unparalleled ability to identify longer term trends, but it is also quite slow, leaving the trader to miss a good portion of the initial runup due to this ADX portion that is very slow to get moving and also slow to signal exits.
In short, both of these systems are designed with one thing in mind: keeping the trader on the right side of the move --- but both suffer from the same issue but on opposite sides of the spectrum. One is too fast and the other is too slow. Ultimately, leaving profits on the table for the trader when such a situation could be avoided.
Here I present my own take on these and have made the “Trading Made Easy ATR Bands”. I name it this because trading is much easier when you trade with the prevailing trend, and this system identifies these periods quite effectively while doing a better job of handling the speed flux of most markets. The base formula uses the DMI as its main calculation and the relationship between the DMI+ and DMI- lines, respectively, like the 10X bars. While the trader can investigate these on their own to understand these more intimately, essentially the DMI+ and DMI- lines are calculating the highs and lows respectively of each bar compared to a period in the past and smoothed with the true range, a measurement of volatility . What this ultimately presents is a picture of uptrends and downtrends, where price is making consistently more highs or more lows over a period of time. Where I have modified this relative to the 10X bars is I have ignored the ADX calculations. Further, values over 25 have been discussed as “strong” momentum, in my calculations, I have sped this up to 20 to get a trader into the move earlier. Second, I have added an additional calculation based around the 21-period exponential moving average calculated against its previous output. This then, like the Elder Impulse System, has two forms of market momentum as its calculation to smooth out noise, but has the benefit of being less jumpy, like the original 10X bar system. I have added a series of exponential moving averages following the Fibonacci sequence from 8-144 as a system of dynamic support and resistance showing the sentiment of both the shorter and longer term market participants. Last, I have added a series of Keltner Channels , from 1X-4X, that encompass the 21 period EMA as a base line. The 21 EMA is a stable in all of John Carter’s work and I do believe he is correct that the market is mostly structured around this line, since it roughly approximates one month of trading data. It is not uncommon to see price expand and contract back to this line over and over again.
Trade Signals:
Strong Bullish Momentum – The system will generate a green bar when the DMI+ line is over the DMI- line, the DMI+ line is equal or greater than 20 and the 21 EMA has increased relative to its last close.
Weak Bullish Momentum – The system will generate a blue bar in several scenarios. First, when the DMI+ line is over the DMI- line but the DMI+ line is not over 20 and the EMA is equal or less than the previous close. It will also print a blue bar if either the DMI or the EMA are not aligned, such as the DMI+ is over the DMI- but not over 20 but the EMA has risen compared to the last bar. Last, it will also print a blue bar if the DMI- is over the DMI+ but the EMA is rising.
Strong Bearish Momentum – The system will generate a red bar when the DMI- line is over the DMI+ line, the DMI- line is equal or greater than 20, and the 21 EMA has fallen relative to its last close.
Weak Bearish Momentum – The system will generate an orange bar in several scenarios. First when the DMI- line is over the DMI+ line but the DMI- line is not over 20 and the EMA is equal or greater than the last bar. It will also print an orange bar if either the DMI or the EMA are not aligned, such as the DMI- is over the DMI+ but not over 20 but the EMA has fallen. Lastly, it will also print an orange bar if the DMI+ line is over the DMI- and the EMA has fallen relative to the last bar.
Uses:
1) Like the Elder Impulse System and 10X Bar systems, these should be used as trade filters only.. It is in the trader’s best interest to trade with the trends and these bars identify these periods but may not always generate the most opportune time to enter a market. For instance, trying to short a market when the market is in a phase of Strong Bullish Momentum would not be wise, and vice versa with trying to open long positions when the market is exhibiting Strong Bearish Momentum. Use multiple forms of evidence to confirm the signals shown before entering any trade and to not take these signals on their without confluence of ideas. A viable system could use the Elder Triple Screen System (for reference, see this decent write up --- www.dailyforex.com) with the Trading Made Easy Bands as your “Tide” or longer term filter, and a further trading plan to establish an entry on a short time frame pull back.
2) Interim Trend Exhaustion – Keltner channels work as moving standard deviations from the 21 EMA . 3X multipliers will encompass 99.7% of price and 4X will encompass 99.9% of price away from the 21 EMA . During a trend it would be a good idea to lock in partial profits when price reaches these outer extrema as it is very highly probable that a retracement back to the mean is approaching. While not part of the system, and not recommended to be used by this system, a mean reversion trader could in theory look for reversals at these extrema points and trade a mean reversion strategy back to the 21EMA, but is a much riskier trade with lower probability of success. A trend trader should look to enter trades when a signal is given within the 1ATR or 2ATR zone as this is when price has not really started accelerating yet and is likely to see continued momentum in that direction.

Indicators Combination Framework v3 IND [DTU]Hello All,
This script is a framework to analyze and see the results by combine selected indicators for (long, short, longexit, shortexit) conditions.
I was designed this for beginners and users to facilitate to see effects of the technical indicators combinations on the chart WITH NO CODE
You can improve your strategies according the results of this system by connecting the framework to a strategy framework/template such as Pinecoder, Benson, daveatt or custom.
This is enhanced version of my previous indicator "Indicators & Conditions Test Framework "
Currently there are 93 indicators (23 newly added) connected over library. You can also import an External Indicator or add Custom indicator (In the source)
It is possible to change it from Indicator to strategy (simple one) by just remarking strategy parts in the source code and see real time profit of your combinations
Feel free to change or use it in your source
Special thanks goes to Pine wizards: Trading view (built-in Indicators), @Rodrigo, @midtownsk8rguy, @Lazybear, @Daveatt and others for their open source codes and contributions
SIMPLE USAGE
1. SETTING: Show Alerts= True (To see your entries and Exists)
2. Define your Indicators (ex: INDICATOR1: ema(close,14), INDICATOR2: ema(close,21), INDICATOR3: ema(close,200)
3. Define Your Combinations for long & Short Conditions
a. For Long: (INDICATOR1 crossover INDICATOR2) AND (INDICATOR3 < close)
b. For Short: (INDICATOR1 crossunder INDICATOR2) AND (INDICATOR3 > close)
4. Select Strategy/template (Import strategy to chart) that you export your signals from the list
5. Analyze the best profit by changing Indicators values
SOME INDICATORS DETAILS
Each Indicator includes:
- Factorization : Converting the selected indicator to Double, triple Quadruple such as EMA to DEMA, TEMA QEMA
- Log : Simple or log10 can be used for calculation on function entries
- Plot Type : You can overlay the indicator on the chart (such ema) or you can use stochastic/Percentrank approach to display in the variable hlines range
- Extended Parametes : You can use default parameters or you can use extended (P1,P2) parameters regarding to indicator type and your choice
- Color : You can define indicator color and line properties
- Smooth : you can enable swma smooth
- indicators : you can select one of the 93 function like ema(),rsi().. to define your indicator
- Source : you can select from already defined indicators (IND1-4), External Indicator (EXT), Custom Indicator (CUST), and other sources (close, open...)
CONDITION DETAILS
- There are are 4 type of conditions, long entry, short entry, long exit, short exit.
- Each condition are built up from 4 combinations that joined with "AND" & "OR" operators
- You can see the results by enabling show alerts check box
- If you only wants to enter long entry and long exit, just fill these conditions
- If "close on opposite" checkbox selected on settings, long entry will be closed on short entry and vice versa
COMBINATIONS DETAILS
- There are 4 combinations that joined with "AND" & "OR" operators for each condition
- combinations are built up from compare 1st entry with 2nd one by using operator
- 1st and 2nd entries includes already defined indicators (IND1-5), External Indicator (EXT), Custom Indicator (CUST), and other sources (close, open...)
- Operators are comparison values such as >,<, crossover,...
- 2nd entry include "VALUE" parameter that will use to compare 1st indicator with value area
- If 2nd indicator selected different than "VALUE", value are will mean previous value of the selection. (ex: value area= 2, 2nd entry=close, means close )
- Selecting "NONE" for the 1st entry will disable calculation of current and following combinations
JOINS DETAILS
- Each combination will join wiht the following one with the JOIN (AND, OR) operator (if the following one is not equal "NONE")
CUSTOM INDICATOR
- Custom Indicator defines harcoded in the source code.
- You can call it with "CUST" in the Indicator definition source or combination entries source
- You can change or implement your custom indicator by updating the source code
EXTERNAL INDICATOR
- You can import an external indicator by selecting it from the ext source.
- External Indicator should be already imported to the chart and it have an plot function to output its signal
EXPORTING SIGNAL
- You can export your result to an already defined strategy template such as Pine coders, Benson, Daveatt Strategy templates
- Or you can define your custom export for other future strategy templates
ALERTS
- By enabling show alerts checkbox, you can see long entry exits on the bottom, and short entry exits aon the top of the chart
ADDITIONAL INFO
- You can see all off the inputs descriptions in the tooltips. (You can also see the previous version for details)
- Availability to set start, end dates
- Minimize repainting by using security function options (Secure, Semi Secure, Repaint)
- Availability of use timeframes
-
Version 3 INDICATORS LIST (More to be added):
▼▼▼ OVERLAY INDICATORS ▼▼▼
alma(src,len,offset=0.85,sigma=6).-------Arnaud Legoux Moving Average
ama(src,len,fast=14,slow=100).-----------Adjusted Moving Average
accdist().-------------------------------Accumulation/distribution index.
cma(src,len).----------------------------Corrective Moving average
dema(src,len).---------------------------Double EMA (Same as EMA with 2 factor)
ema(src,len).----------------------------Exponential Moving Average
gmma(src,len).---------------------------Geometric Mean Moving Average
highest(src,len).------------------------Highest value for a given number of bars back.
hl2ma(src,len).--------------------------higest lowest moving average
hma(src,len).----------------------------Hull Moving Average.
lagAdapt(src,len,perclen=5,fperc=50).----Ehlers Adaptive Laguerre filter
lagAdaptV(src,len,perclen=5,fperc=50).---Ehlers Adaptive Laguerre filter variation
laguerre(src,len).-----------------------Ehlers Laguerre filter
lesrcp(src,len).-------------------------lowest exponential esrcpanding moving line
lexp(src,len).---------------------------lowest exponential expanding moving line
linreg(src,len,loffset=1).---------------Linear regression
lowest(src,len).-------------------------Lovest value for a given number of bars back.
mcginley(src, len.-----------------------McGinley Dynamic adjusts for market speed shifts, which sets it apart from other moving averages, in addition to providing clear moving average lines
percntl(src,len).------------------------percentile nearest rank. Calculates percentile using method of Nearest Rank.
percntli(src,len).-----------------------percentile linear interpolation. Calculates percentile using method of linear interpolation between the two nearest ranks.
previous(src,len).-----------------------Previous n (len) value of the source
pivothigh(src,BarsLeft=len,BarsRight=2).-Previous pivot high. src=src, BarsLeft=len, BarsRight=p1=2
pivotlow(src,BarsLeft=len,BarsRight=2).--Previous pivot low. src=src, BarsLeft=len, BarsRight=p1=2
rema(src,len).---------------------------Range EMA (REMA)
rma(src,len).----------------------------Moving average used in RSI. It is the exponentially weighted moving average with alpha = 1 / length.
sar(start=len, inc=0.02, max=0.02).------Parabolic SAR (parabolic stop and reverse) is a method to find potential reversals in the market price direction of traded goods.start=len, inc=p1, max=p2. ex: sar(0.02, 0.02, 0.02)
sma(src,len).----------------------------Smoothed Moving Average
smma(src,len).---------------------------Smoothed Moving Average
super2(src,len).-------------------------Ehlers super smoother, 2 pole
super3(src,len).-------------------------Ehlers super smoother, 3 pole
supertrend(src,len,period=3).------------Supertrend indicator
swma(src,len).---------------------------Sine-Weighted Moving Average
tema(src,len).---------------------------Triple EMA (Same as EMA with 3 factor)
tma(src,len).----------------------------Triangular Moving Average
vida(src,len).---------------------------Variable Index Dynamic Average
vwma(src,len).---------------------------Volume Weigted Moving Average
volstop(src,len,atrfactor=2).------------Volatility Stop is a technical indicator that is used by traders to help place effective stop-losses. atrfactor=p1
wma(src,len).----------------------------Weigted Moving Average
vwap(src_).------------------------------Volume Weighted Average Price (VWAP) is used to measure the average price weighted by volume
▼▼▼ NON OVERLAY INDICATORS ▼▼
adx(dilen=len, adxlen=14, adxtype=0).----adx. The Average Directional Index (ADX) is a used to determine the strength of a trend. len=>dilen, p1=adxlen (default=14), p2=adxtype 0:ADX, 1:+DI, 2:-DI (def:0)
angle(src,len).--------------------------angle of the series (Use its Input as another indicator output)
aroon(len,dir=0).------------------------aroon indicator. Aroons major function is to identify new trends as they happen.p1 = dir: 0=mid (default), 1=upper, 2=lower
atr(src,len).----------------------------average true range. RMA of true range.
awesome(fast=len=5,slow=34,type=0).------Awesome Oscilator is an indicator used to measure market momentum. defaults : fast=len= 5, p1=slow=34, p2=type: 0=Awesome, 1=difference
bbr(src,len,mult=1).---------------------bollinger %%
bbw(src,len,mult=2).---------------------Bollinger Bands Width. The Bollinger Band Width is the difference between the upper and the lower Bollinger Bands divided by the middle band.
cci(src,len).----------------------------commodity channel index
cctbbo(src,len).-------------------------CCT Bollinger Band Oscilator
change(src,len).-------------------------A.K.A. Momentum. Difference between current value and previous, source - source . is most commonly referred to as a rate and measures the acceleration of the price and/or volume of a security
cmf(len=20).-----------------------------Chaikin Money Flow Indicator used to measure Money Flow Volume over a set period of time. Default use is len=20
cmo(src,len).----------------------------Chande Momentum Oscillator. Calculates the difference between the sum of recent gains and the sum of recent losses and then divides the result by the sum of all price movement over the same period.
cog(src,len).----------------------------The cog (center of gravity) is an indicator based on statistics and the Fibonacci golden ratio.
copcurve(src,len).-----------------------Coppock Curve. was originally developed by Edwin Sedge Coppock (Barrons Magazine, October 1962).
correl(src,len).-------------------------Correlation coefficient. Describes the degree to which two series tend to deviate from their ta.sma values.
count(src,len).--------------------------green avg - red avg
cti(src,len).----------------------------Ehler s Correlation Trend Indicator by
dev(src,len).----------------------------ta.dev() Measure of difference between the series and its ta.sma
dpo(len).--------------------------------Detrended Price OScilator is used to remove trend from price.
efi(len).--------------------------------Elders Force Index (EFI) measures the power behind a price movement using price and volume.
eom(len=14,div=10000).-------------------Ease of Movement.It is designed to measure the relationship between price and volume.p1 = div: 10000= (default)
falling(src,len).------------------------ta.falling() Test if the `source` series is now falling for `length` bars long. (Use its Input as another indicator output)
fisher(len).-----------------------------Fisher Transform is a technical indicator that converts price to Gaussian normal distribution and signals when prices move significantly by referencing recent price data
histvol(len).----------------------------Historical volatility is a statistical measure used to analyze the general dispersion of security or market index returns for a specified period of time.
kcr(src,len,mult=2).---------------------Keltner Channels Range
kcw(src,len,mult=2).---------------------ta.kcw(). Keltner Channels Width. The Keltner Channels Width is the difference between the upper and the lower Keltner Channels divided by the middle channel.
klinger(type=len).-----------------------Klinger oscillator aims to identify money flow’s long-term trend. type=len: 0:Oscilator 1:signal
macd(src,len).---------------------------MACD (Moving Average Convergence/Divergence)
mfi(src,len).----------------------------Money Flow Index s a tool used for measuring buying and selling pressure
msi(len=10).-----------------------------Mass Index (def=10) is used to examine the differences between high and low stock prices over a specific period of time
nvi().-----------------------------------Negative Volume Index
obv().-----------------------------------On Balance Volume
pvi().-----------------------------------Positive Volume Index
pvt().-----------------------------------Price Volume Trend
ranges(src,upper=len, lower=-5).---------ranges of the source. src=src, upper=len, v1:lower=upper . returns: -1 source=upper otherwise 0
rising(src,len).-------------------------ta.rising() Test if the `source` series is now rising for `length` bars long. (Use its Input as another indicator output)
roc(src,len).----------------------------Rate of Change
rsi(src,len).----------------------------Relative strength Index
rvi(src,len).----------------------------The Relative Volatility Index (RVI) is calculated much like the RSI, although it uses high and low price standard deviation instead of the RSI’s method of absolute change in price.
smi_osc(src,len,fast=5, slow=34).--------smi Oscillator
smi_sig(src,len,fast=5, slow=34).--------smi Signal
stc(src,len,fast=23,slow=50).------------Schaff Trend Cycle (STC) detects up and down trends long before the MACD. Code imported from
stdev(src,len).--------------------------Standart deviation
trix(src,len) .--------------------------the rate of change of a triple exponentially smoothed moving average.
tsi(src,len).----------------------------The True Strength Index indicator is a momentum oscillator designed to detect, confirm or visualize the strength of a trend.
ultimateOsc(len.-------------------------Ultimate Oscillator indicator (UO) indicator is a technical analysis tool used to measure momentum across three varying timeframes
variance(src,len).-----------------------ta.variance(). Variance is the expectation of the squared deviation of a series from its mean (ta.sma), and it informally measures how far a set of numbers are spread out from their mean.
willprc(src,len).------------------------Williams %R
wad().-----------------------------------Williams Accumulation/Distribution.
wvad().----------------------------------Williams Variable Accumulation/Distribution.
HISTORY
v3.01
ADD: 23 new indicators added to indicators list from the library. Current Total number of Indicators are 93. (to be continued to adding)
ADD: 2 more Parameters (P1,P2) for indicator calculation added. Par:(Use Defaults) uses only indicator(Source, Length) with library's default parameters. Par:(Use Extra Parameters P1,P2) use indicator(Source,Length,p1,p2) with additional parameters if indicator needs.
ADD: log calculation (simple, log10) option added on indicator function entries
ADD: New Output Signals added for compatibility on exporting condition signals to different Strategy templates.
ADD: Alerts Added according to conditions results
UPD: Indicator source inputs now display with indicators descriptions
UPD: Most off the source code rearranged and some functions moved to the new library. Now system work like a little bit frontend/backend
UPD: Performance improvement made on factorization and other source code
UPD: Input GUI rearranged
UPD: Tooltips corrected
REM: Extended indicators removed
UPD: IND1-IND4 added to indicator data source. Now it is possible to create new indicators with the previously defined indicators value. ex: IND1=ema(close,14) and IND2=rsi(IND1,20) means IND2=rsi(ema(close,14),20)
UPD: Custom Indicator (CUST) added to indicator data source and Combination Indicator source.
UPD: Volume added to indicator data source and Combination Indicator source.
REM: Custom indicators removed and only one custom indicator left
REM: Plot Type "Org. Range (-1,1)" removed
UPD: angle, rising, falling type operators moved to indicator library

MTF RDX++ [@TradersVenue]This is multi timeframe RSI indicator which displays RSI value of 15/25/75/125/D/W/M timeframes in single window.
One can select or deselect individual RSI"s, choose RSI length of default RSI, length of slow/fast RSI.
Current RSI indicator considers below scenarios to be bullish 1) RSI > iRSILongLvl 2) Smaller TF RSI > Larger TF RSI
Current RSI indicator considers below scenarios to be bearish 1) RSI < iRSILongLvl 2) Smaller TF RSI < Larger TF RSI
Background of the indicator turns green when RSI trades above iRSILongLvl, turns red when RSI trades below iRSISellLvl else orage
If SlowRSI > SlowRSI then it indicates EMA(RSI(14), LEN) is in a upward slope i.e. its bullish
Along with RSI it displayes ADX as well. So one may go through the settings and enable or disable display of DI and ADX lines.
Few UI/UX customizations in chart, like changing line width, transparency, BG Color is provisioned for enhanced viewability
Trend and momentum score is calculated using RSI/ADX/MA/Volume/VWAP and then trend strength. Score >1 bullish. Score<1 bearish
BTST/STBT signals added in the indicator for overnight brokenwing straddles. Details will be explained during webinar.

LIZ TIME DIMENSION (SMA)Each hourly foot can display the moving average line for the same period of time in the same color.
The average moving line that you want to see is displayed by time leg, as well as the long-term Bollinger band that should be noticed by the time leg.
1. You can get a lot of useful information at a glance by displaying the moving average line of the long-term and period setting that many traders are aware of.
○ The period setting of the moving average line displayed in each time and foot is not fixed as usual, but changed the period by time and foot, and the moving average line of the same color
is the same.
It is a moving average line of time (for example, an hourly average line and a four-hour average line).Therefore, the market price is always the same even if the time to see changes
You can see it on a scale.It doesn't happen when you look at it in five minutes, but when you look at it in four hours, it looks like a downward trend.
○ The sensitivity of the rate to the moving average line displayed is very high.
You can see how rate moves, such as trends, are determined, and you can see reality in abstract chart moves
I can feel it.Purple 24 hours (one day) moving average line with 1 minute to 4 hours of foot, Green 1 week moving average line with 5 minute to day.
The sensitivity to the Blue Monthly Movement Average Line, which is displayed from 5 mins to 5 weeks, and Red One Year Movement Average Line, which is displayed from 1 hour to 5 weeks,
is very high.
Just look at whether the rates are moving up or down the moving average line and you'll be able to decide what to look for.
○ What is the positional relation between the moving average line of seven (eight in addition to the weekly moving average line) in the short, short, medium, medium, long, and long periods?
To make the direction and intensity of the trend easier to recognize, it is colored between moving averages to be visible as short- and medium-term clouds.
The three clouds changed color to warm rising clouds and cold falling clouds, depending on the relation of the moving averages.
·Strong upward trend rates when all clouds are unified in either upward or downward direction and are arranged in the order of short-term, medium-term or long-term clouds
·The thickness of the clouds is strong, and when the thickness is increased, the trend rate is strong.
·Trendless market when clouds overlap or the colors of the clouds are mixed
• Range price when rates are moving back and forth between clouds
You can visually and intuitively understand the market conditions, such as .
○ Short-term, short-term, medium- and short-term positional relationships will indicate the timing of the entry payment and the direction of the long-short.It's also written.
In conjunction with this, the duration for which the background color should be long changes to light warm color and warm color, and the duration for short changes to light cold and cold
color.
2. The long-term Bollinger band is displayed so that you can trade with the higher time base than the time base you see.
○ You can ride on a long-term trend by detecting and entering the trend occurrence of long-term feet with short-term feet.
Buy high prices, sell low prices, relax your trend-follow-style tears, and enable stress-free entries.
○ A light, transparent gray filter is displayed between the long-term foot Bollinger band ±1σ which sets the period suitable for the time and foot.
I understand that while the rate is moving in this zone (called gray zone), it is difficult to trend and the price range is small, so it should not be taken care of.
Yes, you can use this filter to prevent deception when the volatility is not present, and if you are out of the filter, you can use the above sign.
By trading in accordance, you can invest in trend-follow tiles while avoiding losses in range markets.
○ Bollinger bands generally display six of ±1σ, ±2σ and ±3σ, but in this indicator, two are inside ±1σ and two are outside ±3σ.
We have added a total of four bands.The former sets up early entries and the latter sets up new reverse positions, expecting a market shift from overheating.
for tips on how to
○ Expansion period (expansion period) due to characteristics of the Bollinger band is a period when volatility is big for trade, and a squeeze period
(Shrinking period) I understand that the volatility is small and it is not suitable for trade.Also, it's a squeeze period, but it's not
You can seize investment opportunities by making you expect the timing to move from contraction to expansion and by watching.
※Valid time difference by series
1 minute, 5 minutes, 15 minutes, 30 minutes 1 Hour, 4 Hour, Daily, Week (Total 8 Hours)
。This is the top version of the Makenai Chart indicator.
。Bolinger band ±3σ with 200 SMA and 200 SMA as the center band is now displayed in common on each hour leg.
。Changing the setting of the foot short-term moving average line for 5 minutes 15 minutes 30 minutes 1 hour to make the short-term cloud easily twisted and to speed up the trading timing.
。Adding ultra short term and short term clouds, which are much shorter than short term clouds, we responded to the requests of traders who want to deal with the roller coaster market and
cut the profit quickly.
(Select short-term clouds, short-term clouds, and ultra-short-term clouds to be used for entry and settlement according to the trade style and the 'dissociation between price and moving average'
which varies depending on the brand, time, and market value.)
。According to the calculation of another indicator (LIZ ADX+DMI), the background has become gray synchronously for a period of inactivity and non-trading.
(In such a period, it is often difficult to follow the trend because the market price is difficult even for lower-level ones, and often it is difficult to follow the trend.)
·Many indicators are counted in one, so you can also view the free version of your account, which has three indicators to display.
The moving avarage lines are SMA. ( I have another version which has EMA lines.)
If you are interested in the invitation-only indicator, please contact us on private chat.
各時間足で同じ期間の移動平均線が同じ色で表示できます。
時間足によって見たい複数の移動平均線が表示される他、その時間足で意識すべき期間設定された長期ボリンジャーバンドも表示されます。
1.長期間でかつ多くのトレーダーが意識する期間設定の移動平均線が表示される事で
以下の有益な情報を一目で得る事ができます。
○各時間足に表示される移動平均線の期間設定は、通常のように期間を一定にするの ではなく、期間を時間足毎に変え同色の移動平均線は同じ時間の移動平均線
(例えば1時間平均線、4時間平均線というように。)としてあります。
このため、見る時間足が変わっても、相場を常に同じ尺度で眺める事ができます。
「5分足では上昇トレンドに、4時間足では下落トレンドに見える。」
という事が起こりません。
○表示される移動平均線に対するレートの感応度は非常に高く、移動平均線にレ-ト
が差し掛かると抵抗を受け反発したり移動平均線を抜けると、勢いよくトレンドが
発生するなど、レートの動きがどのようにして決まっているかを実感でき、抽象的
だったチャートの動きにリアリティーを感じる事ができます。
特に1分足から4時間足まで表示される紫24時間(1日)移動平均線、5分足から
日足まで表示される緑1週間移動平均線、5分足から週足まで表示される青1ヶ月
移動平均線、1時間足から週足まで表示される赤1年移動平均線に対する感応度は
非常に高く、それぞれの移動平均線の上下どちらでレートが推移しているかを見る
だけで、買い目線売り目線の決定ができます。
○短々期、短期、中短期、中期、中長期、長期、長々期の7本
(週足だけはそれに加え最長期の8本)の移動平均線がどのような位置関係にあるか
によってトレンドの方向と強さが認識しやすいよう移動平均線間に着色し短期雲、
中期雲として意識できるようになっています。
3つの雲は移動平均線の関係によりそれぞれ暖色の上昇雲、寒色の下落雲に色が変わり、
・全ての雲が上昇下落どちらかに統一されで短期雲、中期雲、長期雲という順に並
んでいる時は強い上昇トレンド相場
・雲の傾きがきつく厚みがしっかりしている、厚みが増している時は強いトレンド相場
・雲が重なったり、各雲の色がまちまちの時はトレンドレス相場
・雲と雲の間をレートが行ったり来たりしている時はレンジ相場
など、視覚的直感的に相場の状況が理解できます。
表示が可能な時間足は1分、5分、15分 30分、60分、4時間、1日、1週間(合計8つ)です。
※Makenai Chart Indicator の上位版です。
・200SMA,200SMAを中心バンドとするボリンジャーバンド±3σが各時間足に共通で表示されるようになりました。
・5分15分30分1時間足短期移動平均線の設定を変更し、短期雲がねじれやすくし、決済タイミングを早めました。
・短期雲よりさらに短い、超短期雲・短々期雲を追加し、ジェットコースター相場への対応、早めに利確・損切りしたいトレーダーの要望に対応しました。
(トレードスタイルに応じ、また銘柄・時間足・相場つきによって変わる『価格と移動平均線との解離』に応じ、エントリー・決済に使う短期雲・短々期雲・超短期雲を選択します。)
・別のインジケーター(LIZ ADX+DMI)の計算による、ボラティティーがなくトレードに向かない期間は、同期して背景がグレーになるようになりました。
(LIZ ADX+DMIの詳細はこちらのリンクからご覧になれます。 )
(そのような期間は下位足でも難しい相場つき、レンジやランダム相場になっている事が多いため、トレンドフォローが難しい可能性が高いです。)
・たくさんのインジケーターが1つにカウントされるため、表示できるインジケーター3つの制限がある、無料版のアカウントをお使いの方も表示できます
移動平均線はSMAです。(EMA線がある別のバージョンがあります)
招待専用インジに興味ある方はプライベートチャットに連絡をください。

[blackcat] L1 Enhanced DMILevel: 1
Background
The Directional Movement Index (DMI) is an indicator developed by J. Welles Wilder in 1978 that shows the direction in which the price of an asset is moving. The indicator does this by comparing previous highs and lows and drawing two lines: a positive directional movement line (+ DI) and a negative directional movement line (-DI). An optional third line, called the Average Directional Index (ADX), can also be used to measure the strength of the upward or downward trend.
When + DI is above -DI there is more upward pressure than downward pressure in price. Conversely, when -DI is above + DI, there is more downward pressure on the price. This indicator can help traders estimate the direction of the trend. Crossovers between the lines are also sometimes used as trading signals to buy or sell.
Function
This is a blackcat1402 enhanced DMI indicator by counting period number of +DI and -DI relationship, overbought and oversold states are given.
Key Signal
White line --> +DI
Yellow line --> -DI
Fuchsia line --> ADX
Green line --> ADXR, or averaged ADX
red OB label --> overbought
green OS label --> oversold
Remarks
Feedbacks are appreciated.
Readme
In real life, I am a prolific inventor. I have successfully applied for more than 60 international and regional patents in the past 12 years. But in the past two years or so, I have tried to transfer my creativity to the development of trading strategies. Tradingview is the ideal platform for me. I am selecting and contributing some of the hundreds of scripts to publish in Tradingview community. Welcome everyone to interact with me to discuss these interesting pine scripts.
The scripts posted are categorized into 5 levels according to my efforts or manhours put into these works.
Level 1 : interesting script snippets or distinctive improvement from classic indicators or strategy. Level 1 scripts can usually appear in more complex indicators as a function module or element.
Level 2 : composite indicator/strategy. By selecting or combining several independent or dependent functions or sub indicators in proper way, the composite script exhibits a resonance phenomenon which can filter out noise or fake trading signal to enhance trading confidence level.
Level 3 : comprehensive indicator/strategy. They are simple trading systems based on my strategies. They are commonly containing several or all of entry signal, close signal, stop loss, take profit, re-entry, risk management, and position sizing techniques. Even some interesting fundamental and mass psychological aspects are incorporated.
Level 4 : script snippets or functions that do not disclose source code. Interesting element that can reveal market laws and work as raw material for indicators and strategies. If you find Level 1~2 scripts are helpful, Level 4 is a private version that took me far more efforts to develop.
Level 5 : indicator/strategy that do not disclose source code. private version of Level 3 script with my accumulated script processing skills or a large number of custom functions. I had a private function library built in past two years. Level 5 scripts use many of them to achieve private trading strategy.

SEA RSI/DMI CrissCross v1.3*This is not financial advice, I am not a financial advisor. Use at your own risk, good luck and thank you.*
-Building from the original RSI CrissCross I've added an ADXDMI that's also fully adjustable including resolution. The ADXDMI is interpreted visually as a histogram(adx+di+/adx+di-, respectively for bull/bear reads), can also enable standard ADXDMI visually by adjusting the transparency. Threshold for the histogram is 13(25), 23(50), 52(75) respectively.
-Utilizing the varRSI as a "fast" RSI relative to the fixedRSI(your current TF) this provides an early insight into the momentum on lower TFs(or higher ones should you choose to use it that way).
-After an RSI cross observe the reaction in the bullish / bearish control zones and any divergences that appear indicating a change in momentum.
-Rejection/Support of the MA, after a cross along the control zones provides a nice edge, couple this with a corresponding bull/bear ADX histogram read for extra confirmation of trend.
-For basic risk management, utilize the "fast" RSI crossing the opposite direction of signal (e.g. longing a bounce of the RSI above the MA after a cross would become invalidated if the "fast" RSI crossed back below the MA on the next few closures.
-This same method can be used to take profit, assuming price moves in your favor then begin taking profit when the "fast" RSI crosses back in the opposite direction of your trade, but in strong moves this "fast" cross can happen early so use the fixedRSI cross back if trend seems very strong.
-There are numerous alerts
-Good luck please drop your thoughts.

Didi's TrendChanges the background according to the DMI trend.
Based on the way the infamous Brazilian trader with over 40 years experience, Master Didi Aguiar reads the Directional Movement Index — one indicators in his setup.
It's read this way:
Only trade on the direction of the trend. Start the trade when accelerating:
Blue = Long trend
Bright Blue = Long trend, accelerating
Purple = Short trend
Bright Purple = Short trend, accelerating
Change from bright to dark color = ADX's bounce, the first signal to exit the trade.
Nor coloured background = no trend.
Use other indicators to confirm your trades.
Not recommended for color blind people :)
-----------------------------------------
Indicador que muda a cor do fundo de acordo com a tendencia.
É baseado na maneira que Didi Aguiar lê o DMI e o ADX .
Lê-se assim:
Fundo azul = Tendencia de compra
Fundo roxo = Tendencia de venda
Cor mais saturada (vibrante) = Tendencia acelerante
Passou de cor mais clara para mais escura = Kick do ADX
Sem coloração de fundo = Sem tendencia
Não é indicado para pessoas que sofrem de daltonismo.

PROFIT MAKER |Crypto|ETH|BTC|YFI - SignalThis is the version with alerts of this strategy:
Description:
This is a trend-following strategy that works very well for many Crypto assets in the usd or usdt pair
It can be used for both futures and spot!
Some of the assets in which this strategy is proven are
Asset Exchange TF
BINANCE:ADAUSDT Binance 45m
BINANCE:BTCUSDT Binance 1h
BINANCE:YFIUSDT Binance 30m
BINANCE:DOTUSDT Binance 45m
BINANCE:ETHUSDT Binance 30m
BINANCE:LINKUSDT Binance 45m
BINANCE:DOGEUSDT Binance 1h
And many others..
What is this strategy based on?
It is a combination of various parameters, including
-RSI: The relative strength index ( RSI ) is a momentum indicator used in technical analysis that measures
the magnitude of recent price changes to evaluate overbought or oversold conditions in the price of a stock or other asset.
-MACD: Moving average convergence divergence ( MACD ) is a trend-following momentum indicator that shows
the relationship between two moving averages of a security’s price.
-ADX: ADX is used to quantify trend strength. ADX calculations are based on a moving average of price range expansion over a given period of time.
-DMI: DMI is a moving average of range expansion over a given period (the default is 14 days). The positive directional
movement indicator ( +DMI ) measures how strongly price moves upward; the negative directional movement indicator ( -DMI )
measures how strongly price moves downward. The two lines reflect the respective strength of the bulls versus the bears.
Included:
Different forms of Take profit, included:
Take profit on squeeze candles
Take profit based on Risk-Benefit (RR)
Take profit a pre-determined %.
Different forms of Stop Loss, including
ATR-based stop loss
Trail stop loss (with option to use a trigger)
Stop loss a pre-determined %.
For access you can send a message or consult in my social networks.
Links in my tradingview signature (below).
Examples:
The default configuration works very well for most pairs.
You just have to look for which time frame goes better with each one.
Recommended to try with 30m, 45m and 1 hour.
