Dema DMI | viResearchDema DMI | viResearch
Conceptual Foundation and Innovation
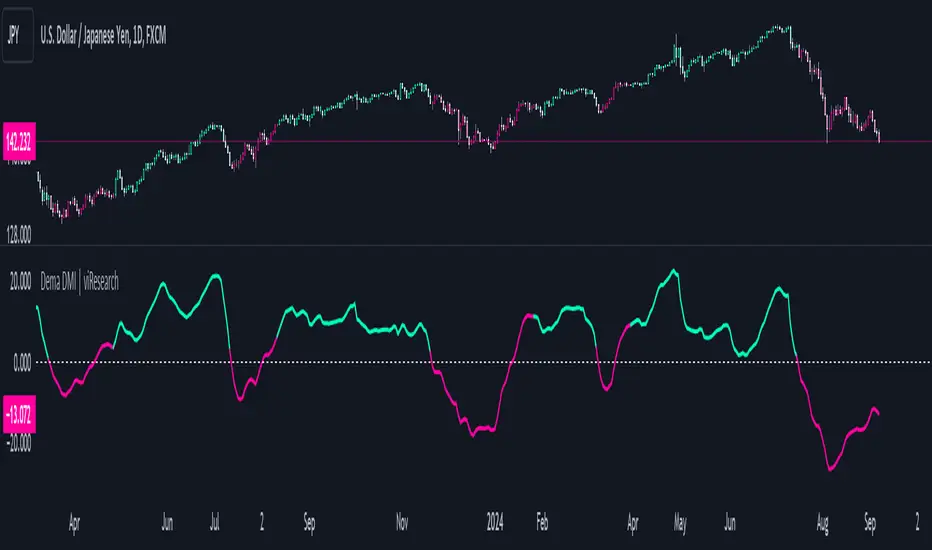
The "Dema DMI" indicator integrates the Double Exponential Moving Average (DEMA) with the Directional Movement Index (DMI), creating a more responsive and precise trend-following system. The DEMA is used to smooth price data while minimizing lag, making it highly effective for trend detection. The DMI, on the other hand, measures the strength and direction of a trend by analyzing positive and negative directional movements. By combining these two elements, the "Dema DMI" offers traders a powerful tool for identifying trend changes and evaluating the strength of ongoing trends. This combination helps filter out noise in price data while maintaining sensitivity to market movements, providing better trend signals and decision-making opportunities.
Technical Composition and Calculation
The "Dema DMI" script uses two main components: the Double Exponential Moving Average (DEMA) and the Directional Movement Index (DMI). The DEMA is applied to both the high and low prices, creating smoothed versions of these prices based on a user-defined length. The DMI is then calculated by comparing changes in the smoothed high and low prices to measure directional movement. Positive directional movement (DM+) and negative directional movement (DM−) are calculated by evaluating whether the price is trending upward or downward, and the Average Directional Index (ADX) is computed to measure the strength of the trend. The ADX is smoothed to provide a more stable signal of trend strength.
Features and User Inputs
The "Dema DMI" script provides several customizable inputs, enabling traders to tailor the indicator to their strategies. The DEMA Length controls the period over which the DEMA is calculated for both high and low prices. The DMI Length sets the window for calculating directional movement, while the ADX Smoothing Length determines how smooth the ADX line appears, making it easier to assess whether a trend is strengthening or weakening. The script also includes customizable bar colors and alert conditions, providing traders with clear visual cues and notifications when a trend change occurs.
Practical Applications
The "Dema DMI" indicator is designed for traders looking to assess trend strength and direction more effectively. The DEMA smooths price movements, while the DMI highlights shifts in directional movement, providing early signals of potential trend reversals. The ADX helps gauge whether a trend is gaining momentum, allowing traders to improve the timing of trade entries and exits. Additionally, the customizable inputs make the indicator adaptable to different market conditions, ensuring its usefulness in both trending and ranging environments.
Advantages and Strategic Value
The "Dema DMI" script offers significant value by merging the smoothing effects of DEMA with the directional analysis of the DMI. This combination reduces the lag commonly associated with trend-following indicators, providing more timely and accurate trend signals. The ADX further enhances the indicator’s utility by measuring the strength of the trend, helping traders filter out weak signals and stay aligned with stronger trends. This makes the "Dema DMI" an ideal tool for traders seeking to improve their trend-following strategies and optimize their market positioning.
Alerts and Visual Cues
The script includes alert conditions that notify traders when a significant trend change occurs. The "Dema DMI Long" alert is triggered when the indicator detects an upward trend, while the "Dema DMI Short" alert signals a potential downward trend. Visual cues, such as changes in the bar color and the difference between positive and negative directional movement, help traders quickly identify trend shifts and act accordingly.
Summary and Usage Tips
The "Dema DMI | viResearch" indicator combines the smoothing benefits of the DEMA with the directional analysis of the DMI, providing traders with a reliable tool for detecting trend changes and confirming trend strength. By incorporating this script into your trading strategy, you can improve your ability to detect early trend reversals, confirm trend direction, and reduce noise in price data. The "Dema DMI" is a flexible and adaptable solution for traders looking to enhance their technical analysis in various market conditions.
Note: Backtests are based on past results and are not indicative of future performance.
In den Scripts nach "adx" suchen
DEMA Adaptive DMI [BackQuant]DEMA Adaptive DMI
PLEASE Read the following, knowing what an indicator does at its core before adding it into a system is pivotal. The core concepts can allow you to include it in a logical and sound manner.
Conceptual Foundation and Innovation
The DEMA Adaptive DMI blends the Double Exponential Moving Average (DEMA) with the Directional Movement Index (DMI) to offer a unique approach to trend-following. By applying DEMA to the high and low prices, this indicator refines the traditional DMI calculation, enhancing its responsiveness to price changes. This results in a more adaptive and timely measure of market trends and momentum, providing traders with a more refined tool for capturing directional movements in the market.
Technical Composition and Calculation
At its core, the DEMA Adaptive DMI calculates the DEMA for both the high and low prices over a user-defined period. This dual application of DEMA serves to smooth out price fluctuations while retaining sensitivity to market movements. The DMI is then derived from the changes in these DEMA values, producing a set of plus and minus directional indicators that reflect the prevailing trend. Additionally, an Average Directional Index (ADX) is computed to measure the strength of the trend, with the entire process being dynamically adjusted based on the DEMA calculations.
DEMA Application:
The DEMA is applied to both high and low prices to reduce lag and provide a smoother representation of price action.
Directional Movement Calculation: The DMI is calculated using the smoothed price changes, resulting in plus and minus indicators that accurately reflect market trends.
ADX Calculation:
The ADX is computed to quantify the strength of the trend, offering traders insight into whether the market is trending strongly or is in a phase of consolidation.
Features and User Inputs The DEMA Adaptive DMI offers a range of customizable options to suit different trading styles and market conditions:
DEMA Calculation Period: Users can set the period for the DEMA calculation, allowing for adjustments based on the desired sensitivity.
DMI Length: The length of the DMI calculation can be adjusted, providing flexibility in how trends are measured.
ADX Smoothing Period: The smoothing period for the ADX can be customized to fine-tune the trend strength measurement.
Divergence Detection: Optional divergence detection features allow traders to spot potential reversals based on the DMI and price action.
Visualization options include static high and low levels to mark extreme DMI thresholds, the ability to color bars according to trend direction, and background hues to highlight overbought and oversold conditions.
Practical Applications
The DEMA Adaptive DMI is particularly effective in markets where trend strength and direction are crucial for successful trading. Traders can leverage this indicator to:
Identify Trend Reversals:
Detect potential trend reversals by monitoring the DMI and ADX in conjunction with divergence signals.
Trend Confirmation:
Use the DEMA-based DMI to confirm the strength and direction of a trend, aiding in the timing of entries and exits.
Strategic Positioning:
The indicator's responsiveness allows traders to position themselves effectively in fast-moving markets, reducing the risk of late entries or exits.
Advantages and Strategic Value
By integrating the DEMA with the DMI, this indicator provides a more adaptive and timely measure of market trends. The reduced lag from the DEMA ensures that traders receive signals that are closely aligned with current market conditions, while the dynamic DMI calculation offers a more accurate representation of trend direction and strength. This makes the DEMA Adaptive DMI a valuable tool for traders looking to enhance their trend-following strategies with a focus on precision and adaptability.
Summary and Usage Tips
The DEMA Adaptive DMI is a sophisticated trend-following indicator that combines the benefits of DEMA and DMI into a single, powerful tool. Traders are encouraged to incorporate this indicator into their trading systems for a more nuanced and responsive approach to trend detection and confirmation. Whether used for identifying trend reversals, confirming trend strength, or strategically positioning in the market, the DEMA Adaptive DMI offers a versatile and reliable solution for trend-following strategies.
Thus following all of the key points here are some sample backtests on the 1D Chart
Disclaimer: Backtests are based off past results, and are not indicative of the future.
INDEX:BTCUSD
INDEX:ETHUSD
BINANCE:SOLUSD

Directional Movement Index DEThis script uses the existing built-in DMI indicator but adds two lines indicating strength of the ADX trend. The original author J. Welles Wilder, indicated a ADX trending strongly above 25 (yellow by default), and ADX trending weaker at a threshold of 20 or below (dashed yellow by default).
The default colours have been changed so that ADX is yellow, +DI is green, and -DI is red.
Calculation
Calculating the DMI can actually be broken down into two parts. First, calculating the +DI and -DI, and second, calculating the ADX. To calculate the +DI and -DI you need to find the +DM and -DM (Directional Movement). +DM and -DM are calculated using the High, Low and Close for each period. You can then calculate the following:
Current High - Previous High = UpMove
Previous Low - Current Low = DownMove
If UpMove > DownMove and UpMove > 0, then +DM = UpMove, else +DM = 0
If DownMove > Upmove and Downmove > 0, then -DM = DownMove, else -DM = 0
Once you have the current +DM and -DM calculated, the +DM and -DM lines can be calculated and plotted based on the number of user defined periods.
+DI = 100 times Exponential Moving Average of (+DM / Average True Range)
-DI = 100 times Exponential Moving Average of (-DM / Average True Range)
Now that -+DX and -DX have been calculated, the last step is calculating the ADX.
ADX = 100 times the Exponential Moving Average of the Absolute Value of (+DI - -DI) / (+DI + -DI)
The basics
DMI has a value between 0 and 100 and is used to measure the strength of the current trend. +DI and -DI are then used to measure direction. When combined, the indicator can provide some valuable insight. A general interpretation would be that during a strong trend (ADX above 25 but dependent on the analyst's interpretation), when the +DI is above the -DI, then a Bullish Market is defined. When -DI is above +DI, then a Bearish Market is at hand.
One thing to be considered is that what DMI values determine, strength or a potential signal, is up to the trader's interpretation. Acceptable values may change depending on the financial instrument being examined, therefore some historical analysis of the instrument in question would be prudent. A technical analyst can make better decisions based on what has occurred in historical examples.
All credit goes to the original script .

TwV Market SignalsSignals Indicator
Summary
This indicator allows traders to have in handy short and long signals and estimate the trend of the market.
The indicator draws Long and Short signals depending on the trend analysis. The indicators also use meaningful colors for traders to be able to visually understand the graphs, such us fillings on EMAs, so the possible trend is represented.
The colors used are light green for bullish, red for bearish, dark green for possible bearish to bullish change and purple for possible bullish to bearish change. These colors are applicable to all fillings and summary box.
How to use this indicator
The use of EMAs 10,20 and 50 draw the medium to long term trends, therefore avoiding signals against the trend. Furthermore the EMAs will advise possible change in trends, specially considering the 10 and 20 cross, considering that crossing the 10,20 and 50, might confirm the change in med to long term trend change of the price. This is completely visual in the chart as it tints green for positive trend and yellow to red for negative trend.
The 200 SMA is included as it also gives better confirmation to the trend, the basics tell that when the EMAs mentioned above are below the 200 SMA then the likelihood for entries in long positions are not the best and vice versa for short.
Therefore, the trader shall filter Long and Short Signals accordingly as this EMAs are not used to send Long and Short signals considering that they confirm the trend in a slow pace and not reactively to the price volatility.
There are two strategies built-in within the indicator:
Strategy 1 – Longer time trades and high volatility handling
The Long and Short Signals are based on 14 and EMAs (by default). This two Mas are used to send signals based on their crossovers as they are way more reactive to the price movement.
Trader shall consider that EMAs are used for higher timeframes, therefore the indicator has the possibility to adjust the EMAs and use SMAs or WMAs instead for one or the two parameters (14 and 21).
WMAs react faster to the price volatility so the trader shall adjust this according to the timeframe being used. (Lower timeframes suggested).
This strategy is used for trades that might keep running for longer periods of times.
For reference on what the SMAs, EMAs and WMAs are, please see below sections in the description.
Strategy 2 - Shorter time trades and unhandled high volatility
The Long and Short Signals are bases on HMA. HMAs (Hull Moving Averages) track the price movement and volatility way faster that SMAs, EMAs and WMAs, therefore as the HMA follow the price quicker, it is intended for short time trades even in higher timeframes.
Scalping is not suggested using this strategy as HMA do not handle high volatility even on higher timeframes.
One of the biggest differences from the first strategy is that there is no more than a single HMA length to work with, which is 24 as default.
HMAs calculation is different to other MAs, therefore combining various HMAs lengths looking for crossovers become trend identification a lot less precise. HMAs are not intended to be used with different length crossovers.
Exit points = The use of Stochastic and VRVP
Stochastic RSI
It is well known that when Stochastic RSI resets when overbought or oversold therefore traders have within a summary box the possibility to check whether the K & D lines in the Stochastic RSI hace crossed over bullish or bearish.
Although the crossover is not mandatory for a change trend, the crossover might be used by the trader to exit a position considering that the price might move on the opposite direction.
Traders shall look at the summary box, where bullish and bearish crossovers are shown, so they evaluate their position exit.
Visible Range Volume Profile
The use of the VRVP is to find support and resistance on the price movements. Although high and lows are used as possible supports and resistances, VRVP shows an area of confluence on the order book, where volume of positions are accumulated and that might act as support or resistance depending on the price direction.
Traders can visually activate the VRVP to see the Point of Control (POC) directly on the chart as a line (similar as how a support or resistance would be drawn). Moreover, traders have the ability to see within the summary box, whether to see if the price is above or below the POC, so they clearly know if it is acting as support or resistance.
Price Direction
Trade the market trend is well know to be used to identify possible price direction. It is important not to confuse the longer time trend drawn by the EMAs with the TTM Trend bar color. The TTM trend colors bars according to the price direction, helping traders not to confuse when a red bar appears on an up trend or green bars on a down trend.
This coloring helps traders not to exit trades based on bar coloring, which might psychologically affect when scalping or short-term trading specially.
Originally, the TTM trend is used considering the ADX in and indicator called TTM Squeeze, where the strength of the movement is measured, therefore although candle colors help with the price direction, ADX provides the trader the ability to see whether the direction is losing momentum and then catch the best possible exit before the direction change.
How to use Summary
1. Receive the Long or Short Signals using strategy 1 or 2, depending on the selected in the main menu of the indicator.
2. Evaluate the trend based on the 10,20, 50 and 200 MAs. Filter the Long and Short signals accordingly.
3. Monitor constantly the TTM Trend and the ADX for the direction and strength of the position entered and review if the momentum is being lost, considering step 4 or other possible reasons that might lead to exiting the position.
4. Once entered to a position evaluate constantly the Stochastic RSI bearish or bullish crossover or POC value on screen or summary box to exit the position.
Terminology basics
Trend indicators
Exponential Moving Average (EMAs): The base indicator is composed of moving averages of 10, 20 and 55 exponential periods, to determine a possible bullish or bearish trend (EMA Crossing)
Simple Moving Average (SMA): The base indicator is composed of a moving average of 200 simple periods, which in conjunction with the EMAs can lead to estimate potential upward or downwards moves, as well as possible resistances. (SMA Positioning)
Weighted moving average (WMA): It is a technical indicator that traders use to generate trade direction and make a long or short position. It assigns greater weighting to recent data points and less weighting on past data points. (WMA Crossing)
Strength and S/R indicators
VPVR (Volume Profile Visible Range): It allows to determine the Point of Control (POC) which is the node with the highest volume profile. This can be used as an important retest point or to calculate potential support and resistance. The POC level is represented with a red dotted line in the graph.
The VPVR is a simplified version of the “TwV Multi-timeframe Dynamic VRVP” that you can find for free use in my profile. This version calculates the main’s timeframe POC and also has the possibility to be fixed range if the trader enables it from the menu. (Dynamic range by default).
ADX (Average Directional Index): The ADX helps the indicator to estimate the strength of the movement, always considering the DI+ and DI- to not go against the trend strength. This is represented as summary text in a table.
/
Exit indicator
Stochastic RSI: It is an indicator used in technical analysis that ranges between zero and a hundred and is created by applying the Stochastic oscillator formula to a set of relative strength index (RSI) values rather than to standard price data. Using RSI values within the Stochastic formula gives traders an idea of whether the current RSI value is overbought or oversold (Exit zones)
/
Summary Panel
This panel allows the trader to have a summary of the current status (bearish or bullish) of some of the most determinant indicators within the strategy. It has the following characteristics:
It is placed on the right bottom side of the chart by the default. Traders can change its position or hidden it through the main menu of the indicator.
Its colors change according to the indicator’s values and constant change for easier detection.
The summary box shows the projection for each of the indicators (Trend, Stochastic, EMA, VPVR and ADX).
The summary box is multi-language (English and Spanish), which can be changes in the main menu of the indicator
Alerts
Within the indicator’s menu, you can set up alerts for all long, short, close long and close short signals, which might come in handy when the trader would like to have notifications on the Trading View website, desktop app or phone apps. Furthermore, there are also signals for possible exit points, which can also be activated from the indicator’s menu.

TwV Market Signals ScreenerMarket Signals Screener
This indicator allows traders to have a view of multiple pairs and timeframes Long/Short signals and specific information of parameters, based on the TwV Market Signals also developed by me and that can be found on my profile.
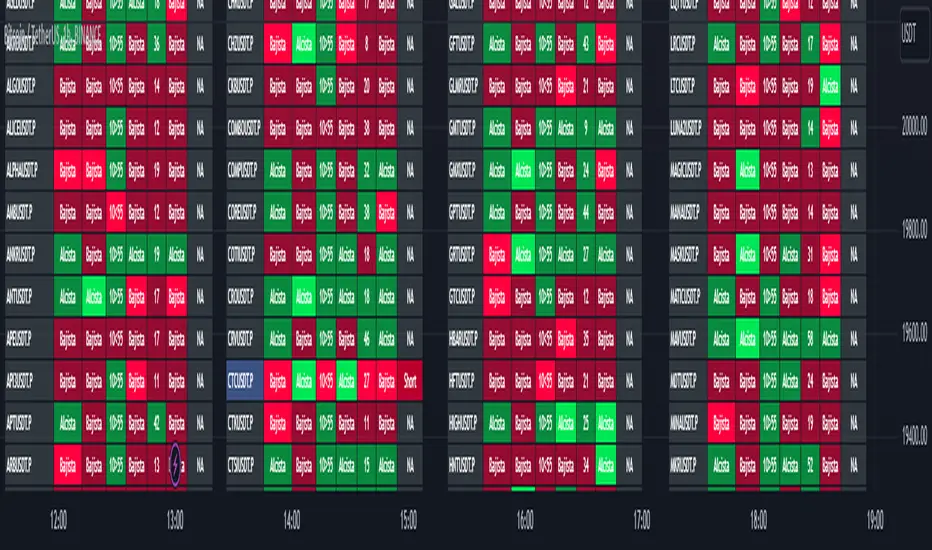
Full Screener Panel
This panel allows the trader to monitor multiple pairs at a single screen, giving an immediate vision of possible entries and exits (Long/Short). Moreover, allows traders to have handy all information of the TwV Market Signals Indicator that might be analyzed further for each pair. It has the following characteristics:
It can be placed anywhere on the screen through the main menu of the indicator.
It can be combined with the same indicator multiple times, as per screener is limited to show 40 pairs, you can select the number of panels being added to adjust position one next to each other.
It strengthens colors when a pair has changed its signals in order to the trader to know immediate changes and then do the follow up
The screener shows the pairs, which can be changed within the menus.
The screener shows the Long and Short Signals in its las column but previously, it shows the most critical parameters in the strategies (Market Signals Indicator) that determined the possible Long/Short position. Therefore, the EMAs, STOCH, SQZ, ADX, and TTM, are summarized in the screener for each pair.
For analyzing a specific pair, refer to the the Twv Market Signals Indicator, which is other indicator that might be on my TradingView Profile and that was used as base for the screener.
How to use this indicator and work with the strategies of the TwV Market Signals Indicator
The use of EMAs 10,20 and 50 draw the medium to long term trends, therefore avoiding signals against the trend. Furthermore, the EMAs will advise possible change in trends, especially considering the 10 and 20 cross, considering that crossing the 10,20 and 50, might confirm the change in med to long term trend change of the price. This is completely visual in the chart as it tints green for positive trend and yellow to red for negative trend.
The 200 SMA is included as it also gives better confirmation to the trend, the basics tell that when the EMAs mentioned above are below the 200 SMA then the likelihood for entries in long positions are not the best and vice versa for short.
Therefore, the trader shall filter Long and Short Signals accordingly as this EMAs are not used to send Long and Short signals considering that they confirm the trend in a slow pace and not reactively to the price volatility.
There are two strategies built-in within the indicator:
Strategy 1 – Longer time trades and high volatility handling
The Long and Short Signals are based on 14 and EMAs (by default). This two Mas are used to send signals based on their crossovers as they are way more reactive to the price movement.
Trader shall consider that EMAs are used for higher timeframes, therefore the indicator has the possibility to adjust the EMAs and use SMAs or WMAs instead for one or the two parameters (14 and 21).
WMAs react faster to the price volatility so the trader shall adjust this according to the timeframe being used. (Lower timeframes suggested).
This strategy is used for trades that might keep running for longer periods of times.
For reference on what the SMAs, EMAs and WMAs are, please see below sections in the description.
Strategy 2 - Shorter time trades and unhandled high volatility
The Long and Short Signals are bases on HMA. HMAs (Hull Moving Averages) track the price movement and volatility way faster that SMAs, EMAs and WMAs, therefore as the HMA follow the price quicker, it is intended for short time trades even in higher timeframes.
Scalping is not suggested using this strategy as HMA do not handle high volatility even on higher timeframes.
One of the biggest differences from the first strategy is that there is no more than a single HMA length to work with, which is 24 as default.
HMAs calculation is different to other MAs, therefore combining various HMAs lengths looking for crossovers become trend identification a lot less precise. HMAs are not intended to be used with different length crossovers.
Exit points = The use of Stochastic and VRVP
Stochastic RSI
It is well known that when Stochastic RSI resets when overbought or oversold therefore traders have within a summary box the possibility to check whether the K & D lines in the Stochastic RSI hace crossed over bullish or bearish.
Although the crossover is not mandatory for a change trend, the crossover might be used by the trader to exit a position considering that the price might move on the opposite direction.
Traders shall look at the summary box, where bullish and bearish crossovers are shown, so they evaluate their position exit.
Visible Range Volume Profile
The use of the VRVP is to find support and resistance on the price movements. Although high and lows are used as possible supports and resistances, VRVP shows an area of confluence on the order book, where volume of positions are accumulated and that might act as support or resistance depending on the price direction.
Traders can visually activate the VRVP to see the Point of Control (POC) directly on the chart as a line (similar as how a support or resistance would be drawn). Moreover, traders have the ability to see within the summary box, whether to see if the price is above or below the POC, so they clearly know if it is acting as support or resistance.
Price Direction
Trade the market trend is well known to be used to identify possible price direction. It is important not to confuse the longer time trend drawn by the EMAs with the TTM Trend bar color. The TTM trend colors bars according to the price direction, helping traders not to confuse when a red bar appears on an uptrend or green bars on a down trend.
This coloring helps traders not to exit trades based on bar coloring, which might psychologically affect when scalping or short-term trading specially.
Originally, the TTM trend is used considering the ADX in and indicator called TTM Squeeze, where the strength of the movement is measured, therefore although candle colors help with the price direction, ADX provides the trader the ability to see whether the direction is losing momentum and then catch the best possible exit before the direction change.
Terminology basics
Trend indicators
Exponential Moving Average (EMAs): The base indicator is composed of moving averages of 10, 20 and 55 exponential periods, to determine a possible bullish or bearish trend (EMA Crossing)
Simple Moving Average (SMA): The base indicator is composed of a moving average of 200 simple periods, which in conjunction with the EMAs can lead to estimate potential upward or downwards moves, as well as possible resistances. (SMA Positioning)
Weighted moving average (WMA): It is a technical indicator that traders use to generate trade direction and make a long or short position. It assigns greater weighting to recent data points and less weighting on past data points. (WMA Crossing)
Strength and S/R indicators
VPVR (Volume Profile Visible Range): It allows to determine the Point of Control (POC) which is the node with the highest volume profile. This can be used as an important retest point or to calculate potential support and resistance. The POC level is represented with a red dotted line in the graph.
The VPVR is a simplified version of the “TwV Multi-timeframe Dynamic VRVP” that you can find for free use in my profile. This version calculates the main’s timeframe POC and also has the possibility to be fixed range if the trader enables it from the menu. (Dynamic range by default).
ADX (Average Directional Index): The ADX helps the indicator to estimate the strength of the movement, always considering the DI+ and DI- to not go against the trend strength. This is represented as summary text in a table.
/
Exit indicator
Stochastic RSI: It is an indicator used in technical analysis that ranges between zero and a hundred and is created by applying the Stochastic oscillator formula to a set of relative strength index (RSI) values rather than to standard price data. Using RSI values within the Stochastic formula gives traders an idea of whether the current RSI value is overbought or oversold (Exit zones)
/
How to use Summary
1. Receive the Long or Short Signals using strategy 1 or 2, depending on the selected in the main menu of the indicator.
2. Evaluate the trend based on the 10,20, 50 and 200 MAs. Filter the Long and Short signals accordingly.
3. Monitor constantly the TTM Trend and the ADX for the direction and strength of the position entered and review if the momentum is being lost, considering step 4 or other possible reasons that might lead to exiting the position.
4. Once entered to a position evaluate constantly the Stochastic RSI bearish or bullish crossover or POC value on screen or summary box to exit the position.
5. Consider that for doing the evaluation individually, you shall use the TwV Market Signals.
Market First Signals - Relative Strength/WeaknessThis market-first trading strategy gives BUY, SHORT, and CLOSE signals based on volume, trend, and relative strength or weakness to the market (SPY by default, can be customized). This indicator is useful for signaling day-trade entries and exits for tickers that are strong (or weak) against the market.
Stocks that are showing relative strength (or weakness) to the market, are trending, and have decent movement generate a buy (or short) signal. When the trend runs out, a CLOSE signal is fired.
Potential profit (based on ATR) and actual profit is calculated, predicting the type of move expected
Unique 'stay in trade' logic helps prevent unnecessary CLOSE signals if a trend is likely to continue
A colored plot indicates the strength of the current trend and turns orange/red when the strength is weakened.
Crypto traders can uncheck 'Trade during market hours' for 24-hour trading, and should change the comparison ticker from SPY to BTCUSD or something similar for their market.
Enjoy!
KEY CONCEPTS
The three- and five-minute timeframes are used to establish and verify trend (ADX/DI with custom logic)
Entries and exits are based on Parabolic SAR and confirmed on multiple timeframes, trend, and relative volume
Relative strength /weakness to the market compares ticker to SPY
Chop is avoided at all costs. I've experimented with choppiness indicator below 38, but found that the ADX DI+/- readings work even better.
Trend is established using ADX DI+/- readings over 20, confirmed by EMA 5/13 crossover and EMA5 slope
Signals will fire only if the average volume for the current 5-min bar is above normal
Only tickers with a five-bar / 13 period ATR of 1% the ticker's price generate signal.
Only longs above daily-anchored VWAP, shorts below daily-anchored VWAP
Signals fire on bar close to prevent repainting / look-ahead bias
Indicator labels and alerts generated
SIGNALS
BUY: up-trending tickers showing relative strength are bought on the three-minute PSAR
SELL: when the close price falls below the 1, 3, and 5-minute PSAR, or the ADX DI- falls below 20
SHORT: down-trending tickers with relative weakness are shorted on the three-minute PSAR
COVER: when the close price moves above the 1, 3, and 5-minute PSAR, or the ADX DI- falls below 20
ALERTS
Alerts are generated on BUY, SELL, SHORT, and COVER signals, as well as optional LOST RELATIVE STRENGTH and LOST RELATIVE WEAKNESS
INPUTS
Use relative strength/weakness comparison with the market : trigger trades based on the ticker's strength or weakness to the selected comparison ticker (usually SPY for equities or BTCUSD for crypto)
Comparison Ticker for relative strength/weakness : Ticker to compare against for relative strength/weakness
Trade during market hours only : Take buy/sells during specified hours. Disable this for crypto trading.
Market hours (market time) : Customize market hours - defaults to 9:30 to 16:00 EST
"Only trade very strong trends" : take trades only if an established trend is very strong (ADX over 40) (DEFAULT = OFF)
"Limit trade direction to VWAP" : Long trades only above VWAP, shorts below (DEFAULT = ON)
"Limit trade direction to Market direction" : Long trades only if SPY (or selected comparison ticker) is up, shorts if the market is down. (DEFAULT= OFF)
"Limit trades based on a ticker's green/red status for the day" : Long trades if the ticker is green for the day, shorts if red. (DEFAULT = OFF)

SUPERTREND MIXED ICHI-DMI-DONCHIAN-VOL-GAP-HLBox@RLSUPERTREND MIXED ICHI-DMI-VOL-GAP-HLBox@RL
by RegisL76
This script is based on several trend indicators.
* ICHIMOKU (KINKO HYO)
* DMI (Directional Movement Index)
* SUPERTREND ICHIMOKU + SUPERTREND DMI
* DONCHIAN CANAL Optimized with Colored Bars
* HMA Hull
* Fair Value GAP
* VOLUME/ MA Volume
* PRICE / MA Price
* HHLL BOXES
All these indications are visible simultaneously on a single graph. A data table summarizes all the important information to make a good trade decision.
ICHIMOKU Indicator:
The ICHIMOKU indicator is visualized in the traditional way.
ICHIMOKU standard setting values are respected but modifiable. (Traditional defaults = .
An oriented visual symbol, near the last value, indicates the progression (Ascending, Descending or neutral) of the TENKAN-SEN and the KIJUN-SEN as well as the period used.
The CLOUD (KUMO) and the CHIKOU-SPAN are present and are essential for the complete analysis of the ICHIMOKU.
At the top of the graph are visually represented the crossings of the TENKAN and the KIJUN.
Vertical lines, accompanied by labels, make it possible to quickly visualize the particularities of the ICHIMOKU.
A line displays the current bar.
A line visualizes the end of the CLOUD (KUMO) which is shifted 25 bars into the future.
A line visualizes the end of the chikou-span, which is shifted 25 bars in the past.
DIRECTIONAL MOVEMENT INDEX (DMI) : Treated conventionally : DI+, DI-, ADX and associated with a SUPERTREND DMI.
A visual symbol at the bottom of the graph indicates DI+ and DI- crossings
A line of oriented and colored symbols (DMI Line) at the top of the chart indicates the direction and strength of the trend.
SUPERTREND ICHIMOKU + SUPERTREND DMI :
Trend following by SUPERTREND calculation.
DONCHIAN CHANNEL: Treated conventionally. (And optimized by colored bars when overshooting either up or down.
The lines, high and low of the last values of the channel are represented to quickly visualize the level of the RANGE.
SUPERTREND HMA (HULL) Treated conventionally.
The HMA line visually indicates, according to color and direction, the market trend.
A visual symbol at the bottom of the chart indicates opportunities to sell and buy.
VOLUME:
Calculation of the MOBILE AVERAGE of the volume with comparison of the volume compared to the moving average of the volume.
The indications are colored and commented according to the comparison.
PRICE: Calculation of the MOBILE AVERAGE of the price with comparison of the price compared to the moving average of the price.
The indications are colored and commented according to the comparison.
HHLL BOXES:
Visualizes in the form of a box, for a given period, the max high and min low values of the price.
The configuration allows taking into account the high and low wicks of the price or the opening and closing values.
FAIR VALUE GAP :
This indicator displays 'GAP' levels over the current time period and an optional higher time period.
The script takes into account the high/low values of the current bar and compares with the 2 previous bars.
The "gap" is generated from the lack of overlap between these bars. Bearish or bullish gaps are determined by whether the gap is above or below HmaPrice, as they tend to fill, and can be used as targets.
NOTE: FAIR VALUE GAP has no values displayed in the table and/or label.
Important information (DATA) relating to each indicator is displayed in real time in a table and/or a label.
Each information is commented and colored according to direction, value, comparison etc.
Each piece of information indicates the values of the current bar and the previous value (in "FULL" mode).
The other possible modes for viewing the table and/or the label allow a more synthetic view of the information ("CONDENSED" and "MINIMAL" modes).
In order not to overload the vision of the chart too much, the visualization box of the RANGE DONCHIAN, the vertical lines of the shifted marks of the ICHIMOKU, as well as the boxes of the HHLL Boxes indicator are only visualized intermittently (managed by an adjustable time delay ).
The "HISTORICAL INFO READING" configuration parameter set to zero (by default) makes it possible to read all the information of the current bar in progress (Bar #0). All other values allow to read the information of a historical bar. The value 1 reads the information of the bar preceding the current bar (-1). The value 10 makes it possible to read the information of the tenth bar behind (-10) compared to the current bar, etc.
At the bottom of the DATAS table and label, lights, red, green or white indicate quickly summarize the trend from the various indicators.
Each light represents the number of indicators with the same trend at a given time.
Green for a bullish trend, red for a bearish trend and white for a neutral trend.
The conditions for determining a trend are for each indicator:
SUPERTREND ICHIMOHU + DMI: the 2 Super trends together are either bullish or bearish.
Otherwise the signal is neutral.
DMI: 2 main conditions:
BULLISH if DI+ >= DI- and ADX >25.
BEARISH if DI+ < DI- and ADX >25.
NEUTRAL if the 2 conditions are not met.
ICHIMOKU: 3 main conditions:
BULLISH if PRICE above the cloud and TENKAN > KIJUN and GREEN CLOUD AHEAD.
BEARISH if PRICE below the cloud and TENKAN < KIJUN and RED CLOUD AHEAD.
The other additional conditions (Data) complete the analysis and are present for informational purposes of the trend and depend on the context.
DONCHIAN CHANNEL: 1 main condition:
BULLISH: the price has crossed above the HIGH DC line.
BEARISH: the price has gone below the LOW DC line.
NEUTRAL if the price is between the HIGH DC and LOW DC lines
The 2 other complementary conditions (Datas) complete the analysis:
HIGH DC and LOW DC are increasing, falling or stable.
SUPERTREND HMA HULL: The script determines several trend levels:
STRONG BUY, BUY, STRONG SELL, SELL AND NEUTRAL.
VOLUME: 3 trend levels:
VOLUME > MOVING AVERAGE,
VOLUME < MOVING AVERAGE,
VOLUME = MOVING AVERAGE.
PRICE: 3 trend levels:
PRICE > MOVING AVERAGE,
PRICE < MOVING AVERAGE,
PRICE = MOVING AVERAGE.
If you are using this indicator/strategy and you are satisfied with the results, you can possibly make a donation (a coffee, a pizza or more...) via paypal to: lebourg.regis@free.fr.
Thanks in advance !!!
Have good winning Trades.
**************************************************************************************************************************
SUPERTREND MIXED ICHI-DMI-VOL-GAP-HLBox@RL
by RegisL76
Ce script est basé sur plusieurs indicateurs de tendance.
* ICHIMOKU (KINKO HYO)
* DMI (Directional Movement Index)
* SUPERTREND ICHIMOKU + SUPERTREND DMI
* DONCHIAN CANAL Optimized with Colored Bars
* HMA Hull
* Fair Value GAP
* VOLUME/ MA Volume
* PRIX / MA Prix
* HHLL BOXES
Toutes ces indications sont visibles simultanément sur un seul et même graphique.
Un tableau de données récapitule toutes les informations importantes pour prendre une bonne décision de Trade.
I- Indicateur ICHIMOKU :
L’indicateur ICHIMOKU est visualisé de manière traditionnelle
Les valeurs de réglage standard ICHIMOKU sont respectées mais modifiables. (Valeurs traditionnelles par défaut =
Un symbole visuel orienté, à proximité de la dernière valeur, indique la progression (Montant, Descendant ou neutre) de la TENKAN-SEN et de la KIJUN-SEN ainsi que la période utilisée.
Le NUAGE (KUMO) et la CHIKOU-SPAN sont bien présents et sont primordiaux pour l'analyse complète de l'ICHIMOKU.
En haut du graphique sont représentés visuellement les croisements de la TENKAN et de la KIJUN.
Des lignes verticales, accompagnées d'étiquettes, permettent de visualiser rapidement les particularités de l'ICHIMOKU.
Une ligne visualise la barre en cours.
Une ligne visualise l'extrémité du NUAGE (KUMO) qui est décalé de 25 barres dans le futur.
Une ligne visualise l'extrémité de la chikou-span, qui est décalée de 25 barres dans le passé.
II-DIRECTIONAL MOVEMENT INDEX (DMI)
Traité de manière conventionnelle : DI+, DI-, ADX et associé à un SUPERTREND DMI
Un symbole visuel en bas du graphique indique les croisements DI+ et DI-
Une ligne de symboles orientés et colorés (DMI Line) en haut du graphique, indique la direction et la puissance de la tendance.
III SUPERTREND ICHIMOKU + SUPERTREND DMI
Suivi de tendance par calcul SUPERTREND
IV- DONCHIAN CANAL :
Traité de manière conventionnelle.
(Et optimisé par des barres colorées en cas de dépassement soit vers le haut, soit vers le bas.
Les lignes, haute et basse des dernières valeurs du canal sont représentées pour visualiser rapidement la fourchette du RANGE.
V- SUPERTREND HMA (HULL)
Traité de manière conventionnelle.
La ligne HMA indique visuellement, selon la couleur et l'orientation, la tendance du marché.
Un symbole visuel en bas du graphique indique les opportunités de vente et d'achat.
*VI VOLUME :
Calcul de la MOYENNE MOBILE du volume avec comparaison du volume par rapport à la moyenne mobile du volume.
Les indications sont colorées et commentées en fonction de la comparaison.
*VII PRIX :
Calcul de la MOYENNE MOBILE du prix avec comparaison du prix par rapport à la moyenne mobile du prix.
Les indications sont colorées et commentées en fonction de la comparaison.
*VIII HHLL BOXES :
Visualise sous forme de boite, pour une période donnée, les valeurs max hautes et min basses du prix.
La configuration permet de prendre en compte les mèches hautes et basses du prix ou bien les valeurs d'ouverture et de fermeture.
IX - FAIR VALUE GAP
Cet indicateur affiche les niveaux de 'GAP' sur la période temporelle actuelle ET une période temporelle facultative supérieure.
Le script prend en compte les valeurs haut/bas de la barre actuelle et compare avec les 2 barres précédentes.
Le "gap" est généré à partir du manque de recouvrement entre ces barres.
Les écarts baissiers ou haussiers sont déterminés selon que l'écart est supérieurs ou inférieur à HmaPrice, car ils ont tendance à être comblés, et peuvent être utilisés comme cibles.
NOTA : FAIR VALUE GAP n'a pas de valeurs affichées dans la table et/ou l'étiquette.
Les informations importantes (DATAS) relatives à chaque indicateur sont visualisées en temps réel dans une table et/ou une étiquette.
Chaque information est commentée et colorée en fonction de la direction, de la valeur, de la comparaison etc.
Chaque information indique la valeurs de la barre en cours et la valeur précédente ( en mode "COMPLET").
Les autres modes possibles pour visualiser la table et/ou l'étiquette, permettent une vue plus synthétique des informations (modes "CONDENSÉ" et "MINIMAL").
Afin de ne pas trop surcharger la vision du graphique, la boite de visualisation du RANGE DONCHIAN, les lignes verticales des marques décalées de l'ICHIMOKU, ainsi que les boites de l'indicateur HHLL Boxes ne sont visualisées que de manière intermittente (géré par une temporisation réglable ).
Le paramètre de configuration "HISTORICAL INFO READING" réglé sur zéro (par défaut) permet de lire toutes les informations de la barre actuelle en cours (Barre #0).
Toutes autres valeurs permet de lire les informations d'une barre historique. La valeur 1 permet de lire les informations de la barre précédant la barre en cours (-1).
La valeur 10 permet de lire les information de la dixième barre en arrière (-10) par rapport à la barre en cours, etc.
Dans le bas de la table et de l'étiquette de DATAS, des voyants, rouge, vert ou blanc indique de manière rapide la synthèse de la tendance issue des différents indicateurs.
Chaque voyant représente le nombre d'indicateur ayant la même tendance à un instant donné. Vert pour une tendance Bullish, rouge pour une tendance Bearish et blanc pour une tendance neutre.
Les conditions pour déterminer une tendance sont pour chaque indicateur :
SUPERTREND ICHIMOHU + DMI : les 2 Super trends sont ensemble soit bullish soit Bearish. Sinon le signal est neutre.
DMI : 2 conditions principales :
BULLISH si DI+ >= DI- et ADX >25.
BEARISH si DI+ < DI- et ADX >25.
NEUTRE si les 2 conditions ne sont pas remplies.
ICHIMOKU : 3 conditions principales :
BULLISH si PRIX au dessus du nuage et TENKAN > KIJUN et NUAGE VERT DEVANT.
BEARISH si PRIX en dessous du nuage et TENKAN < KIJUN et NUAGE ROUGE DEVANT.
Les autres conditions complémentaires (Datas) complètent l'analyse et sont présents à titre informatif de la tendance et dépendent du contexte.
CANAL DONCHIAN : 1 condition principale :
BULLISH : le prix est passé au dessus de la ligne HIGH DC.
BEARISH : le prix est passé au dessous de la ligne LOW DC.
NEUTRE si le prix se situe entre les lignes HIGH DC et LOW DC
Les 2 autres conditions complémentaires (Datas) complètent l'analyse : HIGH DC et LOW DC sont croissants, descendants ou stables.
SUPERTREND HMA HULL :
Le script détermine plusieurs niveaux de tendance :
STRONG BUY, BUY, STRONG SELL, SELL ET NEUTRE.
VOLUME : 3 niveaux de tendance :
VOLUME > MOYENNE MOBILE, VOLUME < MOYENNE MOBILE, VOLUME = MOYENNE MOBILE.
PRIX : 3 niveaux de tendance :
PRIX > MOYENNE MOBILE, PRIX < MOYENNE MOBILE, PRIX = MOYENNE MOBILE.
Si vous utilisez cet indicateur/ stratégie et que vous êtes satisfait des résultats,
vous pouvez éventuellement me faire un don (un café, une pizza ou plus ...) via paypal à : lebourg.regis@free.fr.
Merci d'avance !!!
Ayez de bons Trades gagnants.

Trend FilterTrend Filter
Summary
Trend Filter is a multi-factor trend-confidence indicator that produces a simple, actionable output: Direction (Up / Down / Ranging) and a normalized Confidence %. It is intended as a decision-support overlay to help traders quickly identify whether a market is trending or rangebound, and how strong that directional bias is.
What it shows
A single line in the on-chart table: Direction (Up / Down / Ranging).
A Confidence % (0–100) that combines multiple normalized market signals into a single score.
Optional notification row when a manually-selected reference timeframe does not match the chart timeframe.
Alert conditions when direction changes to Up, Down, or Ranging.
How the indicator works (concise, non-proprietary explanation)
Trend Filter computes a weighted confidence score from several complementary components, each normalized to a 0–100 scale and combined into a single confidence value. The components and their roles are:
EMA structure & spread (trend breadth)
-Uses three EMAs (fast / mid / slow) computed at lengths that scale with the selected/reference timeframe. The EMA spread (fast vs slow) quantifies directional separation.
HH/HL structure and streaks (price structure)
-Counts higher highs/higher lows (and the reverse) across a scaled lookback to measure whether price structure is predominantly bullish, bearish or mixed.
EMA slope (momentum of trend)
-A robust slope approximation (smoothed) measures whether the short EMA is rising/falling relative to its own smoothed history.
ADX / DMI (trend strength)
-Uses a standard ADX-style component to capture directional persistence and dampen the confidence score when the ADX is weak.
ATR (volatility context)
-ATR expressed as a percentage of price helps detect abnormal volatility regimes which affect the validity of trend signals.
Volume context
-Simple volume vs a short SMA gives a participation signal that increases confidence when moves occur with higher volume.
Each component is capped to avoid outsized influence. Components are scaled by a set of weights (configurable in code) and then combined. The final confidence is lightly smoothed before being used to determine direction and to feed alert conditions.
Important implementation & safety design choices (why it’s not a simple mashup)
Adaptive timeframe scaling: EMA lengths and lookbacks are proportionally scaled based on the chosen reference timeframe (Auto or manual). This preserves relative indicator behavior across 1-minute → Daily timeframes without manual retuning of each parameter.
HH/HL structure plus streaks: Instead of relying solely on moving averages or ADX, the script explicitly measures price structure (HH/HL counts and streaks) and blends that with slope/ADX. This reduces false trending signals on noisy price action.
Normalized, weighted combination with caps: Each component is normalized (0–100) and combined by predefined weights; cap thresholds prevent extreme component values from dominating the result. This is a design intended to produce interpretable confidence % rather than opaque binary outputs.
History and loop safety: The code enforces a cap and protects loop lengths against available historical bars to avoid runtime errors and to ensure the script remains stable on short data series.
Practical guardrails: The script includes notification behavior to highlight manual timeframe mismatches and avoids dynamic indexing patterns that can cause unreliable results on small bar histories.
These design decisions — adaptive scaling, structural HH/HL scoring, capped normalization and explicit safety limits — are the elements that distinguish Trend Filter from simple, single-indicator overlays (EMA-only, ADX-only, etc.) and form the basis for why closed-source protection is reasonable for commercial/invite-only publication.
User controls & recommended usage
Reference Timeframe: Auto (uses chart TF) or choose a manual reference TF (1min → D). When manual TF is selected, the table shows a mismatch warning if the chart TF differs.
Table placement & colors: Positioning and appearance of the on-chart table are configurable.
Confidence thresholds: The indicator uses internal thresholds to mark high/medium/low confidence. Users can interpret the Confidence % relative to those ranges.
Alerts: Built-in alerts fire only on direction changes (to Up, Down, or Ranging). Use alerts as a signal to review the chart rather than an instruction to trade automatically.
How traders typically use it
Add Trend Filter as an overlay to your chart.
Confirm that the recommended reference timeframe is appropriate (Auto will adjust automatically).
Use Direction and Confidence % together: high Confidence + Up (or Down) suggests staying with trend; Ranging suggests avoiding trend-following entries.
Combine this filter with your entry/exit rules (price structure, support/resistance, or your preferred signal generator).
Disclaimers & limitations
This is a decision-support indicator, not an automated execution strategy. It does not place orders and does not provide P/L or backtesting statistics.
Confidence % is an aggregated measure — treat it as context, not a guarantee.
Results vary across symbols and timeframes; use appropriate position sizing and risk controls.
The code intentionally includes history and loop safeguards; on very short histories the indicator may display conservative results.

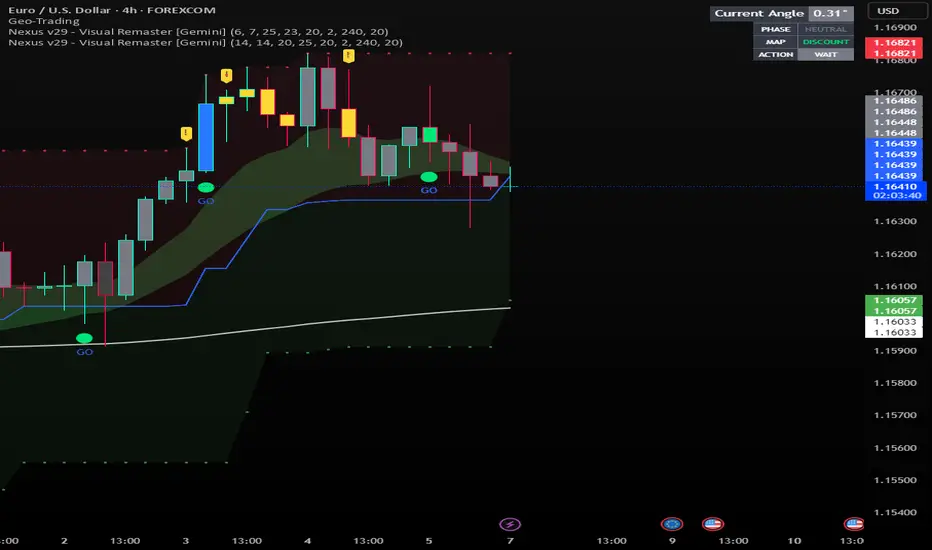
Nexus v29 - Visual Remaster- The Unified Physics EngineTitle: Nexus v29 - Visual Remaster :The Unified Physics Engine
Description:
The Physics of Price Movement
Most indicators fail because they look at only one dimension of the market. They might show you price direction (RSI) or activity (Volume), but they rarely tell you if the move has actual power behind it.
Nexus v29 is built on a "Unified Physics" philosophy. Just as an object in the physical world needs Mass, Acceleration, and Energy to move effectively, a price trend needs Volume, Force, and Trend Strength to sustain a run.
This indicator visualizes the "Life Cycle" of a trend, filtering out the noise (churn) to highlight only the high-probability explosion points where physics aligns in your favor.
How It Works: The 3 Components
1. The Energy (ADX Filter)
The White Line: This is your master switch. It measures the total energy in the system.
The Logic: When the white line is below the threshold (25), the market is in a "Dead Zone." No matter how good the candle looks, there is no kinetic energy to sustain a move. We stay flat.
The Signal: When the line crosses above 25, the engine is on.
2. The Mass (Volume Fuel)
The Background Bars: These represent the market participation.
Grey Bars: Wasted fuel. High volume in a low-energy market is just churn/absorption.
Silver/Blue Bars: Active fuel. Volume that is successfully converting into price movement.
3. The Vector (Force Histogram)
The Colored Bars: This represents the immediate directional force (Momentum).
Lime Green: Explosion. Price is pushing up, Volume is supporting it, and ADX confirms the energy. This is a valid Long environment.
Red: Crash. Price is pushing down with supported volume and high energy. This is a valid Short environment.
Orange/Maroon: Fakeout/Churn. Divergences where price and volume disagree.
The "Equation" Strategy
This script is not just a visualizer; it implements a strict "Physics Equation" to filter trades. A signal is only valid if ALL of the following conditions are met simultaneously:
Trend Alignment: Price must be on the correct side of the 200 SMA (Long > 200, Short < 200).
Volatility Gate: The market must be expanding (ATR > Baseline).
Force Threshold: The momentum impulse must be significant (Force Histogram > 100), ensuring we are catching a runaway train, not a bicycle.
Active Energy: ADX must be > 25.
How to Trade It
Entry: Wait for a Lime Green (Long) or Red (Short) bar that breaks out while the White Line (ADX) is rising. This confirms "Unified Physics"—Mass, Force, and Energy are all aligned.
The Lifecycle Exit: Do not wait for the trend to reverse. Exit when the "physics" break.
Look for the Force Histogram bars to start shrinking for 2 consecutive candles. This indicates momentum is fading (deceleration).
Exit immediately on the close of the second shrinking bar to capture the bulk of the impulsive move (The "Meat" of the trade) before the inevitable pullback.
Indicator Settings
RSI Length: Standard 14 (The Speed).
Volume Lookback: 100 (For relative scaling).
ADX Threshold: 25 (The "Go/No-Go" Line).
Trend Filter: 200 Period SMA.
Disclaimer: Trading involves high risk. This tool helps visualize market conditions based on historical physics but does not guarantee future performance. Always use proper risk management.
MNQ Momentum Suite – Intraday Confluence Dashboard (1-5M)MNQ Momentum Suite is a multi-factor intraday momentum dashboard designed primarily for MNQ / NQ on the 1M–5M timeframes during the New York session.
Instead of staring at 3–4 separate indicators, this script combines them into one clean pane
DMI / ADX → who’s in control (+DI vs –DI) and how strong the move is
Momentum MA Slope (T3 or EMA) → directional bias and trend quality
Squeeze Logic (BB vs Keltner) → volatility compression & expansion zones
Composite Momentum Score (–4 to +4) → single number capturing total confluence
Color-coded Dashboard Table → instant Bull / Bear / Flat status for each component
Core Components
1️⃣ Composite Momentum (Main Histogram)
Score range : –4 to +4
Built from 4 building blocks :
DMI direction (Bull/Bear)
ADX strength above threshold
MA slope direction (up/down)
Squeeze direction (after it fires)
Interpretation:
+3 / +4 → strong bullish confluence
+1 / +2 → mild bullish bias
0 → mixed / no edge
–1 / –2 → mild bearish bias
–3 / –4 → strong bearish confluence
2️⃣ DMI / ADX Block
Uses ta.dmi() under the hood.
DI spread histogram (teal/orange) shows which side is in control.
White ADX line measures trend strength – higher = cleaner moves, low = chop.
3️⃣ Momentum MA Slope (T3 / EMA)
User can choose T3 or EMA for the slope engine.
Slope histogram color:
Aqua → MA sloping up (bull-friendly)
Fuchsia → MA sloping down (bear-friendly)
4️⃣ Squeeze (BB vs Keltner)
Yellow dots mark when Bollinger Bands are inside Keltner Channels (volatility squeeze).
When the squeeze releases and price closes on one side of both BB basis and Keltner basis, the script flags a bullish or bearish squeeze fire that feeds the composite score.
Dashboard Table (Top-Right) : The table gives a fast, text-based read of the environment:
DMI Dir – Bull / Bear / Flat
ADX – Numeric trend strength
Slope – Up / Down / Flat based on chosen MA
Squeeze – Building / Fired Up / Fired Down / Idle
Row text is color-coded:
Green when that metric is bull-friendly
Red when it is bear-friendly
Gray/white when neutral
This makes it very easy to glance at the table and see if the environment is mostly green (long-friendly) or mostly red (short-friendly).
Session & Histogram Controls
Use NY Session Filter?
When enabled, all logic is focused on the defined NY session (default 09:30–16:00 exchange time).
how Histograms Only in NY Session?
true → plots only during the NY session (good for live trading focus).
false → plots on all bars, including overnight, so you can study past days and pre-/post-market behavior.
Alerts
Two built-in alert conditions are provided:
Strong Bull Momentum – Composite ≥ 3 during the session.
Strong Bear Momentum – Composite ≤ –3 during the session.
Use these as “heads-up” momentum pings, then confirm with your own price-action, VWAP, HTF levels, and liquidity zones.
Recommended Use
Primary instruments: MNQ / NQ futures, but it can be applied to any intraday symbol.
Primary timeframes: 1M to 5M.
Designed as a confluence and filter tool, not a stand-alone entry system.
Works especially well combined with:
VWAP
10 EMA
Pre-NY and RTH highs/lows
FVG/IFVG and liquidity zones
As with any tool, this is not financial advice and does not guarantee results. Always combine with risk management and your own playbook.

ZENADX Momentum FlowZENADX Momentum Flow คืออินดิเคเตอร์ที่ออกแบบมาเพื่อช่วยเทรดเดอร์จับ “ทิศทาง + จังหวะ” ของตลาดด้วยความเรียบง่ายแบบเซน แต่ทรงพลังด้วยแกนวิเคราะห์จาก ADX, DI และ Stochastic Momentum
อินดิเคเตอร์นี้ผสมผสาน โครงสร้างเทรนด์ (Trend Structure) ด้วย ADX/DI และ โมเมนตัม (Momentum Timing) ด้วย Stochastic เพื่อค้นหาจุดเข้าออกที่ “นิ่ง คม และมีสติ” ตามหลัก Zen Flow Trading
สิ่งที่ ZENADX Momentum Flow ทำให้คุณ:
1.จับเทรนด์หลักด้วย ADX ที่ผ่านเกณฑ์ความแข็งแรง
2.ฟิลเตอร์จังหวะด้วย Stochastic เพื่อหลีกเลี่ยงสัญญาณหลอก
3.แสดงสัญญาณ BUY/SELL เฉพาะเมื่อน้ำหนักเทรนด์ + โมเมนตัมสอดคล้องกัน
เหมาะทั้งสาย Trend Following และ Swing Entry ที่ต้องการ Flow ที่เป็นระบบ
เหมาะกับใคร?
สายเทรนด์, เทรดเดอร์แบบ Flow, คนที่ชอบระบบที่เรียบง่ายแต่ให้ “ความมั่นใจ” เวลาเข้าออก
หลักการ Zen:
ไม่ใช่แค่การตามเทรนด์… แต่คือการ ไหลไปตามตลาด อย่างมีสติและไม่ฝืนตลาด
-------------------------------------------------------------------------
ZENADX Momentum Flow is a trend–momentum hybrid indicator designed for traders who want clarity, simplicity, and precision. Inspired by Zen principles, this tool helps you align with the market’s natural flow—without noise or over-complication.
This indicator blends trend strength from ADX/DI with momentum confirmation from Stochastic, producing clean BUY/SELL signals only when both market structure and momentum agree.
What ZENADX Momentum Flow provides:
Detects strong trend directions using ADX threshold logic
Filters noise with Stochastic momentum alignment
Generates precise BUY/SELL signals based on DI crossovers + momentum confirmation
Ideal for Trend Following and Swing Entry traders who want a smooth, systematic flow
Perfect for:
Traders who seek a calm, disciplined, and structured way to follow the market’s movement—without forcing trades.
Zen Philosophy:
You don’t fight the trend…
You flow with it.

APEX TREND: Macro & Hard Stop SystemAPEX TREND: Macro & Hard Stop System
The APEX TREND System is a composite trend-following strategy engineered to solve the "Whipsaw" problem inherent in standard breakout systems. It orchestrates four distinct technical theories—Macro Trend Filtering, Volatility Squeeze, Momentum, and Volatility Stop-Loss—into a single, hierarchical decision-making engine.
This script is not merely a collection of indicators; it is a rules-based trading system designed for Swing Traders (Day/Week timeframes) who aim to capture major trend extensions while strictly managing downside risk through a "Hard Stop" mechanism.
🧠 Underlying Concepts & Originality
Many trend indicators fail because they treat all price movements equally. The APEX TREND differentiates itself by applying an "Institutional Filter" logic derived from classic Dow Theory and Modern Volatility Analysis.
1. The Macro Hard Stop (The 200 EMA Logic)
Origin: Based on the institutional mandate that “Nothing good happens below the 200-day moving average.”
Function: Unlike standard super trends that flip constantly in sideways markets, this system integrates a 200-period Exponential Moving Average (EMA) as a non-negotiable "Hard Stop."
Synergy: This acts as the primary gatekeeper. Even if the volatility engine signals a "Buy," the system suppresses the signal if the price is below the Macro Baseline, effectively filtering out counter-trend traps.
2. The Volatility Engine (Squeeze Theory)
Origin: Derived from John Carter’s TTM Squeeze concept.
Function: The script identifies periods where Bollinger Bands (Standard Deviation) contract inside Keltner Channels (ATR). This indicates a period of potential energy build-up.
Synergy: The system only triggers an entry when this energy is released (Breakout) AND coincides with Linear Regression Momentum, ensuring the breakout is genuine.
3. Anti-Chop Filter (ADX Integration)
Origin: J. Welles Wilder’s Directional Movement Theory.
Function: A common failure point for trend systems is low-volatility chop. This script utilizes the Average Directional Index (ADX).
Synergy: If the ADX is below the threshold (Default: 20), the market is deemed "Choppy." The script visually represents this by painting candles GRAY, signaling a "No-Trade Zone" regardless of price action.
4. The "Run Trend" Stop Loss (Factor 4.0 ATR)
Origin: Adapted from the Turtle Trading rules regarding volatility-based stops.
Function: Standard Trailing Stops (usually Factor 3.0) are too tight for crypto or volatile equities on daily timeframes.
Optimization: This system employs a wider ATR Multiplier of 4.0. This allows the asset to fluctuate naturally within a trend without triggering a premature exit, maximizing the "Run Trend" potential.
🛠 How It Works (The Algorithm)
The script processes data in a specific order to generate a signal:
Check Macro Trend: Is Price > EMA 200? (If No, Longs are disabled).
Check Volatility: Is ADX > 20? (If No, all signals are disabled).
Check Volume: Is Current Volume > 1.2x Average Volume? (Confirmation of institutional participation).
Trigger: Has a Volatility Breakout occurred in the direction of the Macro Trend?
Execution: If ALL above are true -> Generate Signal.
🎯 Strategy Guide
1. Long Setup (Bullish)
Signal: Look for the Green "APEX LONG" Label.
Condition: The price must be ABOVE the White Line (EMA 200).
Execution: Enter at the close of the signal candle.
Stop Loss: Initial stop at the Green Trailing Line.
2. Short Setup (Bearish)
Signal: Look for the Red "APEX SHORT" Label.
Condition: The price must be BELOW the White Line (EMA 200).
Execution: Enter at the close of the signal candle.
Stop Loss: Initial stop at the Red Trailing Line.
3. Exit Rules (Crucial)
This system employs a Dual-Exit Mechanism:
Soft Exit (Profit Taking): Close the position if the price crosses the Trailing Stop Line (Green/Red line). This locks in profits during a trend reversal.
Hard Exit (Emergency): Close the position IMMEDIATELY if the price crosses the White EMA 200 Line against your trade. This prevents holding a position during a major market regime change.
⚙️ Settings
Momentum Engine: Adjust Bollinger Band/Keltner Channel lengths to tune breakout sensitivity.
Apex Filters: Toggle the EMA 200 or ADX filters on/off to adapt to different asset classes.
Risk Management: The ATR Multiplier (Default 4.0) controls the width of the trailing stop. Lower values = Tighter stops (Scalping); Higher values = Looser stops (Swing).
Disclaimer: This script is designed for trend-following on higher timeframes (4H, 1D, 1W). Please backtest on your specific asset before live trading.

Smart Adaptive Double Patterns [The_lurker]Smart Adaptive Double Patterns
This is an advanced technical indicator that combines two of the strongest and most renowned classical price reversal patterns:
✅ Double Bottom Pattern — a bullish reversal pattern that forms after a downtrend
✅ Double Top Pattern — a bearish reversal pattern that forms after an uptrend
The indicator does not merely detect patterns — it provides a fully integrated, intelligent system that includes:
✅ Precise quality scoring for each pattern using 5 technical criteria
✅ Automatic price target calculation at three levels (Conservative, Balanced, Aggressive)
✅ Multi-layer dynamic filtering to avoid false signals
✅ Live pattern tracking from formation to target achievement or failure
✅ Comprehensive alert system covering all possible trading scenarios
🎯 Why Is This Indicator Unique?
1️⃣ High Detection Accuracy
Unlike traditional indicators that rely on simple rules, this one applies 5 strict structural conditions to confirm pattern validity:
A clear trend must precede the pattern
High symmetry between the two bottoms or two tops
No break of critical price levels during formation
Logical spacing between key points
Technical confirmation from ADX, ATR, and Volume
2️⃣ Advanced Quality Scoring System
Each pattern is scored out of 100 based on 5 weighted criteria:
Symmetry (30%): How closely the two bottoms or tops match
Trend Strength (20%): Strength of the prior trend
Volume Behavior (20%): Trading activity at critical points
Pattern Depth (15%): Vertical distance between neckline and bottom/top
Structural Integrity (15%): Full compliance with structural rules
3️⃣ Smart Target Management
Separate targets for bullish (Double Bottom) and bearish (Double Top) patterns
Separate projections for success and failure cases
Multiple options: Conservative (0.618) / Balanced (1.0) / Aggressive (1.618)
Live tracking with dynamic moving lines
4️⃣ Professional Failure Handling
Failed patterns are not ignored — they are turned into counter-trend opportunities:
Failed Double Bottom → triggers a bearish signal with downside targets
Failed Double Top → triggers a bullish signal with upside targets
Automatic color change for clear visual distinction
5️⃣ Full Customization Flexibility
Enable/disable each pattern independently
22+ adjustable settings
Unique colors for each pattern and quality level
Full bilingual support (Arabic / English)
📐 Pattern Details
🟦 Double Bottom Pattern
Sequence of points:
🔹 Point 1: Peak marking the start of a strong downtrend
🔹 Point 2 (Bottom 1): First low — first key bounce
🔹 Point 3: Intermediate high — forms the neckline (resistance)
🔹 Point 4 (Bottom 2): Second low — should closely match Bottom 1
🔹 Point 5: Breakout point — pattern confirmation
Mandatory Conditions:
✅ Clear downtrend before Point 2
✅ Bottoms 2 & 4 nearly identical (≤1.5% difference by default)
✅ Point 3 higher than both bottoms
✅ Neither bottom is broken during formation
✅ Sufficient time between points (≥10 candles by default)
✅ Success Scenario
→ Price breaks above the neckline (Point 3)
→ Point 5 is plotted at breakout candle
→ Dashed vertical line drawn from Point 5 to target
→ Horizontal dashed line tracks price toward target
→ Dashboard shows: Pattern Type | Quality | Rating | Target | Status
→ When target hits: line turns green + ✅ appears
🎯 Target Calculation
Pattern Height = Point 3 − Point 4
• Conservative: Point 3 + (Height × 0.618 × Quality Factor)
• Balanced: Point 3 + (Height × 1.0 × Quality Factor)
• Aggressive: Point 3 + (Height × 1.618 × Quality Factor)
❌ Failure Scenario
→ Price breaks below both Bottom 1 or Bottom 2 before neckline breakout
Visual Changes:
All lines turn red
Red ✖ appears at breakdown candle
Neckline stops expanding
Red dashed vertical line from breakdown point to bearish target
Red horizontal tracking line follows price
Dashboard updates to:
⚠ Failed Bottom – Bearish
→ Shows new bearish target
→ Indicates target mode for failure case
→ Status: Bearish Reversal
→ Fully red display
🟥 Double Top Pattern
Sequence of points:
🔹 Point 1: Trough marking the start of a strong uptrend
🔹 Point 2 (Top 1): First peak — first key resistance
🔹 Point 3: Intermediate low — forms the neckline (support)
🔹 Point 4 (Top 2): Second peak — should closely match Top 1
🔹 Point 5: Breakdown point — pattern confirmation
Mandatory Conditions:
✅ Clear uptrend before Point 2
✅ Tops 2 & 4 nearly identical (≤1.5% difference by default)
✅ Point 3 lower than both tops
✅ Neither top is breached during formation
✅ Sufficient time between points (≥10 candles by default)
✅ Success Scenario
→ Price breaks below the neckline (Point 3)
→ Point 5 is plotted at breakdown candle
→ Dashed vertical line drawn to target
→ Horizontal tracking line moves with price
→ Dashboard updates accordingly
→ Green line + ✅ on hit
🎯 Target Calculation
Pattern Height = Point 4 − Point 3
• Conservative: Point 3 − (Height × 0.618 × Quality Factor)
• Balanced: Point 3 − (Height × 1.0 × Quality Factor)
• Aggressive: Point 3 − (Height × 1.618 × Quality Factor)
❌ Failure Scenario
→ Price breaks above either Top 1 or Top 2 before neckline breakdown
Visual Changes:
All lines turn cyan (light blue)
Cyan ✖ appears at breakout candle
Neckline stops expanding
Cyan dashed vertical line to bullish target
Cyan horizontal tracking line follows price
Dashboard updates to:
⚠ Failed Top – Bullish
→ Shows new bullish target
→ Indicates target mode for failure case
→ Status: Bullish Reversal
→ Fully cyan display
🎯 Upside Target (after Double Top failure)
Max Top = max(Point 2, Point 4)
Height = Max Top − Point 3
• Conservative: Max Top + (Height × 0.618)
• Balanced: Max Top + (Height × 1.0)
• Aggressive: Max Top + (Height × 1.618)
📊 Quality Scoring System (0–100)
1️⃣ Symmetry (30%)
Measures price match between the two bottoms or two tops.
High score (25–30): Near-perfect symmetry → very strong pattern
Medium (15–24): Good match → reliable signal
Low (5–14): Weak symmetry → use caution
Zero: No symmetry → invalid pattern
2️⃣ Trend Strength (20%)
Uses ADX and DI indicators.
20 pts: Strong trend confirmed (e.g., ADX ≥ 20 + correct DI alignment)
10 pts: Trend filter disabled
6 pts: Weak or sideways trend
3️⃣ Volume Behavior (20%)
Declining volume on second touch is a positive sign (shows exhaustion).
15–20 pts: Clear volume drop → strong signal
10 pts: Neutral volume
6 pts: Rising volume → higher risk of continuation
4️⃣ Pattern Depth (15%)
Deeper patterns = stronger reversals.
12–15 pts: Deep → high reversal power
8–11 pts: Medium → acceptable
<8 pts: Shallow → weak signal
5️⃣ Structural Integrity (15%)
Checks logical structure (e.g., Point 1 > Point 3 in Double Bottom).
12–15 pts: Ideal structure
8–11 pts: Minor flaws
<8 pts: Poor setup
📈 Final Quality Rating & Colors
• 85–100 → ⭐ Excellent
→ Double Bottom: Cyan #00BCD4
→ Double Top: Light Red #FF5252
• 75–84 → ✨ Very Good
• 65–74 → ✓ Good
• 60–64 → ○ Acceptable
→ All use Amber #FFC107
• <60 → ❌ Rejected (not shown)
→ Gray #9E9E9E
🔧 Dynamic Filters
1️⃣ ATR Filter (Volatility Check)
Rejects patterns in abnormally high volatility periods.
→ If current ATR > 1.8 × 50-period ATR MA → pattern rejected
✅ Recommended for crypto, small caps
❌ Optional for calm markets (gold, bonds)
2️⃣ ADX Filter (Trend Confirmation)
Ensures a real trend exists before the pattern.
→ If ADX < 14 (70% of default 20) → pattern rejected
✅ Strongly recommended (keep ON)
3️⃣ Volume Filter (Behavior Validation)
Not used to reject patterns, but strongly affects quality score.
✅ Best for liquid markets (Forex majors, large stocks)
❌ Optional for illiquid assets
⚙️ Key Settings Explained
🔘 General Settings
• Language: Arabic / English
• Show Previous Patterns: Yes / No
→ “No” keeps chart clean; “Yes” for historical review
🔘 Pattern Selection
• Enable Double Bottom: ✅ / ❌
• Enable Double Top: ✅ / ❌
→ Use combinations:
✅✅ → Full reversal scanning
✅❌ → Long setups only
❌✅ → Short setups only
❌❌ → Indicator OFF
🔘 Detection Parameters
• Pivots Left (1–20): Higher = more reliable, fewer patterns
• Pivots Right (1–20): Lower = faster signals
• Min Width (5–100): Min candles between Bottom/Top 1 & 2
• Tolerance % (0.1%–5%): Max allowed price difference
• Min Arm (5–50): Min candles between pivot & neckline
• Min Trend (5–50): Min candles in prior trend
• Trend Lookback (50–500): How far back to detect trend start
• Extension Multiplier (1.0–5.0): How long to wait for breakout
🔘 Quality Settings
• Min Quality Score (0–100):
→ Conservative: 75–85
→ Balanced: 60–70
→ Flexible: 50–55
• Custom Weights: Adjust based on market (e.g., increase Volume weight in Forex)
🔘 Target Settings
• Bottom Bullish Target: Conservative / Balanced / Aggressive
• Bottom Bearish Target: (used on failure)
• Top Bearish Target: Conservative / Balanced / Aggressive
• Top Bullish Target: (used on failure)
🔘 Visual Settings
• Label Size: Small / Normal / Large / Huge
• Pattern Colors: Fully customizable
• Table: Show/Hide + Size (Small/Normal/Large) + Position (Top-Right / Top-Left / Bottom-Right / Bottom-Left)
• Fill Transparency: 70%–95% (default: 85%)
🔔 Alert System (8 Independent Alerts)
📌 Double Bottom Alerts
Bullish Breakout → “Double Bottom Breakout – Bullish!”
Bullish Target Hit → “Bullish Target Achieved!”
Failure (Bearish) → “Double Bottom Failed – Bearish!”
Bearish Target Hit → “Bearish Target Achieved (Failure)!”
📌 Double Top Alerts
Bearish Breakdown → “Double Top Breakdown – Bearish!”
Bearish Target Hit → “Bearish Target Achieved!”
Failure (Bullish) → “Double Top Failed – Bullish!”
Bullish Target Hit → “Bullish Target Achieved (Failure)!”
Each alert can be enabled/disabled independently and supports pop-ups, emails, or webhooks.
⚠️ Disclaimer:
This indicator is for educational and analytical purposes only. It does not constitute financial, investment, or trading advice. Use it in conjunction with your own strategy and risk management. Neither TradingView nor the developer is liable for any financial decisions or losses.

DarkPool's Gann High Low Activator DarkPool's Gann High-Low Activator.
It enhances the traditional trend-following logic by integrating Heikin Ashi smoothing, Multi-Timeframe (MTF) analysis, and volatility filtering. It is designed to filter out market noise and provide clearer trend signals during volatile conditions.
Underlying Concepts
Heikin Ashi Smoothing: Standard price candles can produce erratic signals due to wicks and short-term volatility. This script includes a "Calculation Mode" setting that allows the Gann logic to run on Heikin Ashi average prices. This smoothes out price data, helping traders stay in trends longer by ignoring temporary pullbacks.
Gann High-Low Logic: The core algorithm tracks the Simple Moving Average (SMA) of Highs and Lows over a user-defined period.
Bullish Trend: Price closes above the trailing SMA of Highs.
Bearish Trend: Price closes below the trailing SMA of Lows.
Volatility & Trend Filtering: To reduce false signals during sideways markets, this tool employs two filters:
ADX Filter (Choppiness): Uses the Average Directional Index to detect low-volatility environments. If the ADX is below the defined threshold (default 20), the indicator identifies the market as "choppy" and suppresses signals to preserve capital.
EMA Filter (Baseline): An optional Exponential Moving Average filter ensures trades are only taken in the direction of the longer-term trend (e.g., Longs only above the 200 EMA).
Features
Dual Calculation Modes: Switch between Standard price logic and Heikin Ashi smoothing logic.
Multi-Timeframe (MTF): Calculate the trend based on a higher timeframe (e.g., 4-Hour) while viewing a lower timeframe chart (e.g., 15-Minute).
Automated JSON Alerts: Generates machine-readable JSON alert payloads compatible with external trading bots and webhooks.
Live Dashboard: A data table displaying the current Trend State, Calculation Mode, ADX Value, and risk percentage.
How to Use
Buy Signal: Generated when the trend flips Bullish, provided the ADX indicates sufficient momentum and the price satisfies the EMA filter (if enabled).
Sell Signal: Generated when the trend flips Bearish, subject to the same momentum and trend filters.
Neutral State (Gray Cloud): When the cloud fill turns gray, the market is in consolidation. It is recommended to avoid entering new positions during this state.
Trailing Stop: The Gann Line serves as a dynamic trailing stop-loss level. A close beyond this line invalidates the current trend.
Settings Configuration
Calculation Mode: Select "Standard" for raw price action or "Heikin Ashi" for smoothed trend following.
Gann Length: Lower values (3-5) are suitable for short-term scalping; higher values (10+) are better for swing trading.
MTF Mode: Enable to lock the calculation to a specific higher timeframe.
ADX Threshold: Adjust based on asset volatility. Recommended: 20-25 for Crypto, 15-20 for Forex/Indices.
Disclaimer
This source code and the information presented here are for educational purposes only. This script does not constitute financial advice, trading recommendations, or a solicitation to buy or sell any financial instruments. Trading in financial markets involves a high degree of risk and may not be suitable for all investors. Past performance is not indicative of future results. The author assumes no responsibility for any losses incurred while using this indicator. Use this tool at your own discretion and risk.

Smart Trend Signals# Smart Trend Signals - Universal Adaptive Trend Indicator
## 🌟 Professional-Grade Trend Detection for All Markets
Smart Trend Signals is an advanced technical analysis tool that combines proven methodologies into one powerful, easy-to-use indicator. Whether you trade stocks, forex, crypto, or futures, this indicator adapts to your market with intelligent trend detection and noise reduction technology.
### 🧠 HOW IT WORKS: CORE TECHNOLOGY
This indicator uses a proprietary **Multi-Layer Confirmation System** to ensure signals align with Trend Direction, Volatility, and Momentum.
* **Adaptive Volatility Trail (TrendBand):** Acts as a dynamic support/resistance that adjusts to real-time volatility (ATR) and momentum. Signals only fire when price closes conclusively outside this trail.
* **SFI Noise Reduction Engine:** A proprietary filter that eliminates market "noise" and small fluctuations, ensuring signals reflect true price action.
* **6-Layer Entry Confluence:** Every signal is validated across a strict, six-layer filtering sequence:
1. **TrendBand Alignment** - Core trend direction
2. **SMA Confirmation** - Medium-term trend validation
3. **ADX Strength Filter** - Trend momentum measurement
4. **Pivot Proximity Protection** - Avoids reversal zones near recent structure
5. **Anti-Whip Confirmation** - Reduces false signals in choppy markets
6. **Volume Confirmation** - Validation of institutional activity
### ⚙️ COMPREHENSIVE PARAMETER GUIDE
#### 🎯 TREND & MOMENTUM (ADX)
- **Align Signals with TrendBand**: When enabled, filters signals to appear only in the direction of the main TrendBand.
- **SMA Confirmation Length**: Sets the smoothing period for trend confirmation (15 = medium-term).
- **ADX Length**: Adjusts the sensitivity of the ADX trend strength measurement (10 = balanced).
- **ADX Threshold (25)**: **(Use $\ge 25$ for clear trends; set to $0$ to disable filtering out weak/sideways markets.)**
#### 🔧 SFI NOISE REDUCTION ENGINE (SFI CORE)
- **Sensitivity (3.0)**: **(Controls the threshold for noise reduction. Use lower values for high-frequency scalping; higher values for swing trades.)**
- **TrendBand ATR Length** (10): Volatility measurement period for the adaptive bands.
- **TrendBand Multiplier** (3.0): Band width adjustment to fit different market volatility regimes.
#### 🛡️ RISK MANAGEMENT (ATR Multiples)
- **TP Multiplier (2.0)**: **(Take Profit distance in ATR multiples.
- **SL Multiplier (1.5)**: **(Stop Loss distance in ATR multiples, adapting to current market volatility.)**
- **Use Stop Loss**: Enables/disables TP/SL visualization on the chart. *"disable by default"
- **Anti-Whip**: Enables the final confirmation logic to reduce signal flipping.
### ⚠️ IMPORTANT DISCLAIMER
**EDUCATIONAL PURPOSE ONLY**
This indicator is designed for technical analysis education and strategy development. It is NOT financial advice. The current default setting doesn't use stop loss. the stop loss will be the opposite of the signal. Example; if you see a BUY signal followed by a SELL signal, it means the trade is closed in loss. Highly recommended to use the stop loss.
**NO PERFORMANCE GUARANTEES**
- Past performance is not predictive of future results.
- Always test in simulation before live trading.
- You are responsible for parameter optimization, risk management, and final trading decisions.
ETH/USD using default setting without stop loss
ES1! using default settings without stop loss.
XAU/USD using default settings without stop loss.

Trend & Strength Detector TSDTrend Strength Detector (TSD)
*Objective Trend Quality Measurement for Educational Market Analysis*
Note: This mathematical framework is a proprietary quantitative model developed by Ario Pinelab, inspired by classical EMA, ADX, RSI and MACD principles, yet not documented in any public technical or academic publication.
## 🎯 Purpose & Design Philosophy
The ** Trend Strength Detector- TSD ** is an educational research tool that provides **quantitative measurement of trend quality** through two independent scoring systems (0-100 scale). It answers the analytical question: *"How strong and aligned is the current market trend environment?"*
This indicator is designed with a **modular, complementary approach** to work alongside various analysis methodologies, particularly pattern-based recognition systems.
## 🔗 Complementary Research Framework
### Designed to Work With Pattern Detection Systems
This indicator provides **environmental context measurement** that complements qualitative pattern recognition tools. It works particularly well alongside systems like:
- **RMBS Smart Detector - Multi-Factor Momentum System**
- Traditional chart pattern analyzers
- Any momentum-based pattern identification tools
🔍 **To find RMBS Smart Detector:**
- Search in TradingView Indicators Library: `" RMBS Smart Detector - Multi-Factor Momentum System"`
- Look for: *Multi-Factor Momentum System*
- By author: ` `
### Why This Complementary Approach?
**Trend Quality Measurement** (TSD - this tool) provides:
- ✅ Structural trend alignment (0-100 score)
- ✅ Momentum intensity levels (0-100 score)
- ✅ Environment classification (Strong/Moderate/Weak)
- 📌 **Answers:** *"HOW STRONG is the underlying trend environment?"*
### Educational Research Value
When used together in a research context, these tools enable systematic study of questions like:
- How do reversal patterns behave when Strength Score is above 70 vs below 30?
- Do continuation patterns in weakening environments (declining scores) show different characteristics?
- What is the correlation between high Alignment Scores and pattern "success rates"?
- Can environment classification help identify genuine trend initiation vs false starts?
⚠️ **Important Note:** Both tools are **independent and work standalone**. TSD provides value whether used alone or with other analysis methods. The relationship with RMBS (or any pattern tool) is **complementary for research purposes**, not dependent.
---
###Mathematical Foundation
##TSA Formula: scoring method developed by Ario
-Trend Model (0 – 100)
TAS = EMA Alignment (0–40) + Price Position (0–30) + Trend Consistency (0–30)
EMA Alignment checks EMA_fast vs EMA_slow vs EMA_trend structure.
Price Position evaluates if Close is above/below all EMAs.
Consistency = 3 × max(bullish,bearish bars within 10 candles).
-Strength Model (0 – 100)
Strength = ADX (0–50) + EMA Slope (0–25) + RSI (0–15) + MACD (0–10)
ADX measures trend energy; Slope shows EMA momentum %;
RSI assesses zone positioning; MACD confirms directional agreement.
Note: This formula represents a proprietary quantitative model by Ario_Pinelab, inspired by classical technical concepts but not published in any external reference.________________________________________
📊 Environment Classification
Based on Total Strength Score:
🟢 Strong Environment: Score ≥ 60
→ Well-defined momentum, clear directional bias
🟡 Moderate Environment: 40 ≤ Score < 60
→ Mixed signals, transitional conditions
🔴 Weak Environment: Score < 40
→ Ranging, choppy, low conviction movement
Color Coding:
• Green background: Strong (≥60)
• Yellow background: Moderate (40-59)
• Red background: Weak (<40)
________________________________________
📈 Visual Components
Main Chart Display
Score Labels (Top-Right Corner):
┌─────────────────────────────────┐
│ 📊 Alignment: 75 | Strength: 82 │
│ Environment: Strong 🟢 │
└─────────────────────────────────┘
Color-Coded Background:
• Environment strength visually indicated via background color
• Helps quick identification of market regime
• Customizable transparency (default: 90%)
Reference Lines:
• Dotted line at 60: Strong/Moderate threshold
• Dotted line at 40: Moderate/Weak threshold
• Mid-line at 50: Neutral reference
________________________________________
🔧 Customization Settings
Input Parameters
The best setting is the default mode.
🚫 Important Disclaimers & Limitations
What This Indicator IS:
✅ Educational measurement tool for trend quality research
✅ Quantitative assessment of current market environment
✅ Complementary analysis tool for pattern-based systems
✅ Historical data analyzer for systematic study
✅ Multi-factor scoring system based on technical calculations
What This Indicator IS NOT:
❌ NOT a trading system or signal generator
❌ NOT financial advice or trade recommendations
❌ NOT predictive of future price movements
❌ NOT a guarantee of pattern success/failure
❌ NOT a substitute for comprehensive risk management
________________________________________
Known Limitations
1. Lagging Nature:
⚠️ All components (EMA, ADX, RSI, MACD) are calculated
from historical price data
→ Scores reflect CURRENT and RECENT conditions
→ Cannot predict sudden reversals or black swan events
→ Trend measurements lag actual price turning points
2. Whipsaw Risk:
⚠️ In choppy/ranging markets, scores may fluctuate rapidly
→ Moderate zone (40-60) can see frequent transitions
→ Low timeframes more susceptible to noise
→ Consider higher timeframes for stable measurements
3. Component Conflicts:
⚠️ Individual components may disagree
→ Example: Strong ADX but weak RSI alignment
→ Scores average these conflicts (may hide nuance)
→ Check individual components for deeper insight
4. Not Predictive:
⚠️ High scores do NOT guarantee continuation
⚠️ Low scores do NOT guarantee reversal
→ Measurement ≠ Prediction
→ Use for CONTEXT, not SIGNALS
→ Combine with comprehensive analysis
________________________________________
Risk Acknowledgments
Market Risk:
• All trading involves substantial risk of loss
• Past performance (even systematic studies) does not guarantee future results
• No indicator, system, or methodology can eliminate market risk
Measurement Limitations:
• Scores are mathematical calculations, not market predictions
• Environmental classification is descriptive, not prescriptive
• Strong measurements can deteriorate rapidly without warning
Educational Purpose:
• This tool is designed for LEARNING about market structure
• Not designed, tested, or validated as a standalone trading system
• Any trading decisions are user’s sole responsibility
No Warranty:
• Indicator provided “as-is” for educational purposes
• No guarantee of accuracy, reliability, or profitability
• Users must verify calculations and apply critical thinking
Open Source
Full Pine Script code available for educational study and modification. Feedback and improvement suggestions welcome.
“All logic is presented for research and educational visualization.”
---

RMBS Smart Detector - Multi-Factor Momentum System v2# RMBS Smart Detector - Multi-Factor Momentum System
## Overview
RMBS (Smart Detector - Multi-Factor Momentum System) is a proprietary scoring method developed by Ario, combining normalized RSI and Bollinger band positioning into a single composite metric.
---
## Core Methodology
### Buy/Sell Logic
Marker (green or red )appear when **all four filters** pass:
**1. RMBS Score (Momentum Strength)**
From the formula Bellow
Combined Range: -10 (extreme bearish) to +10 (extreme bullish)
Signal Thresholds:
• BUY: Score > +3.0
• SELL: Score < -3.0
2. EMA Trend Filter
BUY: EMA(21) > EMA(55) → Uptrend confirmed
SELL: EMA(21) < EMA(55) → Downtrend confirmed
3. ADX Strength Filter
Minimum ADX: 25 (adjustable 20-30)
ADX > 25: Trending market → Signal allowed
ADX < 25: Range-bound → Signal blocked
4. Alternating Logic
Prevents signal spam by requiring alternation:
✓ BUY → SELL → BUY (allowed)
✗ BUY → BUY → BUY (blocked)
________________________________________
Mathematical Foundation
RMBS Formula: scoring method developed by Ario
RMBS = (RSI – 50) / 10 + ((BB_pos – 50) / 10)
where:
• RSI = Relative Strength Index (close, L)
• BB_pos = (Close – (SMA – 2 σ)) / ((SMA + 2 σ) – (SMA – 2 σ)) × 100
• σ = standard deviation of close over lookback L
• SMA = simple moving average of close over lookback L
• L = rmbs_length (period setting)
This produces a normalized composite score around zero:
• Positive → bullish momentum and upper band dominance
• Negative → bearish momentum and lower band pressure
• Near 0 → neutral or transitional zone
Input Parameters
ADX Threshold (default: 25)
• Lower (20-23): More signals, less filtering
• Higher (28-30): Fewer signals, stronger trends
• Recommended: 25 for balanced filtering
Signal Thresholds
• BUY: +3.0 (adjustable)
• SELL: -3.0 (adjustable)
Visual Options
• Marker colors
• Background highlights
• Alert settings
________________________________________
Usage Guidelines
How to Interpret
• 🟢 Green Marker: All conditions met for Bull condition
• 🔴 Red Marker: All conditions met for Bear condition
• No Marker: Waiting for confirmation
________________________________________
Important Disclaimers
⚠️ Educational Purpose Only
• This tool demonstrates multi-factor technical analysis concepts
• Not financial advice or trade recommendations
• No guarantee of profitability
⚠️ Known Limitations
• Less effective in ranging/choppy markets
• Requires proper risk management (stop-loss, position sizing)
• Should be combined with fundamental analysis
⚠️ Risk Warning
Trading involves substantial risk of loss. Past performance does not indicate future results. Always conduct your own research and consult professionals before trading.
________________________________________
Open Source
Full Pine Script code available for educational study and modification. Feedback and improvement suggestions welcome.
“All logic is presented for research and educational visualization.”

Golden Ladder – Louay Joha (Wave & Gann Hi/Lo + ATR R-Levels)Overview
Golden Ladder is a momentum-and-structure tool that detects three-bar ladder waves and filters them with a Gann Hi/Lo regime guide (SMA-based). When a valid wave aligns with the current Hi/Lo bias and passes optional market filters (ADX, RSI, and proximity to recent extremes), the script prints BUY/SELL n labels (n = wave index) and draws a complete Entry / SL / TP1–TP4 ladder using ATR-based risk units (R) or fixed caps—configured for clarity and consistency. The script also keeps the chart clean: the last trade remains fully drawn while historical groups are trimmed to compact “ENTRY-only” stubs.
Why these components together (originality)
Three-bar ladder captures short-term momentum structure (progressively higher highs/lows for buys; the reverse for sells).
Gann Hi/Lo (SMA of highs/lows with a directional state) acts as a regime filter, reducing counter-trend ladders.
ATR-based R ladder turns signals into an actionable plan: a volatility-aware SL and TP1–TP4 that scale across instruments/timeframes.
Smart Entry filters (ADX strength, RSI extremes, and distance from recent top/bottom using ATR buffers) seek to avoid low-quality, stretched entries.
Slim history keeps only a short ENTRY stub for prior groups, so the signal you just got is always the most readable.
This is not a mere mashup; each layer constrains the others to produce fewer, clearer setups.
How it works (high-level logic)
Regime (Gann Hi/Lo):
Compute SMA(high, HPeriod) and SMA(low, LPeriod).
Direction state HLv flips when the close crosses above/below its track; one unified Hi/Lo guide is plotted.
Ladder signal (structure + confirmation):
BUY ladder: three consecutive green bars with rising highs and rising lows and HLv == +1.
SELL ladder: mirror conditions with HLv == -1.
Signals evaluate intrabar and are controlled by Smart Entry filters (ADX/RSI/extreme checks).
Risk ladder (R-based or capped):
Default: risk = ATR(atr_len) × SL_multiple and TPs in R.
Optional fixed caps by timeframe (e.g., M1/M5) using USD per point.
Longs: SL = entry – risk; TPi = entry + (Ri × risk).
Shorts: SL = entry + risk; TPi = entry – (Ri × risk).
All levels auto-reflow to the right as bars print.
Chart hygiene:
The latest trade shows ENTRY/SL/TP1–TP4 fully.
Older trades are automatically trimmed (only a short ENTRY line remains, with optional label).
Alerts:
BUY – Smart Entry (Tick) & SELL – Smart Entry (Tick) fire on live-qualified signals.
You can connect alerts to your automation, respecting your broker’s risk controls.
Inputs (English summary of UI)
Label settings: label size; ATR-based vs fixed-tick offsets; leader line width/transparency; horizontal label shift.
Gann Hi/Lo: HIGH Period (HPeriod), LOW Period (LPeriod).
Market filters: ADX (length, smoothing, minimum), RSI (length + caps), recent extremes (lookback + ATR buffer).
Entry/SL/TP Levels: TP1–TP4 (R), label right-shift, show last-trade prices on labels.
Fixed SL Caps: per-timeframe caps (M1/M5) via USD per point.
How to use
Apply on your instrument/timeframe; tune H/L periods and filters to your market (e.g., XAUUSD on M1/M5).
Favor signals aligned with the Hi/Lo regime; tighten filters (higher ADX, stricter RSI caps) to reduce noise.
Choose ATR-Risk or fixed caps depending on your preferences.
The drawing policy ensures the most recent trade remains front-and-center.
Notes & limitations
Signals can evaluate intrabar; MA-based context is inherently lagging.
ATR-based ladders adapt to volatility; extreme spikes can widen risk.
This is a technical analysis tool, not financial advice.
Universal Direction EstimatorUniversal Direction Estimator V1
Overview
The Universal Direction Estimator V1 is a Pine Script v6 indicator that unifies Trend, Momentum, and Market-Structure readings into a single normalized score ranging from −1 to +1. It can optionally reference a higher timeframe (HTF) for confirmation and apply a custom Wilder-style ADX confidence boost to highlight conditions where directional bias is statistically stronger.
It’s designed as an interpretable directional meter – providing a quick visual estimate of whether short-term forces favor upward, downward, or neutral movement.
How It Works
The model produces three independent sub-scores each normalized to the −1 to +1 range:
• Trend Component (EMA-Spread): Measures distance between a fast and slow EMA, scaled by ATR and passed through a smooth tanh function to stabilize extremes.
• Momentum Component (ROC): Captures short-term velocity using rate-of-change over a configurable window.
• Structure Component (Market Structure): Detects new highs or lows within a rolling bar window and otherwise uses the deviation of price from a mid-SMA to express bias.
A weighted blend (default = 45 % Trend / 35 % Momentum / 20 % Structure) forms the base score.
Optional modules then refine it:
• HTF Alignment Bonus: When both local and higher-timeframe direction share the same sign, the score receives a small positive adjustment; disagreement slightly reduces confidence.
• ADX Confidence Boost: A self-contained Wilder-style +DI / −DI / DX calculation raises the score’s magnitude when measured trend strength exceeds a user threshold.
• The final bounded result determines one of three discrete states:
UP (score > 0.10), DOWN (score < −0.10), or NEUTRAL (inside the dead-zone).
Visual and Functional Features
• Candle Coloring: Optional shading of bars by current directional state.
• Direction Trail : A smoothed overlay of the score for visual continuity.
• Flip Markers: Up/Down triangles plotted when the estimator changes state.
• S tatus Table: Compact on-chart panel listing Direction, Score %, individual component weights, ADX value, and HTF alignment flag.
• Alerts: Built-in conditions trigger “Direction Flip: UP” / “Direction Flip: DOWN.”
Why It’s Original
Rather than relying on a single legacy indicator, this tool fuses three orthogonal measures into a unified confidence-weighted direction index, with both adaptive normalization and a bespoke ADX engine that avoids ta.adx(). The method produces a consistent −1 to +1 score applicable across instruments and timeframes, suitable for comparative scanning or overlay visualization.
It’s not a clone of classic moving-average or momentum systems; its novelty lies in the weighted, bounded integration and multi-timeframe coherence adjustment that makes directional interpretation more stable and portable between markets.
Configuration & Usage Notes
• Timeframes: Enter a higher-TF (e.g., 60, 240, D) and enable Use HTF Confirmation to activate cross-timeframe logic.
• Lengths & Weights: Adjust EMA, ROC, and Structure lookbacks and their blend ratios to tune sensitivity.
• Confidence Filter: Modify ADX length and threshold to emphasize stronger trends.
• Visual Controls: Toggle candle colors, trail line, arrows, and status table to fit your chart layout.
This estimator can be paired with other analytical overlays (volume, volatility, structure) for study purposes, but it is not designed to issue automated trade entries or exits.
Legal Disclaimer
This indicator is for charting and educational use only and does not constitute financial advice, trading signals, or performance claims. Markets involve risk, including the loss of principal. Past performance does not guarantee future results. Use at your own discretion and consult a qualified professional before making financial decisions. Provided “as is,” without warranties

Swing AURORA v4.0 — Refined Trend Signals### Swing Algo v4.0 — Refined Trend Signals
#### Overview
Swing Algo v4.0 is an advanced technical indicator designed for TradingView, built to detect trend changes and provide actionable buy/sell signals in various market conditions. It combines multiple technical elements like moving averages, ADX for trend strength, Stochastic RSI for timing, and RSI divergence for confirmation, all while adapting to different timeframes through auto-tuning. This indicator overlays on your chart, highlighting trend regimes with background colors, displaying buy/sell labels (including "strong" variants), and offering early "potential" signals for proactive trading decisions. It's suitable for swing trading, trend following, or as a filter for other strategies across forex, stocks, crypto, and other assets.
#### Purpose
The primary goal of Swing Algo v4.0 is to help traders identify high-probability trend reversals and continuations early, reducing noise and false signals. It aims to provide clear, non-repainting signals that align with market structure, volatility, and momentum. By incorporating filters like higher timeframe (HTF) alignment, bias EMAs, and divergence, it refines entries for better accuracy. The indicator emphasizes balanced performance across aggressive, balanced, and conservative modes, making it versatile for both novice and experienced traders seeking to optimize their decision-making process.
#### What It Indicates
- **Trend Regimes (Background Coloring)**: The chart background changes color to reflect the current market regime:
- **Green (Intense for strong uptrends, faded when cooling)**: Indicates bullish trends where price is above the baseline and EMAs are aligned upward.
- **Red/Maroon (Intense maroon for strong downtrends, faded red when cooling)**: Signals bearish trends with price below the baseline and downward EMA alignment.
- **Faded Yellow**: Marks "no-trade" zones or potential trend changes, where conditions are choppy, weak, or neutral (e.g., low ADX, near baseline, or low volatility).
- **Buy/Sell Signals**: Labels appear on the chart for confirmed entries:
- "BUY" or "STRONG BUY" for bullish signals (strong variants require higher scores and optional divergence).
- "SELL" or "STRONG SELL" for bearish signals.
- **Potential Signals**: Early warnings like "Potential BUY" or "Potential SELL" appear before full confirmation, allowing traders to anticipate moves (confirmed after a few bars based on the trigger window).
- **Divergence Marks**: Small "DIV↑" (bullish) or "DIV↓" (bearish) labels highlight RSI divergences on pivots, adding confluence for strong signals.
- **Lines**: Optional plots for baseline (teal), EMA13/21 (lime/red based on crossover), providing visual trend context.
Signals are anchored either to the current bar or confirmed pivots, ensuring alignment with price action. The indicator avoids repainting by confirming on close if enabled.
#### Key Parameters and Customization
Swing Algo v4.0 offers minimal yet efficient parameters for fine-tuning, with defaults optimized for common use cases. Most can be auto-tuned based on timeframe for simplicity:
- **Confirm on Close (no repaint)**: Boolean (default: true) – Ensures signals don't repaint by waiting for bar confirmation.
- **Auto-tune by Timeframe**: Boolean (default: true) – Automatically adjusts lengths and sensitivity for 5-15m, 30-60m, 2-4h, or higher frames.
- **Mode**: String (options: Aggressive, Balanced , Conservative) – Controls signal thresholds; Aggressive for more signals, Conservative for fewer but higher-quality ones.
- **Signal Anchor**: String (options: Pivot (divLB) , Current bar) – Places labels on confirmed pivots or the current bar.
- **Trigger Window (bars)**: Integer (default: 3) – Window for signal timing; auto-tuned if enabled.
- **Baseline Type**: String (options: HMA , EMA, ALMA) – Core trend line; lengths auto-tune (e.g., 55 for short frames).
- **Use Bias EMA Filter**: Boolean (default: false) – Adds a long-term EMA for trend bias.
- **Use HTF Filter**: Boolean (default: false) – Aligns with higher timeframe (auto or manual like 60m, 240m, D); override for stricter scoring.
- **Sensitivity (10–90)**: Integer (default: 55) – Adjusts ADX threshold for trend detection; higher = more sensitive.
- **Use RSI-Stoch Trigger**: Boolean (default: true) – Enables Stochastic RSI for entry timing; customizable lengths, smooths, and levels.
- **Use RSI Divergence for STRONG**: Boolean (default: true) – Requires divergence for strong signals; pivot lookback (default: 5).
- **Visual Options**: Booleans for background regime, labels, divergence marks, and lines (all default: true).
These parameters are grouped for ease, with tooltips in TradingView for quick reference. Start with defaults and tweak based on backtesting.
#### How It Works
At its core, Swing Algo v4.0 calculates a baseline (e.g., HMA) to define the trend direction. It then scores potential buys/sells using factors like:
- **Trend Strength**: ADX above a dynamic threshold, combined with EMA crossovers (13/21) and slope analysis.
- **Volatility/Volume**: Bollinger/Keltner squeeze exits, volume z-score, and ATR filters to avoid choppy markets.
- **Timing**: Stochastic RSI crossovers or micro-timing via DEMA/TEMA for precise entries.
- **Filters**: Bias EMA, HTF alignment, gap from baseline, and no-trade zones (weak ADX, near baseline, low vol).
- **Divergence**: RSI pivots confirm strong signals.
- **Scoring**: Buy/sell scores (min 3-5 based on mode) trigger labels only when all gates pass, with early "potential" detection for foresight.
The algorithm processes these in real-time, auto-adapting to timeframe for efficiency. Signals flip only on direction changes to prevent over-trading. For best results, use on liquid assets and combine with risk management.
#### Disclaimer
This indicator is for educational and informational purposes only and does not constitute financial advice, investment recommendations, or trading signals. Trading involves significant risk of loss and is not suitable for all investors. Past performance is not indicative of future results. Always backtest the indicator on your preferred assets and timeframes, and consult a qualified financial advisor before making any trading decisions. The author assumes no liability for any losses incurred from using this script. Use at your own risk.

ScalpDaddy V3ScalpDaddy bundles eight battle‑tested tools into a single, toggleable overlay for fast confluence and clean charts. It’s designed for intraday scalpers and swing traders who want a lightweight dashboard plus precision levels and volatility context—without juggling multiple indicators.
What’s Inside (all can be turned on/off)
SD: Trend Sniper (MTF RSI/ADX table)
8‑TF heatmap with emoji glyphs (momentum/strength/chop).
Weighted bias meter, HTF dominance and adjacency bonus to reward agreement.
Tiny Entry‑Qualifier dashboard (Trend, Throttle, Quality, Boost) for quick “go/no‑go”.
SD: Squeeze (BB/KC)
Bollinger Bands + Keltner Channel with squeeze fill for compression/expansion reads.
SD: Fibonacci Levels
Swing‑aware fib grid with instant flip option, reject band, extension gates, target‑zone shading, and labels.
SD: PM/AH/RTH Levels
Prior extended‑hours and prior RTH high/low, with dynamic/previous‑only modes.
SD: Pivot Points (Structure)
Clean, confirmed pivot markers to visualize HH/HL/LH/LL, BOS/MSS turns.
SD: Liquidity Sweeper
Buyside/Sellside liquidity pools with live maintenance and optional invalidation highlighting.
SD: FVG Finder
Present/Full‑history scan with budget controls, configurable fill logic and coloring.
SD: Fourier ATR
Smoothed ATR “center line” with envelope; optional labels when price exits/re‑enters the band.
Quick Start
Open inputs. In “SD: Modules,” enable only what you need for the session.
For Trend Sniper:
Pick “Table TF Preset” (e.g., fibs day trade, scalp, short/long swing) or enable “Custom TFs” and set each TF.
Choose Update Mode: “Live” for intrabar responsiveness or “On Close” for confirmed, non‑flickering signals.
Table and mini dashboard positions are configurable.
Optional confluence:
Turn on Squeeze to spot compression before Trend Sniper shifts.
Add Sessions + Liquidity + FVG to map targets/voids and where price is likely to react.
Use ATR Envelope to gauge when price is stretching outside normal travel.
How To Read The Trend Sniper Table
Emojis:
🚀/🔥 = bullish pressure; ⚓️/🩸 = bearish pressure; 🪓 = chop; ⚠️ = caution (e.g., OB/OS with strong ADX).
Bias:
A normalized, weighted read of the 8 TFs. The default thresholds used for alerts: +0.30 (bullish) / −0.30 (bearish).
HTF dominance:
When enabled, strong alignment on the slowest TFs dampens opposite LTF noise.
Entry‑Qualifier mini dash:
“Trend” (ADX), “Throttle” (RSI), “Quality” (Chop), “Boost” (relative volume). Green/steady reads support continuation; yellow/red flags warn of choppiness/whipsaw.
Module Notes
Squeeze (BB/KC): Look for squeeze fill changes—breakouts often follow compression.
Fibonacci: “Zigzag Period” sets swing sensitivity; “Instant flip” optionally flips the active leg when price breaks a chosen threshold (wick/close). Target‑zone shading highlights extension ranges; labels can be limited to extensions only.
PM/AH/RTH: “RTH Mode” = Dynamic (today’s running levels during RTH) or Previous Session Only. Optional volume filter for PM/AH to show only significant sessions.
Pivot Points: Uses confirmed pivots; simple circular markers show HH/HL/LH/LL and shifts (BOS/MSS) without clutter.
Liquidity: “margin” adjusts pool thickness sensitivity; enable “Show Broken” to keep invalidated pools visible with different fill.
FVG Finder: Choose Present or Full History and set a bar budget to control performance. “Fill Mode” supports touch/close/percent thresholds.
Fourier ATR: Envelope defines typical travel. Optional labels:
⚠️ when price exits the band
⬇️ when price re‑enters
Built‑in Alerts
Open the Alerts dialog and choose this indicator; you’ll see named alerts you can attach to any symbol/interval:
Bull Combo (🚀/🔥 no ⚠️)
Table: RSI/ADX Bull Majority
Table: RSI/ADX Bear Majority
Bias turns Bullish (≥ +0.30)
Bias turns Bearish (≤ −0.30)
EQ Bull Align
EQ Bear Align
ATR: ⚠️ Price exited envelope
ATR: ⬇️ Price re‑entered envelope
Performance Tips
Start with only the modules you need. Turn others off in “SD: Modules.”
For FVG, use Present mode with a reasonable “Present Mode Bars” budget on lower timeframes.
Set Trend Sniper to “On Close” for steadier updates during fast markets.
Heavy drawings (many labels/lines/fills) can be reduced by lowering visible counts or disabling labels.
Best Practices & Disclaimers
Educational tool, not financial advice. Past performance does not guarantee future results.
Signals are contextual—use with sound risk management and higher‑timeframe bias.
Some elements can update intrabar when “Live” or “allow repaint” is on (ATR emojis); prefer confirmed/close‑based modes if you want steadier behavior.
Works on most symbols and timeframes; intended primarily for intraday to swing trading.

MACD Trading System - Professional V2# MACD Trading System - Professional V2
## Executive Summary
**MACD Pro V2** is an institutional-grade trading indicator combining classical MACD analysis with advanced risk management, multi-timeframe confirmation, and comprehensive performance metrics. Designed for both manual traders and algorithmic systems, this indicator provides actionable signals with built-in stop loss calculation, take profit targets, position sizing, and trailing stop logic.
This indicator is NOT just a signal generator—it's a complete trading system with risk/reward management, performance tracking, and market regime detection.
---
## Core Features
### 1. Advanced MACD Calculation
- **Customizable EMAs**: Fast (default 8), Slow (default 21), Signal (default 5)
- **Confirmed Signals**: Uses barstate.isconfirmed to prevent repainting
- **Zero-Line Position**: Shows MACD above/below zero for momentum context
### 2. Multi-Timeframe Analysis
- **4 Simultaneous Timeframes**: 4H, 1H, 15M, 5M analyzed in parallel
- **MTF Alignment Score**: 0-100% showing consensus across timeframes
- **Smart Requests**: Uses lookahead=barmerge.lookahead_off for accuracy
### 3. Market Regime Detection
Automatically identifies current market conditions:
- **TRENDING** - ADX > 25, strong directional movement
- **RANGING** - ADX < 20, choppy sideways movement
- **VOLATILE** - ATR > 1.5x average, high uncertainty
- **NORMAL** - Default market state
### 4. Integrated Risk Management
Complete position management system:
- **Stop Loss Calculation**: Automatic SL placement based on ATR × multiplier
- **Take Profit Targets**: Calculated using Risk:Reward ratio (default 2:1)
- **Position Sizing**: Scales position size based on account risk percentage
- **Trailing Stop**: Dynamically adjusts SL as price moves in your favor
- **Drawdown Monitoring**: Tracks maximum drawdown vs account
### 5. Advanced Signal Scoring
0-100 point system weighing:
- **MTF Alignment (35%)**: Multi-timeframe confirmation strength
- **Momentum (25%)**: RSI conditions + Divergence detection
- **Volume (20%)**: Volume profile and confirmation
- **Volatility (20%)**: Market regime adjustment
**Signal Classifications:**
- **STRONG (70+)**: High confidence, tight stops, optimal entry
- **MEDIUM (50-69)**: Valid signals, confirm with price action
- **WEAK (<50)**: Low conviction, skip or use tight risk management
### 6. Professional Performance Metrics
Real-time trading statistics:
- **Win Rate**: Percentage of winning trades
- **Max Drawdown**: Largest peak-to-trough decline
- **Sharpe Ratio**: Risk-adjusted returns (anualized)
- **Profit Factor**: Gross profit / Gross loss ratio
- **Consecutive Losses**: Psychological stress indicator
### 7. Advanced Filtering System
- **Divergence Detection**: Automatic bullish/bearish divergence identification
- **Support/Resistance**: Pivot-based dynamic S/R levels
- **Volume Confirmation**: Only takes signals with volume > 1.0x average
- **Session Filter**: Optional trading hours restriction
- **Volatility Adjustment**: Reduces entries in extremely high volatility
---
## How It Works
### Signal Generation Process
**Step 1: MACD Crossover**
- Crossover of MACD above/below signal line triggers base signal
- Uses confirmed values to prevent false signals
**Step 2: Multi-Timeframe Confirmation**
- Checks trend alignment on 4H, 1H, 15M, 5M
- Calculates MTF alignment percentage
- Higher alignment = higher confidence
**Step 3: Advanced Scoring**
Signal is scored on 100-point scale:
- MTF alignment contribution (35 pts max)
- RSI + Divergence (25 pts max)
- Volume profile (20 pts max)
- Volatility regime adjustment (20 pts max)
**Step 4: Filter Application**
- Session filter (if enabled)
- Support/Resistance proximity bonus
- Volume confirmation requirement
- Drawdown check (if risk mgmt enabled)
**Step 5: Risk Calculation**
- Stop Loss placed 2 ATR below entry (customizable)
- Take Profit calculated using 2:1 risk/reward ratio
- Position size scaled to risk 1% per trade
- Trailing stop activated after 1R profit
**Step 6: Signal Output**
- Buy Signal: Green triangle (Strong) or circle (Medium)
- Sell Signal: Red triangle (Strong) or circle (Medium)
- Dashboard shows complete trade details
---
## Trading Scenarios
### Scenario 1: Strong Buy Setup
```
Requirements met:
✓ MACD crosses above signal line
✓ 3/4 timeframes bullish (4H, 1H, 15M)
✓ RSI oversold (< 30)
✓ Volume spike confirmed
✓ Score: 78/100 → STRONG BUY
System provides:
- Entry: Current price
- Stop Loss: 2 ATR below entry
- Take Profit: 2× risk distance above
- Position Size: Adjusted to 1% account risk
- Trailing Stop: Activates at 1R profit
```
### Scenario 2: Medium Buy with Divergence
```
Requirements met:
✓ MACD crosses above signal line
✓ 2/4 timeframes bullish (4H, 1H)
✓ Bullish divergence detected
✓ Price near support level
✓ Score: 62/100 → MEDIUM BUY
Considerations:
- Lower confidence → tighter risk management
- Use smaller position size
- Require additional confirmation
- Better as counter-trend entry
```
### Scenario 3: Ranging Market Filter
```
Market condition detected: RANGING
ADX < 20, sideways movement
System response:
- Reduces signal score by volatility adjustment
- May skip signals entirely
- Prioritizes higher confluence
- Warns of low trend probability
Best action: Wait for trending market
```
---
## Risk Management Deep Dive
### Stop Loss Calculation
```
Stop Loss Distance = ATR × ATR Multiplier (default 2.0)
Example:
- Current price: 1.0850
- ATR(14): 0.0045
- SL Distance: 0.0045 × 2.0 = 0.009
- BUY SL: 1.0850 - 0.009 = 1.0760
```
### Position Sizing
```
Position Size = (Account Risk % / Price Risk %)
Example:
- Risk per trade: 1% of account
- Stop distance: 0.009 on price of 1.0850
- Price risk: 0.009 / 1.0850 = 0.83%
- Position size: 1.0% / 0.83% = 1.2x (capped at 1.0x max)
```
### Trailing Stop Logic
```
Normal SL: 2 ATR below entry
Trigger Level: Entry + (Entry - SL) × Trail Activation (1.0R)
Trailing Mechanism:
- If price hits trigger, trailing SL activates
- SL moves up to: Close - 2 ATR
- SL never moves down, only up (for longs)
- Protects profits while allowing upside
```
### Drawdown Protection
```
Tracks:
- Peak equity reached
- Current drawdown from peak
- Maximum drawdown recorded
- Stops trading if max DD exceeded
Example:
- Peak: $10,000
- Current: $9,200
- Drawdown: 8%
- Max allowed: 10%
- Status: CONTINUE TRADING
```
---
## Dashboard Metrics Explained
### Market Section
- **Market Regime**: Current state (Trending/Ranging/Volatile/Normal)
- **ADX Value**: Trend strength indicator (0-100)
### Position Section
- **Current Position**: LONG, SHORT, or NONE
- **P&L**: Unrealized profit/loss percentage if in position
### Timeframe Section
- Individual 4H/1H/15M trend status
- **Alignment**: Percentage of bullish timeframes
### Risk Management Section
- **Stop Loss %**: Distance from current price
- **Take Profit %**: Target profit distance
- **Position Size**: Capital allocation multiplier
- **Risk %**: Per-trade risk percentage
### Performance Section
- **Win Rate**: % of winning trades (>60% is excellent)
- **Max DD**: Maximum drawdown experienced
- **Sharpe Ratio**: Risk-adjusted return metric
- **Profit Factor**: Ratio of profits to losses
### Indicators Section
- **RSI**: Momentum and overbought/oversold levels
- **Volume**: Current vs. average volume ratio
- **Divergence**: Active divergence detection
---
## Advanced Features
### Divergence Detection
```
Bullish Divergence:
- Price makes lower low
- MACD makes higher high
- Signals potential reversal UP
Bearish Divergence:
- Price makes higher high
- MACD makes lower low
- Signals potential reversal DOWN
Lookback: 20 bars (customizable)
```
### Support & Resistance
```
Method: Pivot High/Low detection
- Pivot Left/Right: 10 bars
- Dynamic S/R levels update as new pivots form
- Bonus score if entry near identified levels
```
### Performance Tracking
Real-time statistics calculated from:
- Win/loss signals
- Profit/loss per trade
- Consecutive losing trades
- Cumulative returns
- Standard deviation (Sharpe calculation)
Stores last 100 trades in memory for statistics.
---
## Input Parameters Explained
### MACD Settings
- **Fast EMA** (5-13): Lower = more responsive, more false signals
- **Slow EMA** (20-26): Higher = smoother, misses faster moves
- **Signal EMA** (5-9): Crossover sensitivity
### Risk Management
- **ATR Period** (default 14): Volatility measurement period
- **SL ATR Multiplier** (1.5-3.0): Stop loss tightness
- **Risk:Reward Ratio** (1-5): Profit target calculation
- **Trail Activation** (0.5-2.0): When to start trailing stop
- **Risk Per Trade** (0.1-5.0): Account risk percentage
- **Max Drawdown** (5-30%): Trading pause threshold
### Scoring Weights
Customize signal emphasis:
- **MTF Alignment** (35%): How important is multi-timeframe
- **Momentum** (25%): RSI and divergence weight
- **Volume** (20%): Volume confirmation priority
- **Volatility** (20%): Regime adjustment strength
### Advanced Filters
- **Check Divergence**: Enable/disable divergence scoring
- **Session Filter**: Restrict to specific hours
- **Min Volume Ratio**: Minimum volume for signal
### Display
- **Show Dashboard**: Main metrics table
- **Show Performance**: Trading statistics
- **Show S/R Levels**: Support/resistance visualization
---
## Best Practices
1. **Backtest Before Trading**: Test parameters on your preferred pairs
2. **Start with Strong Signals**: Use only 70+ scored signals initially
3. **Position Size**: Never risk more than 1-2% per trade
4. **Market Regime Awareness**: Skip ranging market entries
5. **Volume Confirmation**: Always check volume spikes
6. **Profit Taking**: Lock in profits at TP, don't let winners die
7. **Loss Management**: Honor stop losses, don't move them
8. **Performance Review**: Check metrics weekly, adjust if needed
---
## Trading Strategy Examples
### Conservative Strategy (Win-Rate Focus)
```
Settings:
- Signal Score Minimum: 70+ (Strong only)
- Risk Per Trade: 0.5%
- Risk:Reward: 3:1
- Position Size: 0.5x (smaller)
Targets:
- Win Rate > 65%
- Max DD < 5%
- Profit Factor > 2.0
```
### Aggressive Strategy (Profit Focus)
```
Settings:
- Signal Score Minimum: 50+ (Medium+)
- Risk Per Trade: 2%
- Risk:Reward: 1.5:1
- Position Size: 1.0x (maximum)
Targets:
- Win Rate > 55%
- Max DD < 10%
- Profit Factor > 1.5
```
### Trend Trading Strategy
```
Settings:
- Only trade when ADX > 25 (Trending)
- MTF Alignment: 3+ timeframes
- Use Trailing Stop: Yes
- Risk:Reward: 2.5:1
Focus on: Riding large moves
Best on: 4H timeframe
Pairs: Trending majors (EURUSD, GBPUSD)
```
### Divergence Trading Strategy
```
Settings:
- Signal Score Minimum: 60+
- Enable Divergence: Yes
- Volume Confirmation: Required
- Position Size: 0.75x
Focus on: Reversal entries
Best setup: Divergence at resistance/support
Risk management: Tight stops (1.5 ATR)
```
---
## Advantages
✓ Complete trading system, not just signals
✓ Built-in risk management and position sizing
✓ Real-time performance tracking
✓ Multi-timeframe confirmation reduces false signals
✓ Advanced filtering and divergence detection
✓ Market regime awareness
✓ Customizable scoring weights
✓ Professional dashboard display
✓ Support/resistance integration
✓ Trailing stop logic for profit protection
---
## Limitations
- Lagging indicator (uses confirmed bars)
- Works best on trending markets
- Not optimized for news/event trading
- Requires parameter optimization per pair
- Performance varies by timeframe
- Past performance doesn't guarantee future results
- Can produce whipsaw signals in ranging markets
---
## System Requirements
- TradingView Premium or higher (for advanced charting)
- Recommended: 4H or 1H timeframe
- Historical data: Minimum 100 bars
- Currency pairs: Works on all FX pairs, stocks, commodities
---
## Disclaimer
This indicator is provided for educational and informational purposes only. It is not financial advice and does not guarantee profits. Past performance does not predict future results.
**Important Notices:**
- Always use proper risk management
- Trade only with capital you can afford to lose
- Backtest thoroughly before live trading
- Combine with your own analysis
- Consider external market factors and news
- Monitor positions actively
- Keep emotional discipline
---
## Support & Optimization
For best results:
1. Test on your preferred instrument (6-12 months history)
2. Adjust MACD parameters to your timeframe
3. Optimize scoring weights to your style
4. Set risk management per your account size
5. Document your trade results and review weekly
6. Adapt parameters if performance degrades
This is a powerful system when used correctly. Respect the rules and let statistics work in your favor.

B Trend Analysis % (No Repaint)
Overview
B Trend Analysis % is a no-repaint indicator that identifies bullish, bearish, or mean-reverting market phases using confirmed (prior-bar) signals from SMA crossovers, ADX trend strength, Supertrend direction, and optional RSI filtering. It visualizes trends via background colors (green for bullish, red for bearish, gray for mean-reversion) and provides a stats table showing bullish/bearish percentages over the chart's history.
How It Works
-
SMA Crossover: Detects momentum shifts with short (default 1) vs. long (default 3) SMAs.
ADX Filter: Ensures strong trends (smoothed ADX > threshold, default 1).
Supertrend: Confirms direction using ATR-based bands (period 3, factor 0.3).
RSI (Optional): Filters extremes (oversold >30 for bull, overbought <70 for bear; period 2).
Trends require trendLookback (default 3) consecutive confirmed bars for reliability. Stats count only confirmed bars to avoid repainting.
Usage
- Apply to any timeframe/symbol for trend confirmation.
- Green background: Enter/hold longs; red: shorts; gray: Avoid trades (range-bound).
- Tune inputs: Shorten lengths for scalping; enable RSI for mean-reversion filters.
- Plots: Blue (short SMA), red (long SMA). Table shows % bullish/bearish and ADX strength.
- Best for volatile assets like crypto/forex; back test on clean price charts.
Key Features
- No repainting: Uses var state and prior-bar values ( ).
- Efficient: Lightweight calcs, no request .security() .
- Customizable: Advanced group for lookback (1-5 bars).
Protected Script Notice
This script is published as Protected to safeguard proprietary elements in the trend confirmation logic, including the custom consecutive-bar counter and smoothed ADX integration, which were developed through extensive back testing. While the core inputs and outputs are fully accessible for use, the exact implementation details are not viewable to prevent unauthorized replication. Users can still apply it to charts, customize visible parameters, and benefit from its no-repaint reliability. For collaboration or access requests, contact the author via Trading View messaging.
This is an original combination for clearer trend stats—fork and improve where possible!