Multi-indicator Signal Builder [Skyrexio]Overview
Multi-Indicator Signal Builder is a versatile, all-in-one script designed to streamline your trading workflow by combining multiple popular technical indicators under a single roof. It features a single-entry, single-exit logic, intrabar stop-loss/take-profit handling, an optional time filter, a visually accessible condition table, and a built-in statistics label. Traders can choose any combination of 12+ indicators (RSI, Ultimate Oscillator, Bollinger %B, Moving Averages, ADX, Stochastic, MACD, PSAR, MFI, CCI, Heikin Ashi, and a “TV Screener” placeholder) to form entry or exit conditions. This script aims to simplify strategy creation and analysis, making it a powerful toolkit for technical traders.
Indicators Overview
1. RSI (Relative Strength Index)
Measures recent price changes to evaluate overbought or oversold conditions on a 0–100 scale.
2. Ultimate Oscillator (UO)
Uses weighted averages of three different timeframes, aiming to confirm price momentum while avoiding false divergences.
3. Bollinger %B
Expresses price relative to Bollinger Bands, indicating whether price is near the upper band (overbought) or lower band (oversold).
4. Moving Average (MA)
Smooths price data over a specified period. The script supports both SMA and EMA to help identify trend direction and potential crossovers.
5. ADX (Average Directional Index)
Gauges the strength of a trend (0–100). Higher ADX signals stronger momentum, while lower ADX indicates a weaker trend.
6. Stochastic
Compares a closing price to a price range over a given period to identify momentum shifts and potential reversals.
7. MACD (Moving Average Convergence/Divergence)
Tracks the difference between two EMAs plus a signal line, commonly used to spot momentum flips through crossovers.
8. PSAR (Parabolic SAR)
Plots a trailing stop-and-reverse dot that moves with the trend. Often used to signal potential reversals when price crosses PSAR.
9. MFI (Money Flow Index)
Similar to RSI but incorporates volume data. A reading above 80 can suggest overbought conditions, while below 20 may indicate oversold.
10. CCI (Commodity Channel Index)
Identifies cyclical trends or overbought/oversold levels by comparing current price to an average price over a set timeframe.
11. Heikin Ashi
A type of candlestick charting that filters out market noise. The script uses a streak-based approach (multiple consecutive bullish or bearish bars) to gauge mini-trends.
12. TV Screener
A placeholder condition designed to integrate external buy/sell logic (like a TradingView “Buy” or “Sell” rating). Users can override or reference external signals if desired.
Unique Features
1. Multi-Indicator Entry and Exit
You can selectively enable any subset of 12+ classic indicators, each with customizable parameters and conditions. A position opens only if all enabled entry conditions are met, and it closes only when all enabled exit conditions are satisfied, helping reduce false triggers.
2. Single-Entry / Single-Exit with Intrabar SL/TP
The script supports a single position at a time. Once a position is open, it monitors intrabar to see if the price hits your stop-loss or take-profit levels before the bar closes, making results more realistic for fast-moving markets.
3. Time Window Filter
Users may specify a start/end date range during which trades are allowed, making it convenient to focus on specific market cycles for backtesting or live trading.
4. Condition Table and Statistics
A table at the bottom of the chart lists all active entry/exit indicators. Upon each closed trade, an integrated statistics label displays net profit, total trades, win/loss count, average and median PnL, etc.
5. Seamless Alerts and Automation
Configure alerts in TradingView using “Any alert() function call.”
The script sends JSON alert messages you can route to your own webhook.
The indicator can be integrated with Skyrexio alert bots to automate execution on major cryptocurrency exchanges
6. Optional MA/PSAR Plots
For added visual clarity, optionally plot the chosen moving averages or PSAR on the chart to confirm signals without stacking multiple indicators.
Methodology
1. Multi-Indicator Entry Logic
When multiple entry indicators are enabled (e.g., RSI + Stochastic + MACD), the script requires all signals to align before generating an entry. Each indicator can be set for crossovers, crossunders, thresholds (above/below), etc. This “AND” logic aims to filter out low-confidence triggers.
2. Single-Entry Intrabar SL/TP
One Position At a Time: Once an entry signal triggers, a trade opens at the bar’s close.
Intrabar Checks: Stop-loss and take-profit levels (if enabled) are monitored on every tick. If either is reached, the position closes immediately, without waiting for the bar to end.
3. Exit Logic
All Conditions Must Agree: If the trade is still open (SL/TP not triggered), then all enabled exit indicators must confirm a closure before the script exits on the bar’s close.
4. Time Filter
Optional Trading Window: You can activate a date/time range to constrain entries and exits strictly to that interval.
Justification of Methodology
Indicator Confluence: Combining multiple tools (RSI, MACD, etc.) can reduce noise and false signals.
Intrabar SL/TP: Capturing real-time spikes or dips provides a more precise reflection of typical live trading scenarios.
Single-Entry Model: Straightforward for both manual and automated tracking (especially important in bridging to bots).
Custom Date Range: Helps refine backtesting for specific market conditions or to avoid known irregular data periods.
How to Use
1. Add the Script to Your Chart
In TradingView, open Indicators , search for “Multi-indicator Signal Builder”.
Click to add it to your chart.
2. Configure Inputs
Time Filter: Set a start and end date for trades.
Alerts Messages: Input any JSON or text payload needed by your external service or bot.
Entry Conditions: Enable and configure any indicators (e.g., RSI, MACD) for a confluence-based entry.
Close Conditions: Enable exit indicators, along with optional SL (negative %) and TP (positive %) levels.
3. Set Up Alerts
In TradingView, select “Create Alert” → Condition = “Any alert() function call” → choose this script.
Entry Alert: Triggers on the script’s entry signal.
Close Alert: Triggers on the script’s close signal (or if SL/TP is hit).
Skyrexio Alert Bots: You can route these alerts via webhook to Skyrexio alert bots to automate order execution on major crypto exchanges (or any other supported broker).
4. Visual Reference
A condition table at the bottom summarizes active signals.
Statistics Label updates automatically as trades are closed, showing PnL stats and distribution metrics.
Backtesting Guidelines
Symbol/Timeframe: Works on multiple assets and timeframes; always do thorough testing.
Realistic Costs: Adjust commissions and potential slippage to match typical exchange conditions.
Risk Management: If using the built-in stop-loss/take-profit, set percentages that reflect your personal risk tolerance.
Longer Test Horizons: Verify performance across diverse market cycles to gauge reliability.
Example of statistic calculation
Test Period: 2023-01-01 to 2025-12-31
Initial Capital: $1,000
Commission: 0.1%, Slippage ~5 ticks
Trade Count: 468 (varies by strategy conditions)
Win rate: 76% (varies by strategy conditions)
Net Profit: +96.17% (varies by strategy conditions)
Disclaimer
This indicator is provided strictly for informational and educational purposes .
It does not constitute financial or trading advice.
Past performance never guarantees future results.
Always test thoroughly in demo environments before using real capital.
Enjoy exploring the Multi-Indicator Signal Builder! Experiment with different indicator combinations and adjust parameters to align with your trading preferences, whether you trade manually or link your alerts to external automation services. Happy trading and stay safe!
In den Scripts nach "adx" suchen

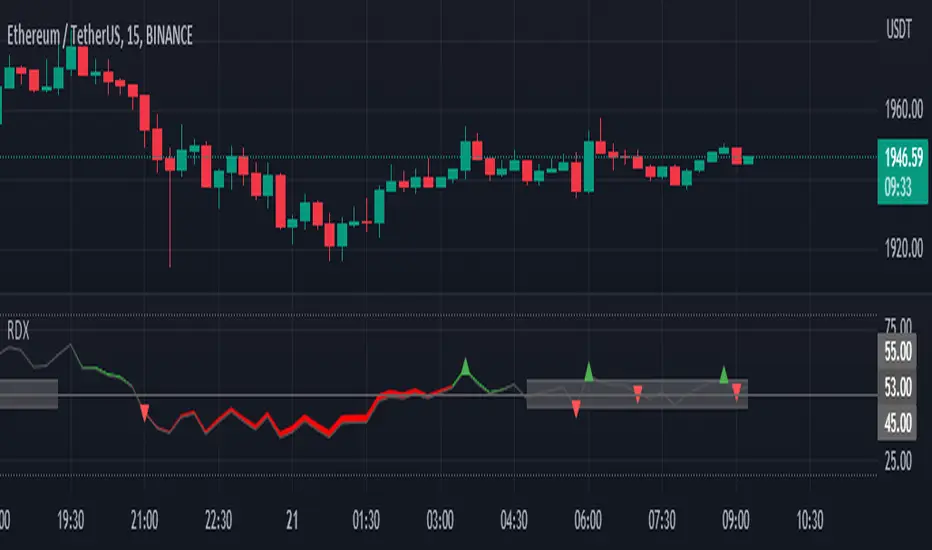
RDX Relative Directional IndexRDX Relative Directional Index, Strength + Direction + Trend. This indicator is the combination of RSI and DMI or ADX. RDX aims at providing Relative direction of the price along with strength of the trend. This acts as both RSI and Average Directional Index. as the strength grows the RSI line becomes wider and when there is high volatility and market fluctuation the line becomes thinner. Color decides the Direction. This indicator provides sideways detection of RSI signal.
RDX Width: This determines the strength of RSI and Strength of ADX, The strength grows RDX band grows wider, as strength decreases band shrinks and merge into the RSI line. for exact working simply disable RSI plot on the indicator. when there is no strength the RSI vanishes..
Technical:
RSI : with default 14 period
ADX : Default 14 period
RDX=RSI+(ADX-20)/5
Color Code:
Red: Down Direction
Green: Up Direction
Sideways:
A rectangular channel is plotted on RSI 50 Level
Oversold Overbought:
Oversold and Overbought Levels are plotted for normal RSI Oversold and Overbought detection.
Buy/Sell:
Buy sell signals from ADX crossover are plotted and its easy to determine
Strength + Direction + Trend in one go
Hope the community likes this...
Contibute for more ideas and indicators..
Hotch DMI+OBV+RSI ConfluenceThis Indicator uses the Relative Strength Index, On Balance Volume, and ADX to identify viable trading trends.
A quick description of what is on display:
1.) Green Triangle = OBV crossing over OBV MA
2.)Red Triangle = OBV Crossing under OBV SMA
3.) The background coloring between the RSI Oversold and Overbought Values has multiple conditions.
----It is green when the DI+ > DI-
----It is purple when the DI+ < DI-
----the brightness represents the ADX value. Darker areas(or more transparent) show a weak ADX value(4). Brighter (or less transparent) show a stronger ADX value(3)
5.) RSI and RSI moving average, including a divergence indicator.
6.) A histogram representing the normalized value of OBV-OBVMA to show changes in value while remaining readably in range on the chart with other indicators.
In the included chart screen shot is an example of an applicable strategy. This example is no guaranteed success and is also not the only strategy applicable to the indicator.

Multi-Timeframe 10XIMPORTANT NOTE:
-> The timeframe for this indicator must be set at 1 minute;
-> If the chart timeframe is higher than 1 minute, the results shown in the table for timeframes lower than the chart will not be correct;
-> Tradingview's own documentation explains this as follows: " It is not recommended to request data of a timeframe lower that the current chart timeframe, for example 1 minute data from a 5 minutes chart. The main problem with such a case is that some part of a 1 minute data will be inevitably lost, as it’s impossible to display it on a 5 minutes chart and not to break the time axis. In such cases the behavior of security can be rather unexpected "; and
-> It is therefore recommended that this indicator is placed in a standalone 1min chart window, and the window resized to only show the table to avoid any issues.
Credits:
-> J. Welles Wilder creating the Directional Movement System (DMS) (1978); and
-> John Carter applying the DMS to create the popular Simpler Trading 10X Bars indicator.
Introduction:
Quickly see the quality and strength of a trend based on Directional Movement Index (DMI).
The Average Directional Index (ADX), Minus Directional Indicator (-DI) and Plus Directional Indicator (+DI) represent a group of directional movement indicators that form a trading system developed by Welles Wilder. Although Wilder designed his Directional Movement System with commodities and daily prices in mind, these indicators can also be applied to stocks. Wilder determined directional movement by comparing the difference between two consecutive lows with the difference between their respective highs.
+DI and -DI are derived from smoothed averages of these differences and measure trend direction over time. These two indicators are often collectively referred to as the DMI. ADX is in turn derived from the smoothed averages of the difference between +DI and -DI; it measures the strength of the trend (regardless of direction) over time.
Trade Signals:
-> Green indicates an uptrend i.e. when +DI is above -DI and ADX is greater than 20 - there is more upward pressure than downward pressure in the price;
-> Red indicates a downtrend i.e. when -DI is above +DI and ADX is greater than 20 - there is more downward pressure on the price; and
-> Yellow indicates no strong directional trend and potential for a reversal.
Standalone Indicator:
The 10X Bars version of the indicator can be found here:

TradingLatino_StrategySPANISH:
TL_STRATEGY:
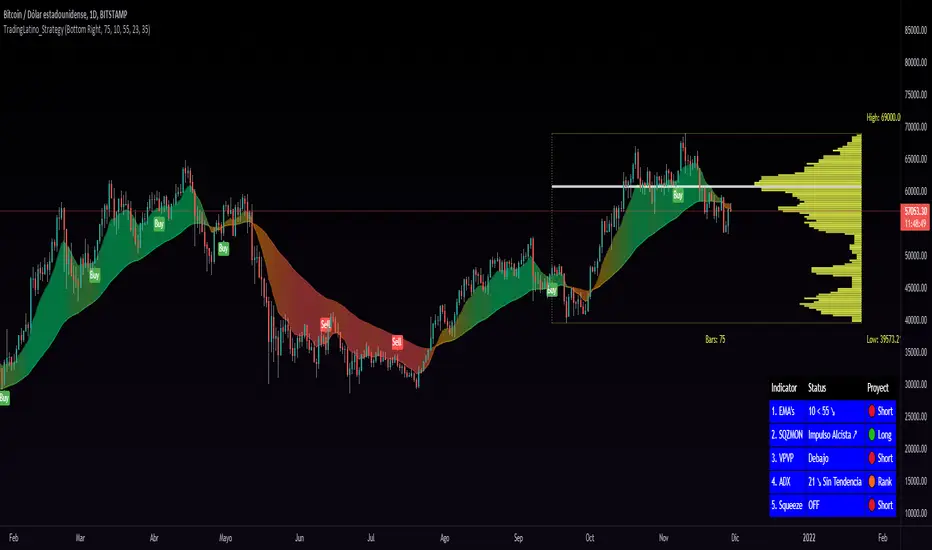
El TL_STRATEGY, es todo un ecosistema de indicadores que conforman una estrategia bastante potente y famosa en el trading de criptomonedas, está compuesta por los siguientes indicadores:
• Bandas de medias móviles exponenciales (10 y 55)
• Squeeze Momentum Indicator (SQZMON PRO+).
• Volume Profile (VP Desarrollado por APIDEVs).
• Average Directional Index ( ADX PRO+).
En ApiDev, decidimos optimizar visualmente esta estrategia, es por ello que creamos un panel informativo que muestra la proyección conjunta de todos los indicadores que ya mencionamos.
MEJORAS REALIZADAS EN LA ESTRATEGIA:
Más simple: Simplificamos la interfaz de todos los indicadores [para que el operador pueda seguir el ABC de su estrategia sin mucha complicación.
Señales de compra y venta: Basado en una estrategia que incorpora dos medias móviles de 10 y 55 periodos, la observación de la fuerza del ADX y la direccionalidad de los osciladores del SQZMON, señales de compra y venta para ser valorado por el comerciante.
Panel lateral: Integramos un panel lateral que permite observar la valoración y dirección de todos los indicadores que componen la estrategia.
Tiene un sistema de alerta que enviará notificaciones sobre los cambios que se produzcan en el indicador.
ENGLISH:
TL_STRATEGY:
The TL_STRATEGY , is a whole ecosystem of indicators that make up a quite powerful and famous strategy in cryptocurrency trading, it is composed of the following indicators:
• Exponential moving media bands (10 and 55).
• Squeeze Momentum indicator (SQZMON PRO +).
• Volume profile (VP Developed by APIDEVs).
• Average directional index ( ADX PRO +).
In ApiDev , we decided to visually optimize this strategy, that is why we created an information panel that shows the joint projection of all the indicators that we already mentioned.
IMPROVEMENTS MADE IN THE STRATEGY:
Simpler: We simplified the interface of all indicators [so that the trader can follow the ABCs of his strategy without much complication.
Buy and sell signals: Based on a strategy that incorporates two moving averages of 10 and 55 periods, the observation of the strength of the ADX and the directionality of the oscillators of the SQZMON, signals of buying and selling to be valued by the trader.
Side panel: We integrate a side panel that allows observing the assessment and direction of all the indicators that make up the strategy.
It has an alert system that will send notifications about the changes that occur in the indicator.
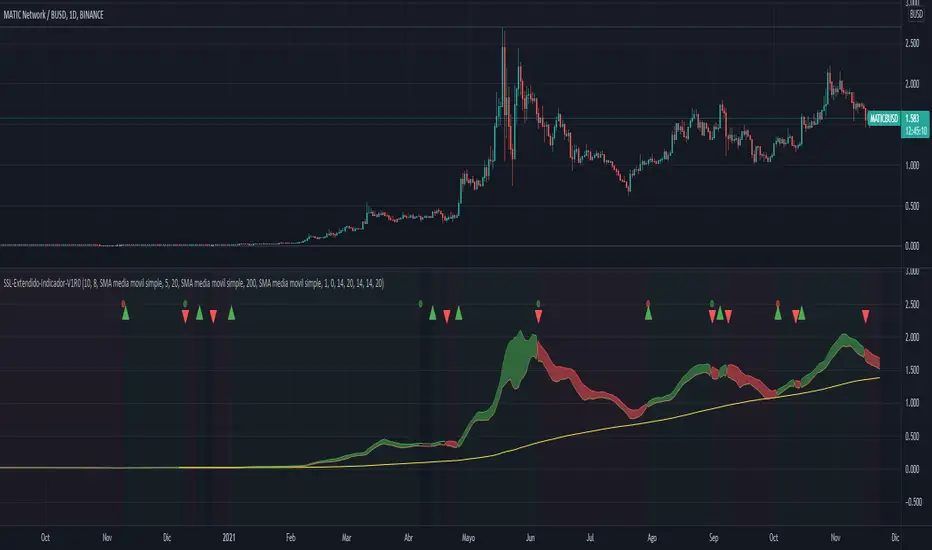
SSL-Extendido-Indicador Por NeilDESCRIPTION
SSL Indicator with ATR, Volume, ADX, TakeProfit, Profit Cycle Indicator and Extended Trend Control.
The component is based on moving averages, its effectiveness is greater in long periods: 4H, 1D, 1S
HOW DOES IT WORK
The component works with a fluctuation band in which the price moves, it consists of an upper moving average of 10 periods and a lower moving average of 8 periods, both configurable according to the volatility of the asset. Since the band has little width, prices trigger buy and sell alerts frequently, but the component has a trend control based on SMA, EMA, VWAP, HMA that allows to take advantage of the intermediate trend of the asset and cancel the early buy alerts and sale, maximizing the development of the parabola, additionally the component allows to confirm the entries with indicators such as: ATR (valatility), Volume and ADX (direction strength), this to achieve entries with a greater probability of success.
WHY USE IT
Its configuration is simple, it requires adjusting few parameters and although it is ideal for long-term operations, it allows periodic take profit, under the philosophy of profit evaluation at present point and not profit evaluation at future point, ensuring income in less time. additionally it has a visual profit indicator, which allows you to graphically see if a money generation cycle (buy or sell) is a winner or a loser, it also allows you to operate according to the general trend of the asset, that is, you can adjust the behavior of the resource to carry out purchase and sale operations or only purchase or only sale. This component not only graphically indicates when to take profit (takeProfit), but it is responsible for closing the current operation and opening a new operation in the same direction. This is the ideal resource for automated alert-based trading against platforms such as 3Commas.
HOW TO USE IT
Press the "Indicators" option, go to the "Public Library" segment, write the name "SSL-Extendido-Indicador por Neil", double-click on the record and it will be added to your work panel, now, all that remains is to configure its parameters and use it. By pressing the Reset Values Option, you will have a basic configuration that respects the fundamental concepts of trading and the use of multiple indicators in a single study.
--
DESCRIPCIÓN
Indicador SSL con ATR, Volume, ADX, TakeProfit, indicador de ciclo de ganancia y control de tendencia extendida.
El componente se basa en medias móviles, su efectividad es mayor en temporalidades largas: 4H,1D,1S
COMO FUNCIONA
El componente trabaja con una banda de fluctuación en la que se mueve el precio, consta de una media móvil superior de 10 periodos y una media móvil inferior de 8 periodos, ambas configurables según la volatilidad del activo. Dado que la banda tiene poca amplitud, los precios gatillan alertas de compra y venta frecuentemente, pero el componente posee un control de tendencia basado en SMA, EMA, VWAP, HMA que permite aprovechar la tendencia intermedia del activo y anular las alertas tempranas de compra y venta, maximizando el desarrollo de la parábola, adicionalmente el componente permite confirmar las entradas con indicadores como: ATR (volatilidad), Volumen y ADX (fuerza de la dirección), esto para lograr entradas con mayor probabilidad de éxito.
POR QUÉ USARLO
Su configuración es simple, requiere ajustar pocos parámetros y aunque es ideal para operaciones de temporalidad larga, permite efectuar take profit periódicos, bajo la filosofía de evaluación de ganancia a punto presente y no evaluación de ganancia a punto futuro, asegurando ingresos en menor tiempo, adicionalmente posee un indicador de ganancia visual, que permite ver gráficamente si un ciclo de generación de dinero (compra o venta) es ganador o perdedor, también permite operar según la tendencia general del activo, es decir que usted puede ajustar el comportamiento del recurso para efectuar operaciones de compra y venta o solo compra o solo venta. Este componente no solo indica gráficamente cuando tomar ganancias (takeProfit), sino que se encarga de cerrar la operación en curso y abrir una nueva operación en la misma dirección. Este es el recurso ideal para efectuar trading automatizado basado en alertas, contra plataformas como 3Commas.
COMO USARLO
Presione la opción "Indicadores", ubíquese en el segmento "Libreria Publica", escriba el nombre "SSL-Extendido-Indicador por Neil", haga doble clic sobre el registro y lo tendrá agregado en su panel de trabajo, ahora, solo resta configurar sus parámetros y usarlo. Presionando la opción Reestablecer Valores, ya tendrá una configuración básica que respeta los conceptos fundamentales del trading y el uso de múltiple de indicadores un un solo estudio.
MACD PlusMoving Average Convergence Divergence – MACD
The MACD is an extremely popular indicator used in technical analysis. It can be used to identify aspects of a security's overall trend. Most notably these aspects are momentum, as well as trend direction and duration. What makes the MACD so informative is that it is actually the combination of two different types of indicators. First, the MACD employs two Moving Averages of varying lengths (which are lagging indicators) to identify trend direction and duration. Then, it takes the difference in values between those two Moving Averages (MACD Line) and an EMA of those Moving Averages (Signal Line) and plots that difference between the two lines as a histogram which oscillates above and below a center Zero Line. The histogram is used as a good indication of a security's momentum.
Added Color Plots to Settings Pane.
Switched MTF Logic to turn ON/OFF automatically w/ TradingView's Built in Feature.
Added Ability to Turn ON/OFF Show MacD & Signal Line.
Added Ability to Turn ON/OFF Show Histogram.
Added Ability to Change MACD Line Colors Based on Trend.
Added Ability to Highlight Price Bars Based on Trend.
Added Alerts to Settings Pane.
Customized Alerts to Show Symbol, TimeFrame, Closing Price, MACD Crosses Up & MACD Crosses Down Signals in Alert.
Alerts are Pre-Set to only Alert on Bar Close.
Added ability to show Dots when MACD Crosses.
Added Ability to Change Plot Widths in Settings Pane.
Added in Alert Feature where Cross Up if above 0 or cross down if below 0 (OFF By Default).
Squeeze Pro
Traditionally, John Carter's version uses 20 period SMAs as the basis lines on both the BB and the KC.
In this version, I've given the freedom to change this and try out different types of moving averages.
The original squeeze indicator had only one Squeeze setting, though this new one has three.
The gray dot Squeeze, call it a "low squeeze" or an "early squeeze" - this is the easiest Squeeze to form based on its settings.
The orange dot Squeeze is the original from the first Squeeze indicator.
And finally, the yellow dot squeeze, call it a "high squeeze" or "power squeeze" - is the most difficult to form and suggests price is under extreme levels of compression.
Colored Directional Movement Index (CDMI) , a custom interpretation of J. Welles Wilder’s Directional Movement Index (DMI), where :
DMI is a collection of three separate indicators ( ADX , +DI , -DI ) combined into one and measures the trend’s strength as well as its direction
CDMI is a custom interpretation of DMI which presents ( ADX , +DI , -DI ) with a color scale - representing the trend’s strength, color density - representing momentum/slope of the trend’s strength, and triangle up/down shapes - representing the trend’s direction. CDMI provides all the information in a single line with colored triangle shapes plotted on the bottom. DMI can provide quality information and even trading signals but it is not an easy indicator to master, whereus CDMI simplifies its usage. The CDMI adds additional insight of verifying/confirming the trend as well as its strength
Label :
Displaying the trend strength and direction
Displaying adx and di+/di- values
Displaying adx's momentum (growing or falling)
Where tooltip label describes "howto read colored dmi line"
Ability to display historical values of DMI readings displayed in the label.
Added "Expert Trend Locator - XTL"
The XTL was developed by Tom Joseph (in his book Applying Technical Analysis ) to identify major trends, similar to Elliott Wave 3 type swings.
Blue bars are bullish and indicate a potential upwards impulse.
Red bars are bearish and indicate a potential downwards impulse.
White bars indicate no trend is detected at the moment.
Added "Williams Vix Fix" signal. The Vix is one of the most reliable indicators in history for finding market bottoms. The Williams Vix Fix is simply a code from Larry Williams creating almost identical results for creating the same ability the Vix has to all assets.
The VIX has always been much better at signaling bottoms than tops. Simple reason is when market falls retail traders panic and increase volatility , and professionals come in and capitalize on the situation. At market tops there is no one panicking... just liquidity drying up.
The FE green triangles are "Filtered Entries"
The AE green triangles are "Aggressive Filtered Entries"

Squeeze Momentum [Plus]The "Momentum" in this indicator is smoothed out using linear regression. The Momentum is what is displayed on the indicator as a histogram, its purpose is obvious (to show momentum).
What is a Squeeze? A squeeze occurs when Bollinger Bands tighten up enough to slip inside of Keltner Channels .
This is interpreted as price is compressing and building up energy before releasing it and making a big move.
Traditionally, John Carter's version uses 20 period SMAs as the basis lines on both the BB and the KC.
In this version, I've given the freedom to change this and try out different types of moving averages.
The original squeeze indicator had only one Squeeze setting, though this new one has three.
The gray dot Squeeze, call it a "low squeeze" or an "early squeeze" - this is the easiest Squeeze to form based on its settings.
The orange dot Squeeze is the original from the first Squeeze indicator.
And finally, the yellow dot squeeze, call it a "high squeeze" or "power squeeze" - is the most difficult to form and suggests price is under extreme levels of compression.
Now to explain the parameters:
Squeeze Input - This is just the source for the Squeeze to use, default value is closing price.
Length - This is the length of time used to calculate the Bollinger Bands and Keltner Channels .
Bollinger Bands Calculation Type - Selects the type of moving average used to create the Bollinger Bands .
Keltner Channel Calculation Type - Selects the type of moving average used to create the Keltner Channel.
Color Format - you to choose one of 5 different color schemes.
Draw Divergence - Self explanatory here, this will auto-draw divergence on the indicator.
Gray Background for Dark Mode - to make them more visually appealing.
Added ADX (Average Directional Index) that measure a trend’s strength. The higher the ADX value, the stronger the trend. The ADX line is white when it has a positive slope, otherwise it is gray. When the ADX has a very large dispersion with respect to the momentum histogram, increase the scale number.
Added "H (Hull Moving Average) Signal". Hull is a extremely responsive and smooth moving average created by Alan Hull in 2005. Have option to chose between 3 Hull variations.
Added "Williams Vix Fix" signal. The Vix is one of the most reliable indicators in history for finding market bottoms. The Williams Vix Fix is simply a code from Larry Williams creating almost identical results for creating the same ability the Vix has to all assets.
The VIX has always been much better at signaling bottoms than tops. Simple reason is when market falls retail traders panic and increase volatility, and professionals come in and capitalize on the situation. At market tops there is no one panicking... just liquidity drying up.
The FE green triangles are "Filtered Entries"
The AE green triangles are "Aggressive Filtered Entries"

(JS) Triple StochasticSo I ended up adding a ton of stuff to my prior Double Stochastic script which you can see here .
The concept of the Double was to smooth out the existing Stochastic by applying a Stochastic to the existing Stochastic (hence the Double). My concept for the Triple Stochastic is much different. It combines a regular stochastic, stochastic RSI, and the double stochastic to get a smoothed output based on all 3.
Also - since I love being able to see a Squeeze (see my Squeeze Pro indicators - Squeeze Pro 2 & Squeeze Pro Overlays ) I added the Squeeze to the Stochastic (the dots). If you're unfamiliar with how a Squeeze works, or what it is, check out my links for explanation. A quick explanation however is that the Squeeze is an indicator that was invented by John Carter that detects price compression before a big move out of a range. This is done by using Bollinger Bands and Keltner Channels, the BB shrink inside the KC. The color of the dots represent the depth of the BB in the KC, white (or black) being the lightest squeeze, red being the standard squeeze, and yellow being the strongest squeeze. Now on to the indicator:
The first thing you'll notice is the options available for the type of Stochastic you'd like to use:
Standard : This is a regular Stochastic
Stochastic RSI : This is the standard Stochastic RSI
Double : This is the Stochastic on top of a Stochastic from the prior version
Triple : This is simply an average of all 3 of the above combined together
(Top indicator shows the Triple Stochastic)
The options "K", "D", and "Smooth" are the settings from a regular Stochastic used to set up the type of Stochastic you choose to use.
Now let's say you're not sure how one type performs compared to another, or you like the quickest momentum change but also like to see the smoothest trend, or you want to use the same types of Stochastic and watch for them to cross like moving averages - for these reasons I added the ability to add a second Stochastic for comparison.
(2nd indicator shows a fast and slow Triple Stochastic together)
Quite obviously, the "K 2", "D 2", and "Smooth 2" are what is used in order to set the parameters for the second Stochastic.
Now another thing I added was the option to replace the regular Stochastic and instead look at the distance between the K and D. By turning off "Use K% and D%" you get to see this in action. To put it simply, a cross above zero would indicate a positive Stochastic crossover, and a cross below zero would represent the opposite. There's also an option titled "SMA Length using Difference" which, to smooth this out a bit, allows you to apply a moving average to the distance. By setting it at 1 you'd see the actual distance between K and D.
(3rd indicator shows the K and D distance used as a plot)
Another thing I wanted to do was add a different type of background that wasn't based on the indicator itself. I decided to use ADX & DMI which is a great way to determine the trend. When you select "ADX/DMI BG" the BG colors will change from being based on the indicator to being based on ADX and DMI.
(The 3rd indicator also shows the ADX/DMI BG being used).
And now finally the last feature I decided to add takes us back to the Squeeze. Essentially it is just the Stochastic shown through the lens of Squeeze momentum, as I ended up plugging the Stochastic output into the Squeeze momentum formula to create an oscillator. By selecting "Use Oscillator" you will see this in action as well.
(Bottom indicator shows the oscillator addition)

DMI+ADX w/ Slope Colour & Fib LevelsThis is a DMI+ADX with colours based on the slope of the plot, with Fibonacci levels.
It makes it easier to see what is happening with a quick glance. I have also added Fib levels as an experiment, but when doing some backtesting they seem to line up reasonably well with past price movements. They can be used to see possible reversal areas, or as thresholds to gauge how strong the trend is. Fibs play a big role in the markets for some reason and I have seen them applied to more than PA with good results, but I know it will not fit into every strategy. The more standard settings for the thresholds are 25,50,75 and you can change them to those if you want, but I suggest taking a look at the Fib version first.
The ADX smoothing is set up for Crypto trading on Mid to High TFs. If you are trading sub 1hour charts I would suggest changing it to 3-4. If you are trading traditional markets it is probably a good idea to have it set somewhere between 6-14 (default is 14), but I am not a professional so please do your own testing and research.
Colours:
ADX going up = Green
ADX going down = Red
DMI+ going up = Bright Aqua
DMI+ going down = Turquoise / Dark Aqua
DMI- going up = Bright Purple
DMI- going down = Dark Purple
(if someone finds a better colour system please let me know as it is tricky to get it looking good without being unicorn puke)
This is my first script and I am just beginning to learn PineScript so somethings may have been done in an unorthodox manner but I believe everything is working as it should, however, I am happy to make any improvements. I'm interested in what people think of the Fib levels on this indicator and would love to hear people opinions and results in the comments.

PpSignal ADX Moving Average Trading in the direction of a strong trend reduces risk and increases profit potential. The average directional index (ADX) is used to determine when the price is trending strongly. In many cases, it is the ultimate trend indicator. After all, the trend may be your friend, but it sure helps to know who your friends are. In this article, we'll examine the value of ADX as a trend strength indicator.
Please watch the next web for more infomation
www.investopedia.com
we managed to reproduce the adx mobile average in the price or overlay chart

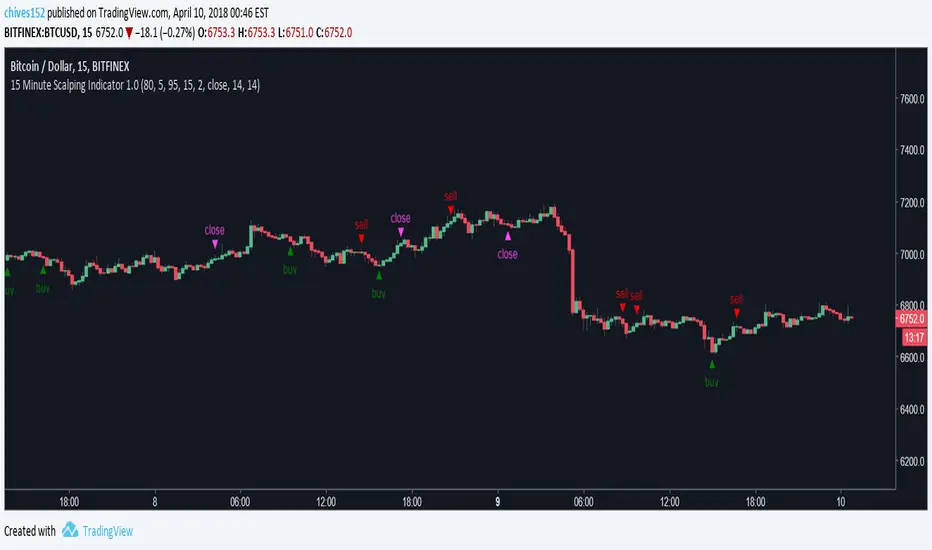
15 Minute Bitcoin Indicator 1.0Indicator Description:
This is a premium indicator that is intended for trading on the 15 minute time scale. This script uses ADX to judge the strength of trends. When a trend is confirmed by ADX, the indicator uses SRSI to find the optimal entry. The indicator works best on BITFINEX:BTCUSD .
Instructions:
Whenever there is a sell signal exit the current long and vice versa. If a close signal appears close the current position but do not open another trade in opposite direction. There is a indicator based stop loss system that is built into the signals, but no static stop loss based on % loss or pips moved in one direction.
Available Settings :
1. Buying and Selling Thresholds: These are the values that are used with SRSI to determine entries. The default values were experimentally determined
to be the most profitable.
2. Stacked Orders Allowed: This limits the amount of positions that can be entered in the same direction. This is useful for trading with leverage. This is defaulted to 2 because I limit myself to 2x leverage. Backtesting shows the more orders allowed, the more profitable, but also risk is increased.
3. ADX/DI Settings: These are settings the ADX smoothing and DI length.
Backtesting:
CLICK HERE
This is a strategy that enters and exits positions on the exact same criteria as this indicator. For the simulation the capital was 10,000 dollars and it was allowed to go up to 2x leverage. Each trade used 100% of available funds. The same simulation done from 1/1/2018 to 4/10/2018 resulted in:
3658.38 % Net Profit
316 Total Closed Trades
77.22 % Profitable
4.552 Profit Factor
24 % Max Drawdown
+11.58% Average Trade
20 15m candles in each trade on average.
Future Plans:
More robust stop loss system.
Factoring trend into trading signals.
EMA integration.
MULTI-TIMEFRAME SUPPORT
Availability
This indicator is currently in a testing stage of development with a full release planned for mid April. While the indicator is not completed, it currently is profitable for me to consider it ready for release. During this testing phase anyone can test it for free for three days, just comment below. Lifetime access currently costs .005 btc, and this price will increase once the full release occurs, if you are interested, DM me for further details.
Please comment with any ideas, suggestions, or criticisms.
Filtered TEMA CrossoverFiltered Dual TEMA Crossover
This indicator is a trend-following tool based on the classic Dual Triple Exponential Moving Average (TEMA) Crossover strategy, enhanced with two robust filters: the Chop Index and the Average Directional Index (ADX).
The TEMA is known for its low lag and high responsiveness, making the crossover an effective signal for trend reversals. However, trading TEMA crossovers during sideways, choppy markets often leads to false signals. This is where the filters come in.
Key Features
▪️Dual TEMA Crossover: Plots two customizable TEMA lines (Fast and Slow) for clear visualization of the primary trend direction.
▪️Intelligent Signal Filtering: Buy and Sell signals are generated only when the market confirms it is in a trending state, thanks to two integrated filters:
➖Chop Index Filter: Blocks signals when the market is detected as sideways or consolidating (Chop Index reading above a user-defined threshold).
➖ADX Filter: Ensures signals are only taken when the trend strength is sufficient (ADX reading above a user-defined minimum threshold).
▪️Customizable Signals: Full control over the signal shapes (Arrows, Triangles, etc.), colors, text, and size.
How to Use It
Use the Filtered Dual TEMA Crossover to enter positions on trend continuation or reversal while dramatically reducing exposure to low-quality, whipsawing signals common in non-trending environments.
Before the filters:
After the filters:
Minimize Noise. Maximize Clarity. Trade the Trend.

Bassi MA Entry Helper MTF EMA , VWMA Swing , ADX , SMA200 , TPBassi MA Entry Helper is an advanced multi-timeframe confluence system designed to identify high-probability entries using trend, volume, market structure, and volatility filters.
It is built for traders who want cleaner signals, fewer false entries, and strong multi-confirmation setups.
Key Features
Multi-Timeframe EMA Crossovers – HTF signal engine
SMA200 Trend Filter – prevents counter-trend trades
VWMA Swing Confirmation – volume-validated micro-swings
ADX Filter – only trade when the trend has strength
Fractal Structure Mapping – identifies swing highs/lows
Retracement Filter – confirms pullbacks before entries
TP/SL Automation – ATR or percentage based
Clean Entry Labels – main & additional entry signals
Highly Customizable – mode, timeframe, filters, visuals
This script is ideal for:
Scalping • Intraday • Swing • Trend continuation • Volume-based setups • Multi-timeframe alignment
How It Works
Main Buy/Sell Signals
Triggered when:
✔ Fast EMA crosses Slow EMA (HTF)
✔ Price aligned with trend
✔ SMA200 filter valid
✔ VWMA confirmation (optional)
✔ ADX strong
✔ Retracement valid (optional)
Additional Buy/Sell Signals
Triggered when VWMA crosses Slow EMA during trend continuation.
TP/SL System
You can choose between:
%-based take-profit & stop-loss
ATR-based dynamic levels
Automatically projects clean visual levels on your chart.
Notes
This indicator does not repaint and is suitable for both real-time and historical analysis.
Always combine signals with proper risk management.
Initial Release – v1.0
Added multi-timeframe EMA engine
Added SMA200 trend filter
Added VWMA swing entries
Added ADX strength filter
Added retracement filter
Added fractal swing detection
Added TP/SL auto plotting
Added main & additional entry labels
Performance optimized

Bassi MACD Pro + ADX Filter + Smart Histogram TP + RSIA professional-grade MACD indicator that dramatically reduces false signals by combining four powerful filters:
Key Features
Classic MACD (12,26,9) with clean, high-visibility histogram coloring
ADX + DI filter – only takes trades when ADX > user-defined threshold (default 25) ensuring you trade only in strong trending markets
Smart Histogram Take-Profit logic – automatically detects the exact moment bullish/bearish momentum starts to weaken after a strong move and marks a precise TP level (one TP per trade – no repainting, no multiple signals)
Zero-line crossover confirmation + histogram direction filter – eliminates many whipsaw signals common in regular MACD
Separate RSI pane with overbought/oversold levels and visual markers (for additional confluence – does not interfere with main logic)
Visual Signals
Green “MACD BUY” label + lime triangle = confirmed long entry in strong trend
Red “MACD SELL” label + red triangle = confirmed short entry in strong trend
Small lime/red “TP” triangles = Smart Histogram Take-Profit triggered (perfect exit timing based on momentum fade)
Alert Conditions Included
MACD BUY
MACD SELL
TP Long Hit
TP Short Hit
Combined “Any Signal” alert
Why this version outperforms standard MACD
Most MACD crossovers fail in ranging markets. This script solves that by:
Requiring strong trend (ADX filter)
Confirming histogram is actually growing in the new direction
Waiting for the true zero-line cross with momentum
Giving you an intelligent, non-fixed % take-profit based on real histogram exhaustion
Excellent for swing trading, day trading, crypto, forex, and stocks on any timeframe (works especially well on 1H–4H–Daily).
Clean, fast, no repainting, fully alert-ready.
Add to chart → set your alerts → trade only the highest-probability MACD signals.

Volume/ADX MarketSession and Economic Calendar Data
Volume / ADX Market Session & Economic Calendar Suite
A multi-asset market intelligence tool combining Volume, ADX/DI trend strength, CVD, VMO, Market Sessions, Divergence, Options Expiry, and a full Forex-Factory Economic Calendar — all auto-adapting to Forex, Oil, Gold, Indices, and Equities.
Key Features
Real-Time Market Sessions
Live-growing session boxes for Sydney, Tokyo, London, New York.
Market Data Dashboard
Cross-asset insights: DXY, VIX, Yields, Oil momentum, Gold ratios, FX trend bias.
Macro Economic Calendar (Forex Factory)
Auto-currency detection, event markers, and alerts before/after events.
CVD (Cumulative Volume Delta)
Real buy/sell pressure + session CVD delta.
Divergence Detection
CVD-based bullish and bearish divergence.
ADX / DI Trend Strength
Strong/weak trend signals with DI cross alerts.
Volume MA Oscillator (VMO)
Volume-based momentum and volatility bands.
Options Expiry Countdown
Auto-detects asset type and shows daily expiry times
(FX 10AM, Gold 1:30PM, Oil 2:30PM, Equity 4PM)
Buy/Sell Score
Grades (A+, A, B, C, D)
Long/Short signal triggers

Camarilla D/W/M, Alerts, TP/SL, ADX, EMA, Volume# Camarilla Levels Pro - Advanced Trading Indicator
## 📊 **Overview**
A sophisticated Camarilla levels indicator with multiple timeframe support, advanced filtering, and comprehensive trading statistics. Designed for professional traders seeking precise entry/exit points with robust risk management.
## 🎯 **Key Features**
### **Multi-Timeframe Camarilla Levels**
- **D/W/M Timeframes**: Calculate levels from Daily, Weekly, or Monthly data
- **Accurate Calculations**: Uses previous period's High, Low, Close for precise level calculation
- **6 Key Levels**: H3, H4, H5 (Resistance) and L3, L4, L5 (Support)
### **Advanced Entry Signals**
- **4 Trading Scenarios**:
- LONG 1: Price crosses above H4 with stop at H3, target at H5
- LONG 2: Price crosses above L3 with stop at L4, target at H3
- SHORT 1: Price crosses below L4 with stop at L3, target at L5
- SHORT 2: Price crosses below H3 with stop at H4, target at L3
### **Smart Filtering System**
- **ADX Filter**: Confirms trend strength (configurable threshold)
- **Volume Filter**: Ensures significant volume participation
- **EMA Filter**: Aligns with trend direction (50-period default)
- **Flexible Combination**: Use any combination of filters
### **Non-Repainting Signals**
- **Signal Protection**: Once triggered, signals don't disappear or repaint
- **Executed Signal Tracking**: Historical record of all filled positions
- **Visual Confirmation**: Clear distinction between potential and executed trades
### **Comprehensive Alert System**
- **Entry Alerts**: Buy/Sell signals with level information
- **Exit Alerts**: TP/SL notifications with profit/loss data
- **Customizable**: Set alerts for specific conditions only
### **Professional Risk Management**
- **Auto TP/SL**: Automatic take-profit and stop-loss levels
- **Position Tracking**: Monitors active trades with real-time P/L
- **Single Position**: Prevents over-trading with one active position rule
### **Advanced Statistics**
- **Trade Analytics**: Total trades, win rate, profitability
- **Performance Metrics**: Total profit %, average trade performance
- **Real-time Monitoring**: Current position status and filter status
- **Visual Table**: Clean statistics display in corner
## ⚙️ **Customization Options**
### **Display Settings**
- Toggle level labels, signals, TP/SL markers, and statistics
- Adjust visual styles and sizes for clarity
- Right-positioned labels to avoid chart clutter
### **Filter Configuration**
- **ADX**: Length (14) and threshold (20) settings
- **Volume**: Period (20) and multiplier (1.2x) adjustment
- **EMA**: Customizable period (50 default)
### **Timeframe Selection**
- Daily levels for intraday trading
- Weekly levels for swing trading
- Monthly levels for position trading
## 📈 **Trading Strategy**
### **Entry Logic**
1. **Breakout Confirmation**: Price must cross and hold beyond level
2. **Filter Validation**: All active filters must pass conditions
3. **Single Position**: No new entries while position is active
### **Exit Logic**
- **Take Profit**: Automatic at calculated target levels
- **Stop Loss**: Automatic at calculated risk levels
- **Visual Feedback**: Green circles for TP, Red X for SL
### **Risk Management**
- Pre-defined risk/reward ratios based on Camarilla mathematics
- No pyramiding or multiple position risks
- Clear visual tracking of active trade parameters
## 🎨 **Visual Features**
- **Clean Level Display**: Gray circles for unobtrusive level marking
- **Signal Markers**: Tiny triangles for executed entries
- **Exit Markers**: Tiny circles (TP) and X (SL) for clear exits
- **Statistics Table**: Professional performance monitoring
- **Right-Aligned Labels**: Prevents chart congestion
## 🔔 **Alert Conditions**
- **Buy Signals**: LONG 1 or LONG 2 conditions met
- **Sell Signals**: SHORT 1 or SHORT 2 conditions met
- **Exit Alerts**: TP or SL hit for both long and short positions
## 💡 **Professional Use Cases**
- **Day Trading**: Use Daily levels with volume filter
- **Swing Trading**: Use Weekly levels with ADX trend confirmation
- **Position Trading**: Use Monthly levels with EMA trend alignment
- **Strategy Testing**: Comprehensive statistics for backtesting
This indicator provides institutional-grade Camarilla analysis with professional risk management tools, making it suitable for traders of all experience levels seeking systematic trading approaches with clear entry/exit rules.

Atlantean Sideways / Range Regime DetectorPurpose
When using trend based indicators, you can skip the false signals when there is a sideways action, protecting you from the false signals.
Flags likely sideways/range phases using three checks:
Weak trend (ADX from DMI)
Price compression (Bollinger Band Width, normalized)
Low volatility (NATR = ATR/Price%)
Logic
isSideways = (ADX < adxThresh) AND (bbNorm < 0.25) AND (NATR < natrMax)
When true: bars + background turn teal and a provisional Range High/Low (rolling rangeWin) is drawn.
Key Inputs
DMI: diLen(22)
Optimized for 15 mins Bitcoin, could change it to 14 for more general approach
ADX: adxSmooth(14), adxThresh(18)
Volatility: lenATR(14), natrMax(1.8)
Visuals: rangeWin(20), bar/range toggles
Quick Tuning
More signals: raise adxThresh to 20–25, raise natrMax to 2.5–4.0, increase BB cutoff by editing bbNorm < 0.25 --> 0.35–0.50.
Smoother range lines: increase rangeWin to 30–40.
Use Cases
Mean reversion inside teal ranges.
Breakout prep when price closes outside the drawn range after teal ends. Could be used as a signal although not suggested.
Filter trend systems: skip trades when sidewaysCond is true. This is the main purpose, for it to be combined with trend based indicators, like Supertrend.
Alert
“Sideways Detected” triggers when isSideways is true.
Script could be expanded upon your requests.

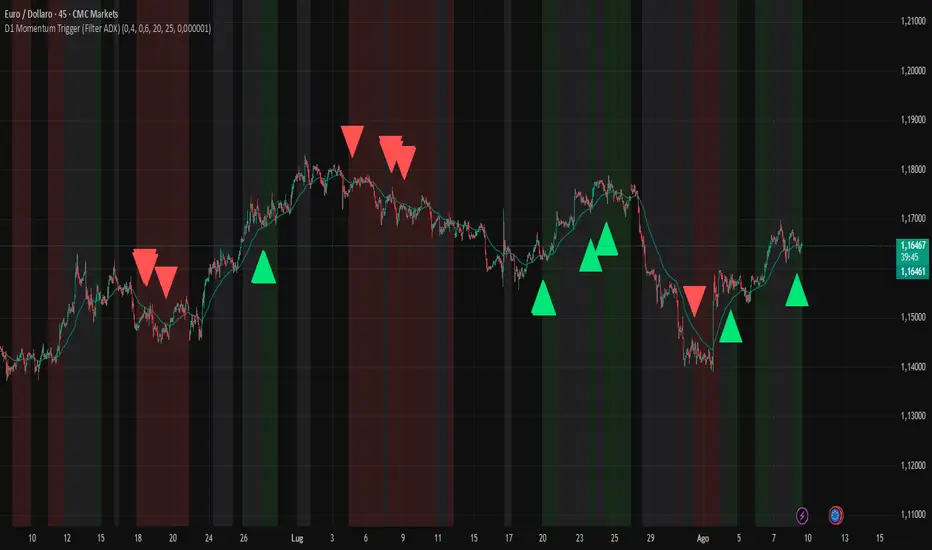
D1 Momentum Trigger (Filter ADX)D1 MOMENTUM TRIGGER + ADX – Added ADX filter to avoid strong trend periods during reversal trades. The ADX period is configurable.
Smart Impulse Exhaustion Finder (ATR + ADX Filter)📌 Purpose
This indicator detects potential exhaustion of strong bullish or bearish impulses at fresh swing highs/lows by combining multiple price action and volatility-based filters.
🧠 How It Works
A signal is triggered only when all core conditions are satisfied:
1. Swing High/Low Detection
Current high (or low) must be the highest (or lowest) over the last Extremum Lookback bars (default: 50).
This ensures the move is significant relative to recent price action.
2. Impulse Confirmation
Price must extend by at least 1 × ATR from the previous swing point.
This filters out minor fluctuations.
3. Exhaustion Conditions (at least 2 out of 3 must be met)
RSI Extreme: RSI > Overbought Level (default: 80) for bearish signals, RSI < Oversold Level (default: 20) for bullish signals.
Volume Spike: Volume > SMA(Volume, Volume SMA Length) × Volume Spike Multiplier.
Candle Wick Rejection: Upper wick ≥ Wick Threshold % for bearish setups, Lower wick ≥ Wick Threshold % for bullish setups.
4. Trend Filter
ADX > ADX Threshold ensures the market is trending and filters out sideways conditions.
5. Candle Body Filter
Candle body must be ≥ Body Size ATR Factor × ATR.
This avoids weak signals from small candles or doji formations.
📈 How to Use
Bearish Signal:
Appears at fresh swing highs with exhaustion conditions met. Useful for tightening stops, taking partial profits, or counter-trend shorts.
Bullish Signal:
Appears at fresh swing lows with exhaustion conditions met. Useful for trailing stops, profit-taking, or counter-trend longs.
Recommended Timeframes: Works best on 1h, 4h, and Daily charts.
Markets: Crypto, Forex, Stocks — wherever volatility and trends are present.
⚙️ Inputs
RSI Length / Overbought / Oversold
Volume SMA Length & Volume Spike Multiplier
Wick Threshold %
Extremum Lookback (bars for highs/lows)
ADX Length & Threshold
Body Size ATR Factor
⚠️ Disclaimer
This script is for educational purposes only and does not constitute financial advice.
Always test thoroughly and apply proper risk management before live trading.
💡 Tip: Combine this tool with your own market context and confluence factors for higher probability setups.

Paul_BDT Osc. MACD, ADX, CHOP, RSI & CVD🔧 Overview
Modular multi-oscillator engine designed for actionable and filtered trading signals. It combines the power of MACD, ADX, CHOP, RSI, and CVD, integrates advanced divergence detection, a multi-timeframe dashboard, and a built-in risk management system.
⸻
🚨 Alert System
Alerts are organized by signal type, oscillator used, and timeframe block, with precision controls for filtering and sensitivity.
1. Oscillator Alerts (Osc.)
Triggers ▲ / ▼ triangle markers based on trend momentum shifts detected on the selected oscillator:
• MACD: triggers when histogram crosses 0 with bullish or bearish slope
• ADX: triggers on directional breakout with increasing trend strength
• CHOP: signals trend resumption after choppy market phase
• RSI: breakout from dynamic support/resistance using pivot detection
• CVD: shift in buy/sell pressure based on aggregated volume delta
✅ All signals optionally trigger on bar close only (if enabled)
2. Divergence Alerts (Div.)
Automatic detection of:
• 🔼 Regular Divergences
• Bullish: Lower lows in price, higher lows in oscillator
• Bearish: Higher highs in price, lower highs in oscillator
• 🔁 Hidden Divergences
• Hidden Bullish: Higher lows in price, lower lows in oscillator
• Hidden Bearish: Lower highs in price, higher highs in oscillator
Alert trigger logic:
• Divergences only trigger if confirmed by price action:
→ breakout from wick or close beyond BB/RSI dynamic bands
• Alerts are non-repeating (fires only on signal change)
🔔 divergeUP and divergeDN are fired when divergence AND price condition are met.
3. Reversal Alerts (Rev.)
Strict combo alert:
• reverseUP = divergeUP AND bullish wick breakout
• reverseDN = divergeDN AND bearish wick breakout
🧠 These are high-conviction signals, ideal for swing entries or reversion trades.
📊 Multi-Timeframe Support (4 Blocks)
4 independent blocks:
• Scalp, Intra, Swing, Custom
• Each block accepts 3 sorted timeframes
• You can individually enable:
• Oscillator alerts
• Divergences
• Reversals
Example:
• Scalp: RSI only, no divergence
• Intra: CVD + reversal only
• Swing: MACD + divergence + reversal
Each timeframe is dynamically sorted and shown in a structured dashboard grid (TF01 to TF12), making the multi-timeframe readout seamless.
⸻
⚙️ Additional Features
• Full visual panel with color-coded trend indicators
• Take Profit/Exit Alerts available on a custom timeframe
• Built-in Money Management:
• % or USD risk
• Configurable R/R ratio
• Minimum PnL threshold (filter out low-return setups)
⸻
✅ Best Use Cases
• High-frequency scalping (1s–1min) with real-time oscillator breakouts
• Structured intraday/swing planning using divergence + reversal logic
• Manual backtesting and alert-based discretionary entries
⸻⸻⸻⸻⸻⸻⸻⸻⸻⸻⸻⸻⸻⸻
🧠 Fonctionnalités
• Oscillateurs personnalisables : activez un indicateur à la fois (MACD, ADX, CHOP, RSI, ou CVD) pour une analyse ciblée et lisible.
• Détection des divergences :
• Divergences classiques (bullish/bearish),
• Divergences cachées (hidden bullish/bearish),
• Filtres avancés pour ne détecter que les signaux pertinents (crossover/crossunder + break de mèche).
• Multi-timeframes :
• Jusqu’à 4 blocs configurables (scalp, intra, swing, custom),
• Tri automatique des UT,
• Alertes différenciées par bloc et par type de signal.
• Visualisation modulaire :
• Tableau de synthèse personnalisable, affichant l’état de chaque indicateur par UT,
• Affichage hors graphique ou directement sur le chart,
• Couleurs dynamiques pour les signaux haussiers, baissiers ou neutres.
• Gestion du risque intégrée :
• Paramétrez le risque en % du capital ou en valeur absolue (USD),
• Ratio risk/reward configurable pour filtrer les signaux,
• Seuil de profit minimum (PnL) configurable pour filtrer les signaux.
• Support de volumes agrégés multi-exchange pour CVD : compatible avec les plateformes crypto (BITGET, BINANCE, etc).
⸻
⚙️ Personnalisation
• Choix du type de moyenne mobile (EMA, RMA, VWAP, etc.).
• Activation sélective des signaux (Oscillateur, Divergence, Renversement) pour chaque bloc de timeframes.
⸻
📈 Alertes intégrées
• Compatibles avec les alertes automatiques de TradingView,
• Détection de signaux d’entrée (achat/vente), divergences, renversements,
• Configuration des alertes par type de signal et par timeframe (scalp/intra/swing/custom).
⸻
🔍 Utilisations recommandées
• Scalping haute fréquence (1s à 1min),
• Intraday en multi-UT (5 à 30min),
• Swing trading (1H à 1D),
• Analyse technique avancée sur crypto, indices, forex ou actions.
⸻
📌 Conclusion
Ce script combine précision algorithmique et flexibilité de personnalisation.

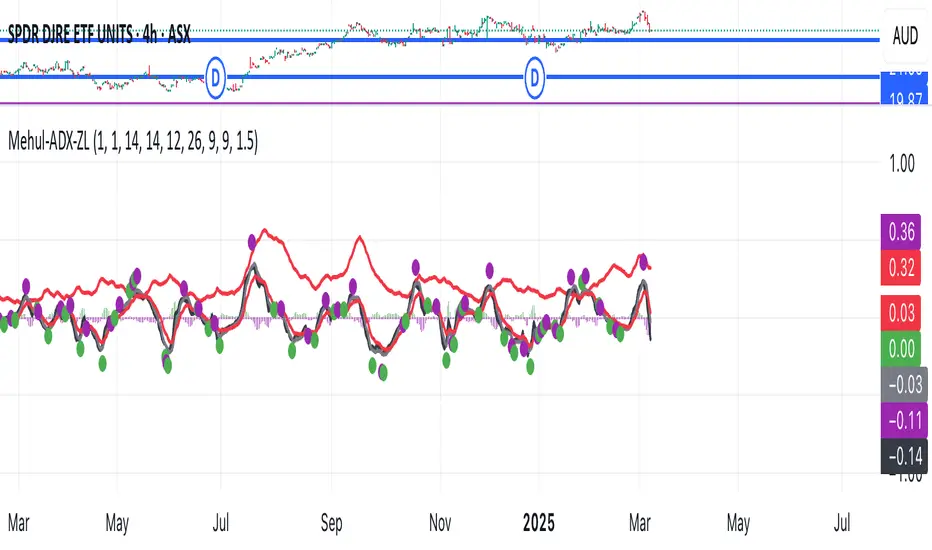
Mehul - ADX Zero LagThis script combines two popular technical indicators into a single visualization:
1. **Average Directional Index (ADX)**:
- Measures trend strength on a scale from 0-100 (now normalized to 0-1 by dividing by 100)
- Displayed as a red line
- Adjustable smoothing and length parameters
2. **Zero Lag MACD (Modified Moving Average Convergence Divergence)**:
- An enhanced version of the traditional MACD with reduced lag
- Shows the relationship between fast and slow moving averages
- Main components include:
- MACD line (black)
- Signal line (gray)
- Histogram (green for positive, purple for negative)
- EMA of the MACD line (red)
- Optional crossing dots
Key features of the combined indicator:
- **Scale Adjustment**: Both indicators can be scaled independently (adxScale and macdScale parameters)
- **Visibility Toggles**: Each indicator can be shown or hidden
- **Advanced Customization**: Parameters for both indicators can be fine-tuned
- **Algorithm Selection**: Option to choose between the "Glaz" algorithm or the "real" zero lag algorithm
- **Display Options**: Toggles for visualization elements like crossing dots
The most significant technical aspect is that both indicators are displayed in the same pane with compatible scaling, achieved by normalizing the ADX values and applying user-defined scale factors to both indicators.
This combined indicator is designed to give traders a comprehensive view of both trend strength (from ADX) and momentum/direction (from Zero Lag MACD) in a single, easy-to-read visualization.
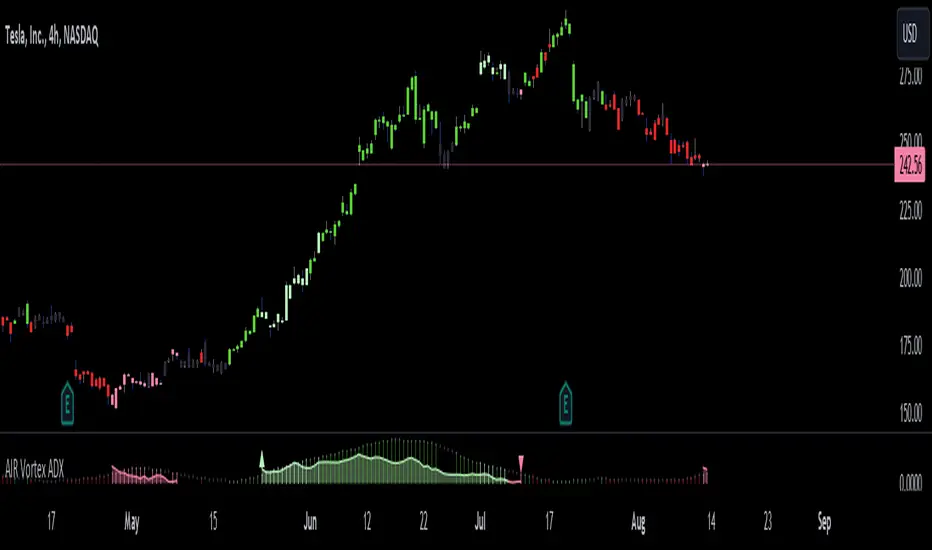
AIR Vortex ADXThis project started as an effort to improve the user interface of the hybrid indicator ADX of Vortex, which is, as per the name, a blend of ADX and Vortex Indicator. Plotting both indicators on the same polarity and normalising the vortex, a better interpretation of the interaction between the two is possible, and trend becomes apparent.
Basically, the Vortex provides the bright punch and ADX the continuation of the trend and momentum.
A range mixer has been added to the vortex, comprising both true and interpercentile ranges (see my previous script for a desrciption of interpercentile range). Users can activate and add amounts of each as they see fit.
Finally, there is an RSI filter, the idea of which is to filter out ranging (flat) markets, where no distinct direction is yet emerging.