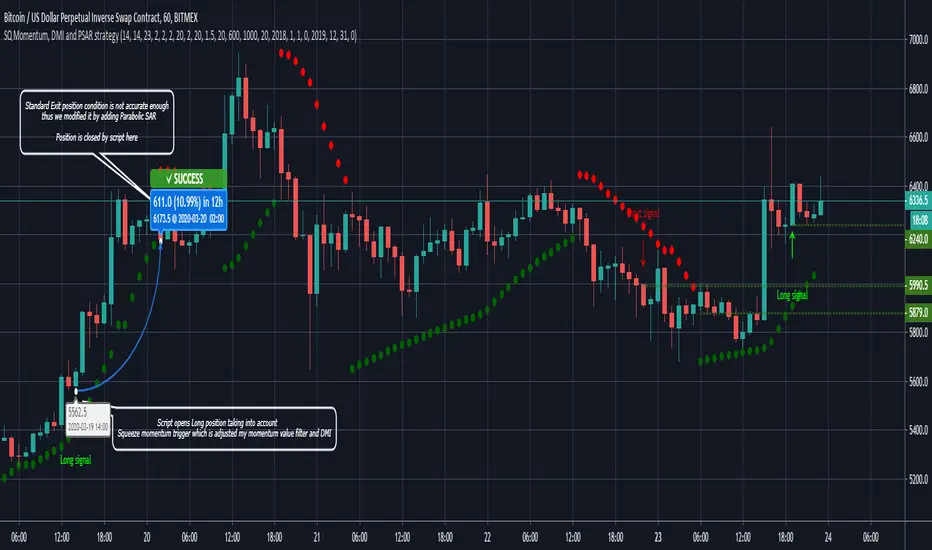
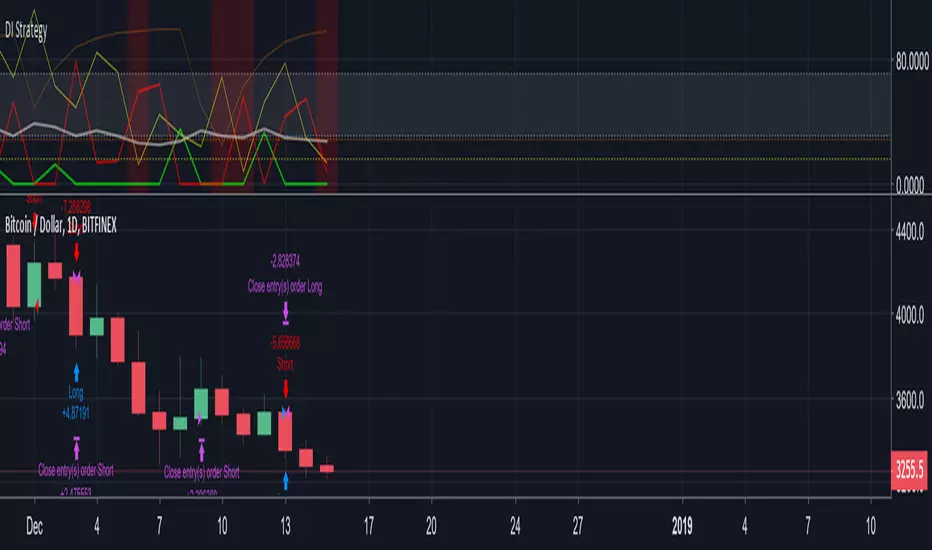
Sqeeze Momentum, DMI and Parabolic SAR strategyThe script combines Sqeeze Momentum, Directional Movement Index (DMI) and Parabolic SAR indicators in long and short scalping strategies
When conditions of long or short position from all mentioned indicators are met script opens position. Once trend changes it closes position and fixes profit
Advantages:
1. Deal start condition includes the folowing filters and requirements:
- Momentum value is adjusted using a relative proportion of volume at each timeframe scale to exclude a chance of opening position at a low impulse stage
- Squeeze momentum trigger condition is automatically checked before a position is opened
- +DI , -DI and ADX values are taken into account to confirm the trend direction
- Position size is taken into account to ensure there will not be opened any excess deals or alerts
2. Exit deal condition was modified using Parabolic SAR indicator. Hence, it is ensured positions will not be closed in a middle of a trend
3. Study is modified into strategy allowing you to use it directly through the trading panel
If you want to obtain access to the strategy please send us a personal message
In den Scripts nach "adx" suchen
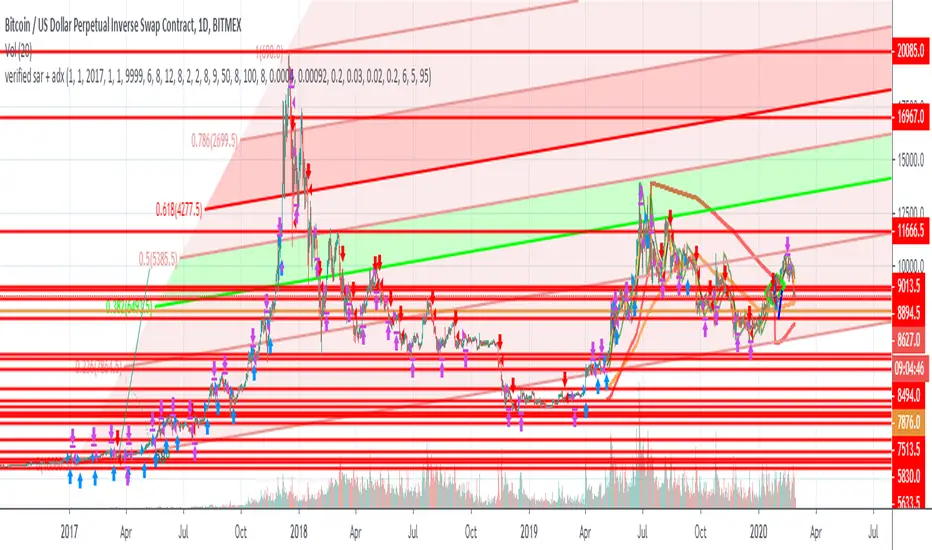
verified sar + adxsimple yet powerful script to get some cash.
use 1d+ timeframes and 0.15x-3x leverage to get full advantage from the market.
add it to favorites and use on your own risk.
The 1h Wick Wicky - Bitcoin BeatsThis script Uses a bunch of different indicators in order to catch wicks.
Included are:
SAR
JME
Range Filter
ADX
RSI
MACD
Automatic Plotted TP
Unconfirmed entries followed by confirmed entries
This is a combination of different indicators therefore the credit shall not go to me but I have changed certain parameters in order to benefit backtesting profitability.
Trade at your own risk!

Combo Backtest 123 Reversal & Directional Trend Index (DTI) This is combo strategies for get a cumulative signal.
First strategy
This System was created from the Book "How I Tripled My Money In The
Futures Market" by Ulf Jensen, Page 183. This is reverse type of strategies.
The strategy buys at market, if close price is higher than the previous close
during 2 days and the meaning of 9-days Stochastic Slow Oscillator is lower than 50.
The strategy sells at market, if close price is lower than the previous close price
during 2 days and the meaning of 9-days Stochastic Fast Oscillator is higher than 50.
Second strategy
This technique was described by William Blau in his book "Momentum,
Direction and Divergence" (1995). His book focuses on three key aspects
of trading: momentum, direction and divergence. Blau, who was an electrical
engineer before becoming a trader, thoroughly examines the relationship between
price and momentum in step-by-step examples. From this grounding, he then looks
at the deficiencies in other oscillators and introduces some innovative techniques,
including a fresh twist on Stochastics. On directional issues, he analyzes the
intricacies of ADX and offers a unique approach to help define trending and
non-trending periods.
Directional Trend Index is an indicator similar to DM+ developed by Welles Wilder.
The DM+ (a part of Directional Movement System which includes both DM+ and
DM- indicators) indicator helps determine if a security is "trending." William
Blau added to it a zeroline, relative to which the indicator is deemed positive or
negative. A stable uptrend is a period when the DTI value is positive and rising, a
downtrend when it is negative and falling.
WARNING:
- For purpose educate only
- This script to change bars colors.

Trading Public School ST1This is a derivative of Trading Public School "TTM Squeeze" volatility indicator, as discussed in his book "Mastering the Trade" (chapter 11).
Black crosses on the midline show that the market just entered a squeeze ( Bollinger Bands are with in Keltner Channel). This signifies low volatility , market preparing itself for an explosive move (up or down). Gray crosses signify "Squeeze release".
Mr.Carter suggests waiting till the first gray after a black cross, and taking a position in the direction of the momentum (for ex., if momentum value is above zero, go long). Exit the position when the momentum changes (increase or decrease --- signified by a color change). My (limited) experience with this shows, an additional indicator like ADX / WaveTrend, is needed to not miss good entry points. Also, Mr.Carter uses simple momentum indicator , while I have used a different method (linreg based) to plot the histogram. 100% Profit & loss 10% Only

That One Indicator (Free) - [Backtester]This Backtester comes with the following indicators:
Bollinger Bands
ADX
Moving Average Trend Confirmation Filter ( EMA , SMA , DEMA , TEMA , WMA , VWMA , SMMA , HullMA, LSMA , ALMA , SSMA, TMA, ZLEMA )
And a few more indicators in the back-end to increase accuracy
This strategy works really well as a scalper on lower Time Frames as well as on higher Time Frames. Besides that you can also trade it on pretty much any coin or asset.
The alerts script is not repainting. We advise to use alerts on “Once Per Bar Close”.
If you’d like to automate this strategy you can do that by using our alerts script with AutoView, ProfitView, ProfitTrailer, CryptoHopper etc.
Alerts are set very clearly as Long and Short to avoid confusion.
Feel free to leave a comment and share it with your friends.

Evaluate this MACD and ADX strategyI'm looking for your scrutinizing eyes to find better ways to implement my strategy. Currently on BTC , I'm able to achieve pretty 400% returns for as little draw downs as 6% with the settings shown below. Please feel free to add to test it and see if you can find better performance!
Example study period: September 1st, 2018 to present (1 year period)
Profit: 400%
Max draw down: 6.3%
No re-draws

🐮 🆚 🐻 [Backtest]It's a remake of the previous script but for use in reverse positions at the same time.
In this script the reality could be even better than the Backtest, because, only close the position with profit, so profitability should be 100%, and Longs and Shorts don't mix because they are independent.
In real trade, you need an exchange that allows you to go in reverse positions at the same time or where you can have two independent sub-accounts: one for long and one for short and with margin trading. Although, if TP is small and does not mix with other inverse positions, it's not necessary. (With this script, you can go long and short at the same time and with independent configurations)
Settings for ETH at 5 minutes. (If you find good settings please comment)
Enjoy!

RePaNoCHa V4 [Backtest]This is the Backtest version of the previous one.
It's important to correctly set the "TICKS / PIPS CORRECTION" parameter in each different chart.
Enjoy!


Direction Power StrategyThis strategy is based on the very well known ADX indicator, some risk management was applied, TP, SLand the most vital, trail stop.
If you have any questions let me know!
Ah, ps. It works better on longer timeframes, tried it also on shorter timeframes but becomes less profitable


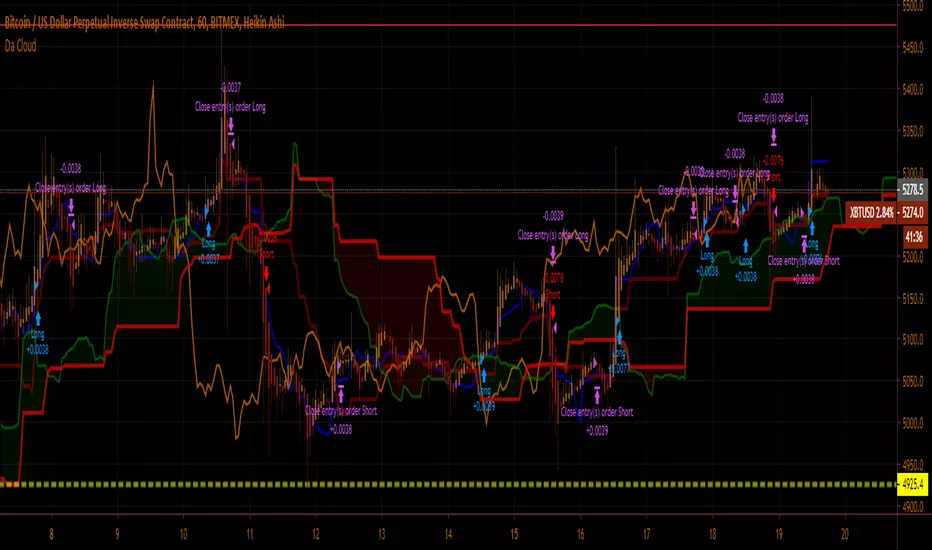
E-Z Hai Cloud v0.01Very Early version of a new script I am working on. Currently setup for one hour but I want it to work well on multiple time frames.
Options for ADX aren't working atm.
Wanting to add take profits and stop losses in the future, as well as the ability for the script to check multiple time frames so it knows to hodl or dump.
Please let me know if you run into any issues.
Hucklekiwi Pip - HLHB Trend-Catcher SystemThe strategy was authored by Hucklekiwi Pip back in 2015 and is still being updated today. She says that the system was designed to simply catch short-term forex trends. At its heart, the system is a simple EMA crossover strategy with a couple of other indicators used for confirming entries.
Strategy Rules
See her original post here:
www.babypips.com
Be sure to check out the updates and tweaks over the years!
HOW TO USE
For full information on how to use this strategy and how to correctly set the exit time, see this post:
backtest-rookies.com

Tangram Bot 2 - SmartbotPrimeira Versão do Script Tangram Bot 2 da Smartbot para tradingview.
A intenção é agilizar e fazer um teste prévio e rápido do setup.
O resultado indicado aqui jamais corresponderá a um resultado real. É apenas uma ferramenta de estudo.
Ainda falta fazer e melhorar a parte de gestão de risco.
Caso queria fazer alguma sugestão ao cógido para melhorar a gestão de risco ou caso tenha encontrado algum erro, favor comunicar.
O tangram bot 2 combina o uso de até dez Indicadores de Análise Técnica com Gerenciamento de Risco (stop gain, stop loss, stop móvel, realização parcial, bloqueio de reversões, lucro máximo por dia e prejuízo máximo por dia) e Filtros Diversos (sentido das operações, uso do after-market, bloqueio de nova entrada após saída, hora inicial e hora final para negociação). São utilizados os indicadores Médias Móveis, HiLo Activator, MACD, ADX, Estocástico, VWAP, IFR, Bandas de Bollinger, Stop ATR e SAR Parabólico

Directional Indicator - Trading Strategy v1.1Trading strategy using:
ADX: D+ and D-
RSI
Historical Volatility
Stop-loss
This Strategy works best on a 12h or 1D time frame, for pairs like BTC-USD or XRP-USD


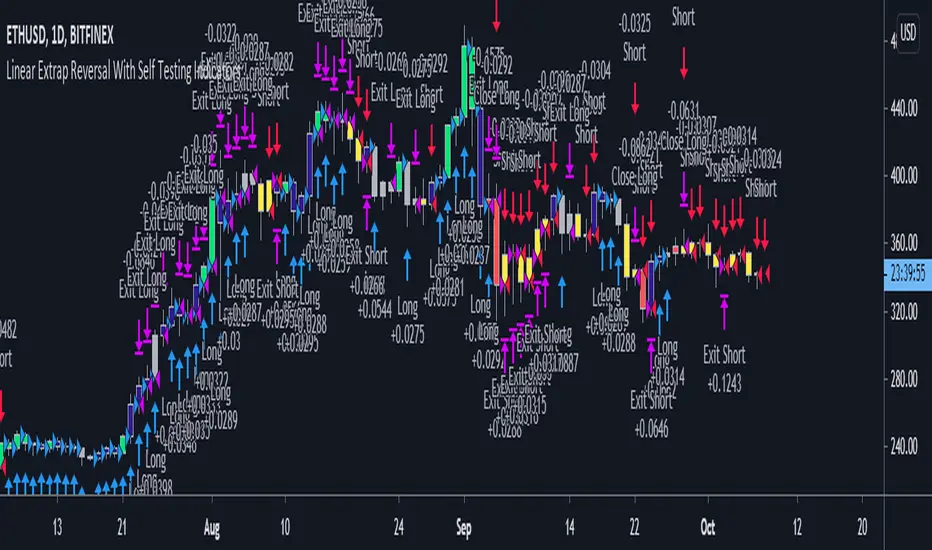
NinetailsVulpix, but now only closing positions when they meet a take profit/stop loss target, and instead the middle red bars are used to reopen positions when in confluence the MA.
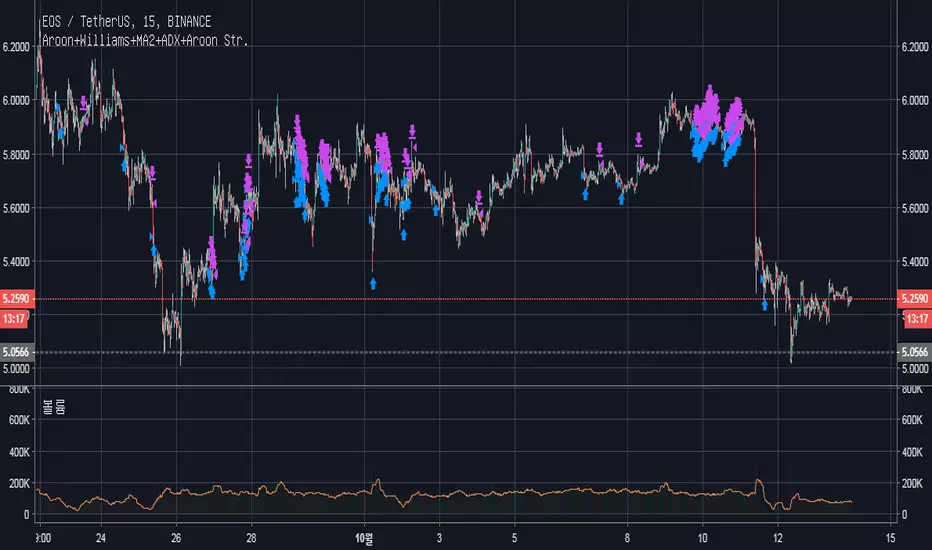
Aroon+Williams+MA2+ADX+Aroon Str.Inspired by the Watchbot strategy which makes about +60% profit in two months.
cafe.naver.com
This is customized to "EOSUSDT, 15 min, Binance" as a default.
I want to add the function for avoiding the recurrence of the trading for 24 ticks(period), but don't know how to yet.