RSI + Psy + ADXRSI + Psychological Line + ADX (with RCI-replacement logic)
This custom TradingView indicator combines three major technical analysis tools—RSI, Psychological Line (Psy), and ADX—to help traders identify trend strength, market momentum, and overbought/oversold conditions with improved clarity.
1. Multi-Period RSI
The indicator calculates three RSI values:
Short-term RSI (9)
Mid-term RSI (26)
Long-term RSI (52)
These help users observe short-, mid-, and long-term momentum simultaneously.
Threshold lines are drawn at 70, 50, and 30 for standard RSI overbought/oversold analysis.
2. Psychological Line (Psy) with Dynamic Column Display
The Psy indicator counts how many closes within the selected period (default: 12) were higher than the previous close.
Values above 75 indicate overbought markets.
Values below 25 indicate oversold markets.
When Psy crosses these thresholds, it is displayed as a column chart centered at 50, visually expanding upward (overbought) or downward (oversold).
3. ADX Trend Strength with Color Coding
ADX is calculated from DI+ and DI− values (using true range and directional movement).
The ADX line changes color based on trend strength:
Blue: Weak trend (below 20)
Yellow: Moderate trend (20–30)
Red: Strong trend (above 30)
This helps traders easily recognize when the market transitions from low-volatility to strong-trend conditions.
In den Scripts nach "adx" suchen

TCP DMITCP DMI - Advanced Technical Indicator
This advanced DMI (Directional Movement Index) indicator enhances the traditional DMI by adding intelligent dynamic support and resistance levels based on historical price action analysis.
KEY FEATURES:
1. Standard DMI Components:
- DI+ (Directional Indicator Positive): Measures upward price movement
- DI- (Directional Indicator Negative): Measures downward price movement
- ADX (Average Directional Index): Measures trend strength
- Middle line at 20 for reference
2. Dynamic Support & Resistance Levels:
The indicator automatically identifies the most significant support and resistance levels by analyzing the last 400 candles (customizable) and detecting where DI lines have been rejected most frequently.
TWO TIERS OF LEVELS:
A) Normal Levels (Solid Lines):
- Support: Below 15
- Resistance: Above 25
- Style: Solid lines with 60% transparency
- These represent moderate support/resistance zones
B) Strong Levels (Dashed Lines):
- Strong Support: Below 10
- Strong Resistance: Above 30
- Style: Dashed lines with 40% transparency (more visible)
- These represent critical support/resistance zones
3. Intelligent Display Logic:
- When DI is ABOVE 20: Shows resistance levels (where price might face selling pressure)
- When DI is BELOW 20: Shows support levels (where price might find buying support)
- Each DI line (+ and -) has its own color-coded support/resistance levels for easy identification
4. Color Coding:
- DI+ levels use GREEN (customizable)
- DI- levels use RED/ORANGE (customizable)
- Support/Resistance lines match their respective DI colors but with reduced opacity
- This makes it instantly clear which DI the support/resistance belongs to
5. Rejection Detection Algorithm:
The indicator scans historical data to find peaks and troughs at specific levels, counting how many times price was rejected at each level. The level with the most rejections becomes the displayed support or resistance.
CUSTOMIZABLE PARAMETERS:
- ADX Smoothing: Default 14
- DI Length: Default 14
- Lookback Period: 400 candles (range: 50-500)
- Line Length: 15 candles forward + 15 candles back = 30 candle span
- DI+ Color: Customizable (default green)
- DI- Color: Customizable (default red)
- ADX Color: Customizable (default blue)
- Normal S/R Transparency: Default 60%
- Strong S/R Transparency: Default 40%
HOW TO USE:
1. Trend Identification:
- When DI+ crosses above DI-: Potential uptrend
- When DI- crosses above DI+: Potential downtrend
- ADX above 25: Strong trend
- ADX below 20: Weak trend or ranging market
2. Support/Resistance Trading:
- Watch for price reaction when DI approaches displayed support/resistance levels
- Solid lines = moderate levels
- Dashed lines = strong levels (more significant)
- The more rejections at a level, the more significant it becomes
3. Entry/Exit Signals:
- Entry: When DI bounces off support (below 20) or resistance (above 20)
- Exit: When DI breaks through major support/resistance levels
- Strong levels (dashed) are more reliable for major decisions
ADVANTAGES:
✓ Reduces chart clutter by only showing relevant levels based on current DI position
✓ Automatically adapts to changing market conditions
✓ Color-coded for instant visual recognition
✓ Two-tier system helps prioritize trading decisions
✓ Historical rejection analysis provides data-backed levels
✓ Fully customizable to match any trading style
BEST USED FOR:
- Swing trading
- Trend following
- Support/resistance trading strategies
- Identifying potential reversal zones
- Confirming breakout validity
- Risk management (stop-loss placement)
This indicator combines the power of traditional DMI with smart support/resistance detection, giving traders a comprehensive tool for technical analysis without overwhelming the chart with excessive information.

Camarilla Trading - D/W/M, Alerts, TP/SL, ADX, VWAP/EMA, VolumeCamarilla Trading System
Overview
This advanced Pine Script indicator implements a comprehensive Camarilla trading system with multiple filtering mechanisms, position management, and real-time statistics. It's designed for day traders and swing traders using Camarilla pivot levels with enhanced confirmation filters.
Key Features
🎯 Core Components
- Camarilla Levels: Calculates H3, H4, H5, L3, L4, L5 pivot levels from previous period data
- Multi-Timeframe Support: Daily (D), Weekly (W), and Monthly (M) timeframe options
- Smart Position Management: Automated entry/exit with take profit and stop loss levels
📊 Advanced Filtering System
- ADX Filter**: Optional trend strength filter using Average Directional Index
- Volume Filter**: High-volume confirmation with customizable multiplier
- Trend Filter**: VWAP or EMA-based trend direction confirmation
💹 Trading Signals
Long Entries:
- Condition 1: Open crosses above H4 (below H5)
- Condition 2: Open crosses above L3 (below H3)
Short Entries:
- Condition 1: Open crosses below L4 (above L5)
- Condition 2: Open crosses below H3 (above L3)
📈 Visual Features
- Level Display: Clear plotting of all Camarilla levels
- Signal Markers: Visual entry/exit signals on chart
- Volume Coloring: Bars colored lime/purple during high-volume periods
- Trend Indicators: Colored VWAP/EMA lines based on ADX trend direction
- Real-time Statistics: Performance table with win rate, P&L, and trade metrics
⚙️ Customization Options
- Toggle individual filters on/off
- Adjustable parameters for all indicators
- Customizable display options
- Flexible timeframe selection
🔔 Alert System
- Buy/Sell signal alerts
- Position exit alerts
- Customizable alert conditions
📊 Performance Tracking
- Automatic trade statistics
- Win rate calculation
- Average profit per trade
- Total P&L tracking
- Trade history from start date
Input Parameters
Timeframe & Levels
- Timeframe levels: D/W/M selection for pivot calculations
- Show levels labels: Toggle level price labels
Filter Settings
- ADX filter: Enable/disable trend strength filter
- ADX length/treshold: Customize ADX parameters
- Volume filter: High-volume confirmation
- Volume length/multiplier: Volume MA settings
- Trend filter: VWAP/EMA trend confirmation
- EMA length: EMA period for trend filter
Display Options
- Show signals: Display entry/exit markers
- Show TP/SL: Show take profit/stop loss levels
- Show statistics: Performance table display
- Colored bars: Volume-based bar coloring
Usage Notes
- Non-repainting: Signals are fixed at bar open price
- Multi-timeframe: Uses security calls for accurate previous period data
- Position Management: Automated TP/SL based on Camarilla levels
- Risk Management: Built-in trading time restrictions
This system provides institutional-grade Camarilla trading with professional risk management features suitable for both manual trading and strategy development.

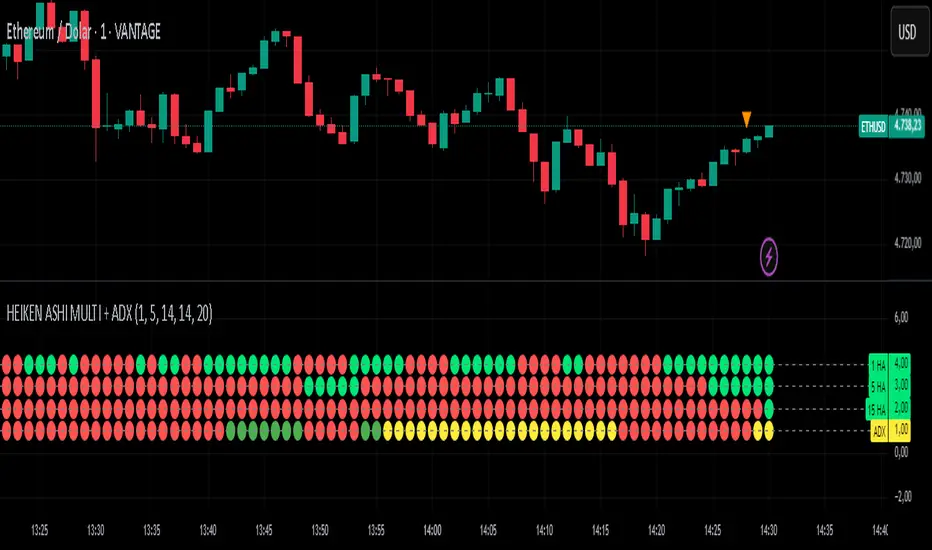
HEIKEN ASHI MULTI + ADXDescription:
This custom indicator combines multiple Heiken Ashi blocks and ADX (Average Directional Index) to provide a comprehensive market analysis tool within a single time frame. It is designed to assist traders in identifying potential buy and sell signals based on Heiken Ashi trends and trend strength.
Key Features:
Multiple Heiken Ashi Blocks:
1-Minute Heiken Ashi: Displays trends in a very short time frame, ideal for scalping strategies.
5-Minute Heiken Ashi: Offers a balanced view for day traders looking for medium-term trends.
15-Minute Heiken Ashi: Provides insights into slightly longer-term trends, helping to confirm signals from shorter time frames.
ADX Functionality:
The ADX line measures the strength of the trend. It helps traders identify whether the market is trending or ranging.
Configurable settings for the ADX period and threshold allow users to tailor this tool to their specific trading style.
Customizable Appearance:
Users can customize the visibility of the Heiken Ashi blocks and ADX plot.
Dot thickness and colors can be adjusted to fit user preferences visually.
Signal Alerts:
Provides alerts when all indicators align (green for buy, red for sell), ensuring traders don't miss significant market opportunities.
Alerts are triggered only on changes to prevent repetitive notifications.
Usage:
Use this indicator for day trading, scalping, or even swing trading strategies by analyzing multiple time frames concurrently.
Customize the settings to suit your trading style for the best results.
How to Use:
Add the indicator to your chart on TradingView.
Configure the settings according to your trading preferences.
Monitor the signals generated by the alignment of the Heiken Ashi blocks and ADX.
Set alerts to be notified of potential trading opportunities based on the indicator's signals.
This indicator is perfect for traders looking for a consolidated view of market trends with a focus on Heiken Ashi candlesticks and trend strength.
Disclaimer:
This indicator is for educational purposes only and should not be construed as financial advice. Always conduct your own research before making trading decisions.
Capiba Directional Momentum Oscillator (ADX-based)
🇬🇧 English
Summary
The Capiba ADX is a momentum oscillator that transforms the classic ADX (Average Directional Index) into a much more intuitive visual tool. Instead of analyzing three separate lines (ADX, DI+, DI-), this indicator consolidates the strength and direction of the trend into a single histogram that oscillates around the zero line.
The result is a clear and immediate reading of market sentiment, allowing traders to quickly identify who is in control—buyers or sellers—and with what intensity.
How to Interpret and Use the Indicator
The operation of the Capiba ADX is straightforward:
Green Histogram (Above Zero): Indicates that buying pressure (DI+) is in control. The height of the bar represents the magnitude of the bullish momentum. Taller green bars suggest a stronger uptrend.
Red Histogram (Below Zero): Indicates that selling pressure (DI-) is in control. The "depth" of the bar represents the magnitude of the bearish momentum. Lower (more negative) red bars suggest a stronger downtrend.
Zero Line (White): This is the equilibrium point. Crossovers through the zero line signal a potential shift in trend control.
Crossover Above: Buyers are taking control.
Crossover Below: Sellers are taking control.
Reference Levels (Momentum Strength)
The indicator plots three fixed reference levels to help gauge the intensity of the move:
0 Line: Equilibrium.
100 Line: Signals significant directional momentum. When the histogram surpasses this level, the trend (whether bullish or bearish) is gaining considerable strength.
200 Line: Signals very strong directional momentum, or even potential exhaustion conditions. Moves that reach this level are powerful but may also precede a consolidation or reversal.
Usage Strategy
Trend Confirmation: Use the indicator to confirm the direction of your analysis. If you are looking for long positions, the Capiba ADX should ideally be green and, preferably, rising.
Strength Identification: Watch for the histogram to cross the 100 and 200 levels to validate the strength of a breakout or an established trend.
Entry/Exit Signals: A zero-line crossover can be used as a primary entry or exit signal, especially when confirmed by other technical analysis tools.
Acknowledgements
This indicator is the result of adapting knowledge and open-source codes shared by the vibrant TradingView community.
Trend State ADX-DI v6This indicator combines the classic ADX (Average Directional Index) and DI+ / DI– (Directional Indicators) with a modern, easy-to-read visual approach. It highlights trend strength and direction directly on your chart background:
✅ Bullish Trend – DI+ crosses above DI– with ADX above threshold
✅ Bearish Trend – DI– crosses above DI+ with ADX above threshold
✅ Choppiness – ADX below threshold, indicating sideways or weak trend
✅ Transition – Optional highlight for periods near the threshold, signaling a potential trend change
Plots for ADX, DI+, and DI– help you track trend momentum, while customizable background colors make it easy to spot trading conditions at a glance. Alerts included for bullish and bearish trend signals.
Perfect for day traders and swing traders looking to identify strong directional moves and avoid choppy markets.
Created by ThomasO_777, updated for Pine Script v6 by ChatGPT.

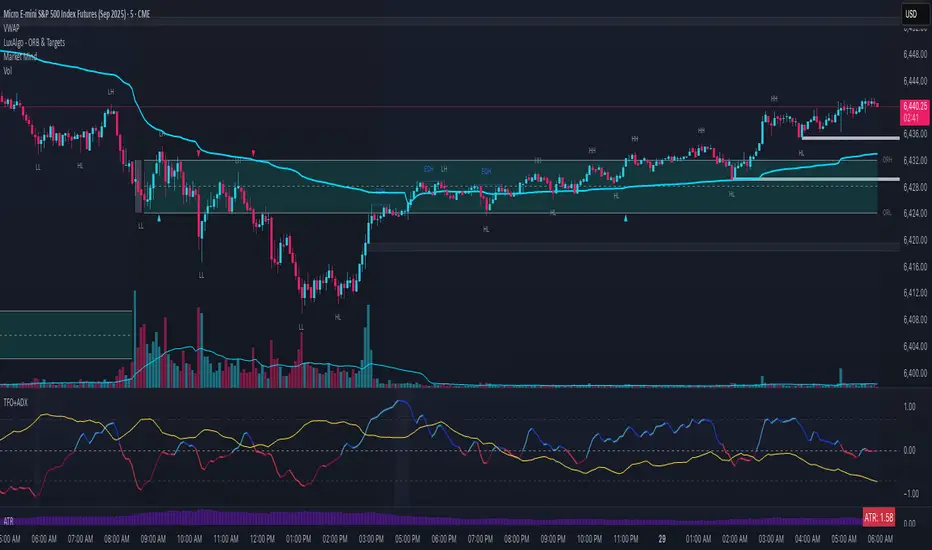
Trend Flow Oscillator (CMF + MFI) + ADX## Trend Flow Oscillator (TFO + ADX) Indicator Description
The Trend Flow Oscillator (TFO+ADX) combines two volume-based indicators, Money Flow Index (MFI) and Chaikin Money Flow (CMF), along with the Average Directional Index (ADX) into one comprehensive oscillator. This indicator provides traders with insights into momentum, volume flow, and trend strength, clearly indicating bullish or bearish market conditions.
### How the Indicator Works:
1. **Money Flow Index (MFI)**:
* Measures buying and selling pressure based on price and volume.
* Scaled from -1 to +1 (where positive values indicate buying pressure, negative values indicate selling pressure).
2. **Chaikin Money Flow (CMF)**:
* Evaluates money flow volume over a set period, reflecting institutional buying or selling.
* Also scaled from -1 to +1 (positive values suggest bullish accumulation, negative values bearish distribution).
3. **Average Directional Index (ADX)**:
* Measures trend strength, indicating whether a market is trending or ranging.
* Scaled from -1 to +1, with values above 0 suggesting strong trends, and values near or below 0 indicating weak trends or sideways markets.
* Specifically, an ADX value of 0 means neutral trend strength; positive values indicate a strong trend.
### Indicator Levels and Interpretation:
* **Zero Line (0)**: Indicates neutral conditions. When the oscillator crosses above zero, it signals increasing bullish momentum; crossing below zero indicates bearish momentum.
* **Extreme Zones (+/- 0.75)**:
* Oscillator values above +0.75 are considered overbought or highly bullish.
* Oscillator values below -0.75 are considered oversold or highly bearish.
* The indicator features subtle background shading to visually highlight these extreme momentum areas for quick identification.
* Shading when values above or below the +/-1.0 level.
* **Color Coding**:
* Bright blue indicates strengthening bullish momentum.
* Dark blue signals weakening bullish momentum.
* Bright red indicates strengthening bearish momentum.
* Dark maroon signals weakening bearish momentum.
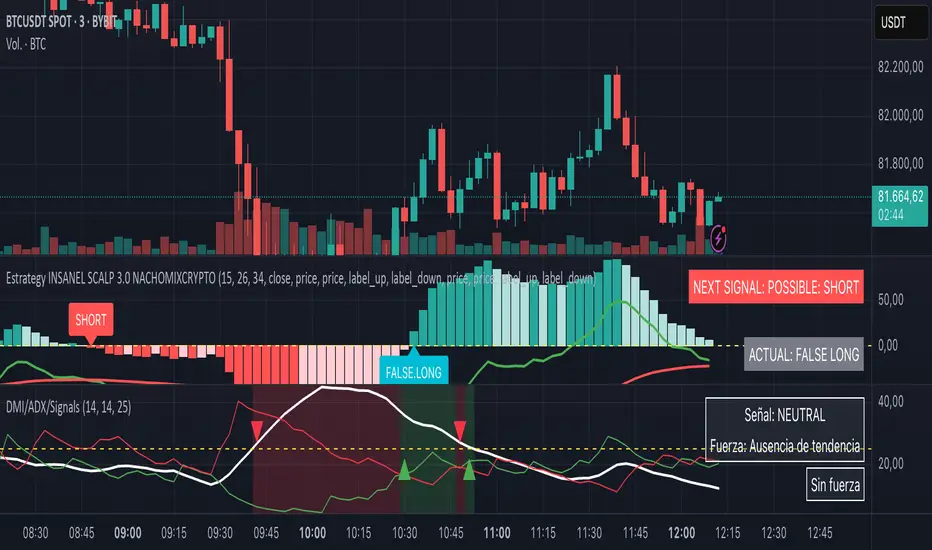
DMI + ADX + Key Level NACHOMIXCRYPTOThe DMI + ADX + Key Level NACHOMIXCRYPTO indicator is a technical analysis tool that combines the Directional Movement Index (DMI) and the Average Directional Index (ADX) to assess trend strength and direction. It also includes customizable key levels for better visualization.
Components:
ADX (Average Directional Index):
Measures the strength of a trend, regardless of its direction.
Values below 25 indicate a weak trend or range-bound market.
Values between 25-50 suggest a strong trend.
Values between 50-75 indicate a very strong trend.
Values above 75 represent an extremely strong trend.
+DI (Positive Directional Indicator) and -DI (Negative Directional Indicator):
+DI indicates bullish strength, shown in green.
-DI indicates bearish strength, shown in red.
The comparison between these two lines helps determine the market direction.
Features:
Trend Detection:
When +DI is above -DI and ADX is above the key level, it signals a bullish trend.
When -DI is above +DI and ADX is above the key level, it signals a bearish trend.
Key Level Line:
A customizable horizontal line that marks the threshold for trend strength.
Trend Background Color:
Green for strong uptrends and red for strong downtrends.
Signal Arrows:
A green upward triangle is plotted when a new bullish trend starts.
A red downward triangle is plotted when a new bearish trend starts.
Trend Strength Labels:
The indicator displays the current market strength classification and whether the trend is bullish, bearish, or neutral.
Strength Analysis Table:
Provides insights on whether the market has bullish, bearish, mixed strength, or no strength at all.
This indicator is particularly useful for traders looking to identify strong trends and catch early trend reversals.
Cuban's Pair Trading IndexThe purpose of this indicator is to visually simplify the relationship between two assets when searching for pair trades or higher beta opportunities.
With highly correlated pairs, it can be a blessing or a curse during volatility when you're somehow stuck in the only lower beta pairs, or maybe you're market neutral and the wrong leg starts nuking.
This indicator was built as a visual way to track pair relationships.
Fundamentally, this script does the following:
Plots the relative performance of the relationship between two assets across multiple time horizons
Uses a consistent measurement of historical performance, regardless of asset -- currently standard deviations, may add log difference in the future
Plots a custom Average Directional Index on the current chart ticker for current asset contextual momentum
Plots the average 'rotation' of both the ADX and Pair Delta independently, over n numbers of rotations -- able to be specified using the 'Rotation Lookback' variable
If you've never pair traded crypto before (i.e. long $DYDX, short $ETH), you might not be aware that most highly correlated alt asset returns tend to oscillate on a low timeframe rolling basis around the performance of the majors -- and more recently, predominantly $ETH. With this in mind and using this oscillator, we can track that relationship.
Users are given the ability to adjust the following:
Comparison Asset
Fast and Slow Delta Lookbacks
Whether to wait for one bar delay during security calls
Rotation Lookback
Rotation Threshold for Pair Delta and ADX independently
ADX Lookback
Whether to utilize the ADX on the current chart ticker or also net that off against the ADX of the comparison asset
TO DO:
Aesthetic update to Pair Delta plot
Permanent fix for security call forced delay

VHF Adaptive ADXm [Loxx]VHF Adaptive ADXm is a variation of the ADX DI indicator with adaptive filtering using a vertical horizontal filter.
What is ADXm?
Unlike the traditional ADX indicator, where the ADX itself is plotted in absolute units and detection of the trend direction is hindered, this indicator clearly displays the positive and negative ADX half-waves (displayed as colored on the chart). And the DI+/- signals are displayed as their difference (gray).
The method of using this indicator is the same as the traditional one.
In addition, it displays the levels (dashed), above which the market is considered to be in a trend state. This level is usually set to approximately 20-25 percents--somewhat depends on the time frame it is used on.
What is VHF Adaptive Cycle?
Vertical Horizontal Filter (VHF) was created by Adam White to identify trending and ranging markets. VHF measures the level of trend activity, similar to ADX DI. Vertical Horizontal Filter does not, itself, generate trading signals, but determines whether signals are taken from trend or momentum indicators. Using this trend information, one is then able to derive an average cycle length.
Included:
Bar coloring
Alerts
Signal types: zero-line crosses, level crosses, or signal crosses

SSL HYBRID AdvancedSSL HYBRID Advanced
SSL Hybrid is an Advanced version of the default SSL Hybrid by Mihkel00.
Multiple Indicators
MACD Crossover Signals
EMA 200
Bollinger Band
Bollinger Band Squeeze
ADX Crossover and ADX level
CCI Over Brought /Sold
Stochastic Over Brought /Sold
RSI Over Brought /Sold
CREDITS
QQE MOD byMihkel00
SSL Hybrid by Mihkel00
Waddah Attar Explosion by shayankm
Support Resistance LonesomeTheBlue
Indicators On Chart
QQE MOD is plotted as Dot below and above the candle and also as Background
QQE line is plotted and can be used as crossover to find trend. Flat movement of QQE is Sideways
Weak ADX is plotted as a Background color. Same can be verified using Bollinger band Squeeze.
EMA crossover can be plotted by selecting MTF MA(multi time frame moving average indicator) Area plot is provided.
CCI , Stochastic, RSI signals provided in the table option
WAE (volume indicator ) is shown in Table
EMA 200 is plotted and color Represents ADX level and direction. Plots on EMA 200 are ADX crossovers
MACD crossovers are represented by Triangles above and below Candles
Support Resistance levels are plotted (change settings)
Pivot Points are plotted (change settings)
Bollinger Bands Plotted
EMA 20 and EMA 50 plotted with AREA for additional confirmation
Buy: When the table option shows completely Blue signals in all indicators
Sell: When the table option shows completely Pink signals in all indicators
WARNING not recommended for lower time frames. Use at your own Risk.
Updates will be released shortly if any. please provide your suggestions to make it more functional indicator.

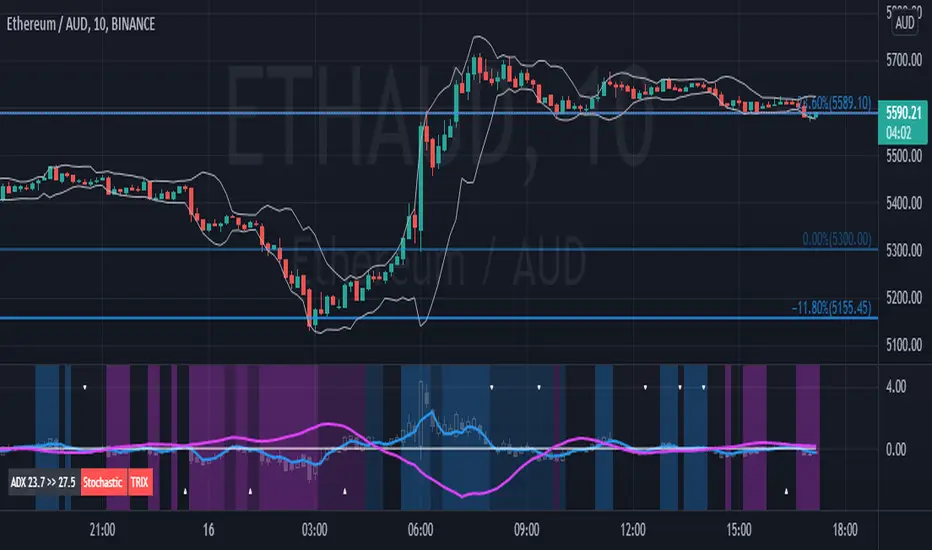
Didi Index PlusAbout this indicator (translation to Portuguese on the second half of the description):
The indicator follows the way Didi Aguiar teaches his trading system. Didi Aguiar is an old school Brazilian trader with over 40 years experience, who created the Didi Index and the famous agulhadas - or how I like to say in English: threads in the needle, an explosive price movement.
This version of the Didi Index adds what matters about DMI/ADX, Stochastic and TRIX to the regular Didi Index indicator.
The lines indicate alert and confirmations:
BLUE line crossing UP white line - BUY alert
PINK line crossing DOWN white line - BUY confirmation
Simultaneous Buy Alert and Confirmation = BUY AGULHADA.
BLUE line crossing DOWN white line - SHORT alert
PINK line crossing UP white line - SHORT confirmation
Simultaneous Short Alert and Confirmation = SHORT AGULHADA.
The background color changes according to the way Didi Aguiar reads the DMI and ADX.
Blue = Up trend
Bright Blue = Accelerating up trend
Purple = Down trend
Bright Purple = Accelerating down trend
Change from bright to dark color = ADX's bounce.
No coloured background = no trend.
The triangles on the top and bottom of the chart are the exit indicators.
They appear every time the Fast Stochastic and TRIX are in agreement:
Triangle on TOP of the chart means to EXIT LONG position.
- TRIX is selling and Stochastic just gave the sell signal; OR
- Stochastic is selling and TRIX just gave the sell signal
Triangle on BOTTOM of the chart means to EXIT SHORT position.
- TRIX is buying and Stochastic just gave the buy signal; OR
- Stochastic is buying and TRIX just gave the buy signal
Use this indicator with Bollinger Bands or other volatility indicator.
Not recommended for color-blind people :)
-----------------------------------------
Esse indicador segue a maneira que Didi Aguiar ensina o seu "trading system". Didi Aguiar é um trader velha-guarda com mais de 40 anos de experiência, que criou o Didi Index e as famosas Agulhadas, um movimento the preço explosivo.
Essa versão do Didi Index inclui o que interessa sobre outros três indicadores que o Didi usa em seu sistema: DMI/ADX, TRIX, e Estocástico.
As linhas indicam alerta e confirmação para o trade:
Linha AZUL cruzando a linha branca de BAIXO PARA CIMA - Alerta de compra
Linha ROSA cruzando a linha branca de CIMA PARA BAIXO - Confirmação de compra
ALERTA e CONFIRMAÇÃO de compra simultaneos = AGULHADA DE COMPRA
Linha AZUL cruzando a linha branca de CIMA PARA BAIXO - Alerta de venda
Linha ROSA cruzando a linha branca de BAIXO PARA CIMA - Confirmação de venda
ALERTA e CONFIRMAÇÃO de cenda simultaneos = AGULHADA DE VENDA
A cor do fundo muda de acordo com a maneira que o Didi lê o DMI e ADX
Fundo AZUL = Tendencia de compra
Fundo ROXO = Tendencia de venda
Cor mais saturada (vibrante) = Tendencia acelerante
Passou de cor mais clara para mais escura = Kick do ADX
Sem coloração de fundo = Sem tendencia
Os triângulos brancos na parte de cima e de baixo do indicador sinalizam a saida do trade.
Aparecem todas a vezes que o Etocastico e o TRIX ficam de acordo.
Triangulo na parte de CIMA sinaliza a SAÍDA da COMPRA.
- TRIX está vendido e o Estocástico acabou de vender; OU
- Estocástico está vendido e o TRIX acabou de vender
Triangulo na parte de BAIXO sinaliza a SAÍDA da VENDA.
- TRIX está comprado e o Estocástico acabou de comprar; OU
- Estocástico está comprado e o TRIX acabou de comprar
Use esse indicador em conjunto com as Bandas de Bollinger ou outro indicador de volatilidade.
Não é indicado para pessoas que sofrem de daltonismo :)
Directional Movement Index and ADXDMI (ADX) consists of three indicators that measure a trend’s strength and direction. Three lines compose the Direction Movement Index (DMI): ADX (white/gray line), DI+ (green line), and DI- (orange line). The Average Directional Index (ADX) line shows the strength of the trend. The higher the ADX value, the stronger the trend. The ADX line is white when it has a positive slope, otherwise it is gray.
The Plus Direction Indicator (DI+) and Minus Direction Indicator (DI-) show the current price direction. When the DI+ is above DI-, the current price momentum is up. When the DI- is above DI+, the current price momentum is down.
Trend detection: When the background has a bluish color there is an upward trend, and when the background has a reddish color there is a downward trend.
Includes an information panel that shows the current value and trend of some well-known indicators.

All in one [Liubam]Hey tradingviewers!
This is an All in one Indicator for those who can't add too many indicators on your charts. Inspired by ©LonesomeTheBlue "Indicators all in one" script. I found a lot of very interesting scripts on the public library and I decided to make a tool with some of the greatest IMO, adding some modifications to improve the indicators. With this tool you can plot 1 of 6 different indicators by selecting it from a drop-down list (on the indicator settings).
All the credit goes to it's respective owners (taggeds).
THIS INDICATOR INCLUDES:
1. Classic RSI with some OB/OS tools:
The relative strength index (RSI) is a popular momentum indicator displayed as an oscillator (a line graph that moves between two extremes) that measures the magnitude of recent price changes to evaluate overbought or oversold conditions, in other words it shows signals about bullish and bearish price momentum. I added some visual improvements to help you finding the OB/OS zones.
2. Classic CCI with some OB/OS tools.
The Commodity Channel Index (CCI) is a momentum-based oscillator used as market indicator to help determine market movements that may indicate buying or selling. Added some vistual improvements to the chart.
3. ADX and DMI oscillator with the keylevel coded by @console:
The Average Directional Index (ADX) is non-directional indicator used by some traders to determine the strength of a trend. When the ADX line is rising (Above the keylevel) trend strength is increasing, and the price moves in the direction of the trend whether up or down. Otherwise, low ADX (Below the keylevel) is usually a sign of accumulation or distribution (Range). Non-trending doesn't mean the price isn't moving. It may not be, but the price could also be making a trend change or is too volatile for a clear direction to be present.
Suggested settings of the keylevel is 23-25.... REMEMBER: The trend may be your friend.
4. MFI
The Money Flow Index (MFI) is a technical oscillator for identifying overbought or oversold signals in an asset. Unlike conventional oscillators such as the RSI, the Money Flow Index incorporates both price and volume data, as opposed to just price. It can also be used to spot divergences which warn of a trend change in price.
5. Stochastic:
A stochastic oscillator is range-bound, meaning it is always between 0 and 100. This makes it a useful indicator of overbought and oversold conditions. Traditionally, readings over 80 are considered in the overbought range, and readings under 20 are considered oversold. However, these are not always indicative of impending reversal; very strong trends can maintain overbought or oversold conditions for an extended period. Instead, traders should look to changes in the stochastic oscillator for clues about future trend shifts. I added some features for this popular indicator to show the stochastic crosses.
6. The famous Squeeze momentum Indicator made by @Lazybear:
This is derivate of John Carter's "TTM Squeeze" volatility indicator and its very strong when using with trending indicator such a ADX. Black line (or no-line) on the midline show that the market just entered a squeeze ( Bollinger Bands are with in Keltner Channel). This signifies low volatility , market preparing itself for an explosive move (up or down). Gray line signify "Squeeze release". Mr.Carter suggests waiting till the gray line after a blackline, and taking a position in the direction of the momentum (for ex., if momentum value is above zero, go long). Exit the position when the momentum changes.
------------------------------------------------------------------------------------------------------------------------------------------------------------------------------------------------------------------------------------------------
This script is source code protected, but you can add to your favorite list to use it. Also you can add twice to use 2 different indicators at the same time (E.g. Squeeze Momentum Indicator + ADX)
An additional indicator I made (MA Hunterz + InfoPanel) is needed to not miss good entry points.
Your valuable comment and feedback is much appreciated...
And remember indicators can be really helpfull but always use Price Action.

(JS)DMI BarsAlright - so this is my own version of John Carter's "10x Bars"... I have done multiple things that are different from his version so they are slightly different..
So first of all the main indicator is based off of the ADX and the DMI;
For those who aren't familiar with it, Directional Movement is what you'd pull up under "built-in's" from the indicators tab (if you want to check it out).
The standard interpretation of this however, is when the ADX is above 20 that suggests the trend is strong, whereas under 20 suggests it is weak.
Also, when the D+ is above the D- that suggests a bullish trend, and D- above D+ suggests a bearish trend.
These bars take away the need to have it at the bottom of your screen, and places the data on the bars on your chart instead.
=========================================================================================================================================
So here's what the colors stand for -
Yellow - The ADX is under 20, no strength in trend
Shades of green occur when the ADX is above 20 and there's a bullish trend (D+ higher than D-)
Bright Green (Lime) - Bullish trend, D+ above 30
Green - Bullish Trend
Yellow Green - Bullish trend, D+ below 15
Shades of red occur when the ADX is above 20 and there's a bearish trend (D- higher than D+)
Bright Red - Bearish trend, D- above 30
Red - Bearish Trend
Orange - Bearish trend, D- below 15
=========================================================================================================================================
I have also added multiple time frame labels (label script used is the one created by Ricardo Santos)
These labels are color coded the same as the bars/candles, and they appear off to the right of your screen using every built in time increment from TradingView.
The purpose is to show you in real time, and on any chart resolution, what the current trend is on every individual time frame.
So using just one single chart you'll see your current resolutions candles, but also on the labels you'll see:
1 Minute
3 Minute
5 Minute
15 Minute
30 Minute
45 Minute
1 Hour
2 Hour
3 Hour
4 Hour
Daily
Weekly
Monthly
There is an input I added that allows you to adjust where your labels appear on the side of your screen as well!
=========================================================================================================================================
Now onto the volume spike portion of the indicator. This will plot a blue dot under each bar that has a spike in volume which meets your specified criteria.
I have 500% as the default setting.
What that means is that this indicator looks back and gets the 50 bar volume average and then applies dots where volume is 500% above average.
=========================================================================================================================================
Now finally, the reversal arrows. This is another simple to understand concept that I first read in John Carter's book "Mastering the Trade" that he calls "HOLP/LOHP".
I have added the ability to change the look back period you'd like the indicator to watch for highs and lows on.
What that stands for is 'High of Low Period' and 'Low of High Period', and it is used like this-
Whenever a bar makes a new high the indicator watches the low on that highest bar. Then when a bar afterwards makes a lower low then the one on the high bar,
a reversal arrow is given. Apply this same concept in the other direction in for the highs on the lowest bars.
=========================================================================================================================================
Now, I didn't want to make a "set" or have a bunch of different indicators out there that are all intended for the same package, so I took the time to put them together,
and if there's a part of it you don't care for they can easily be turned off in the settings.
Enjoy!

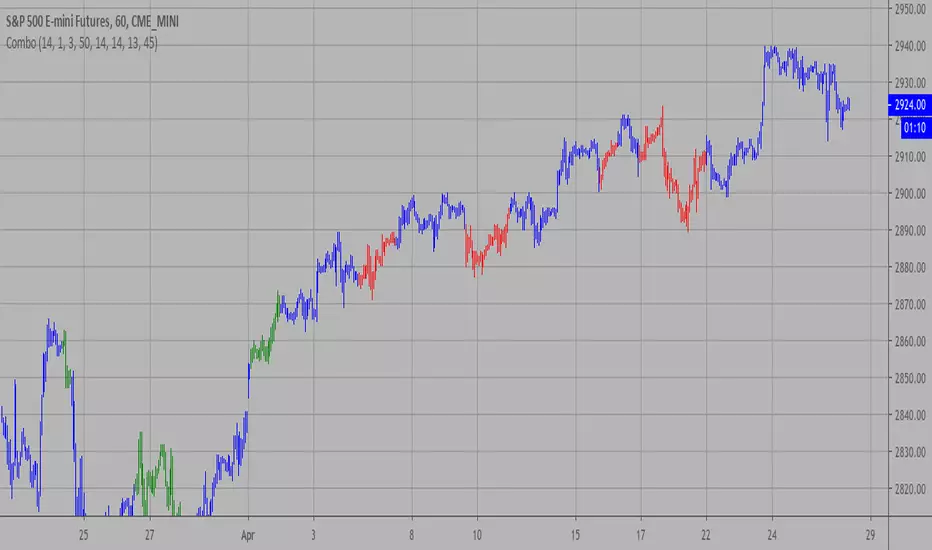
Combo Strategy 123 Reversal and ADXR This is combo strategies for get
a cumulative signal. Result signal will return 1 if two strategies
is long, -1 if all strategies is short and 0 if signals of strategies is not equal.
First strategy
This System was created from the Book "How I Tripled My Money In The
Futures Market" by Ulf Jensen, Page 183. This is reverse type of strategies.
The strategy buys at market, if close price is higher than the previous close
during 2 days and the meaning of 9-days Stochastic Slow Oscillator is lower than 50.
The strategy sells at market, if close price is lower than the previous close price
during 2 days and the meaning of 9-days Stochastic Fast Oscillator is higher than 50.
Secon strategy
The Average Directional Movement Index Rating (ADXR) measures the strength
of the Average Directional Movement Index (ADX). It's calculated by taking
the average of the current ADX and the ADX from one time period before
(time periods can vary, but the most typical period used is 14 days).
Like the ADX, the ADXR ranges from values of 0 to 100 and reflects strengthening
and weakening trends. However, because it represents an average of ADX, values
don't fluctuate as dramatically and some analysts believe the indicator helps
better display trends in volatile markets.
WARNING:
- For purpose educate only
- This script to change bars colors.
Stochastic RSI + RSI/ADX Stochastic RSI with RSI/ADX Display
DESCRIPTION:
Advanced momentum oscillator combining Stochastic RSI with Ehlers SuperSmoother filter for reduced noise and cleaner signals. Includes real-time RSI and ADX value displays for complete market analysis.
KEY FEATURES:
- Stochastic RSI applied to logarithmic price for normalized movements
- Ehlers SuperSmoother filter reduces lag while eliminating false signals
- Second derivative (curvature) analysis filters out low-probability setups
- Real-time RSI and ADX boxes with color-coded thresholds
- Buy/Sell signals only trigger with confirmed momentum and curvature alignment
COMPONENTS:
1. K Line (Blue): Smoothed Stochastic RSI
2. D Line (Orange): Signal line (SMA of K)
3. RSI Box: Green above 50, Red below 50
4. ADX Box: Green above 25 (trending), Red below 25 (ranging)
SIGNAL LOGIC:
BUY: K crosses above D + positive curvature + below midpoint (50)
SELL: K crosses below D + negative curvature + above midpoint (50)
PARAMETERS:
- K Smoothing: 10 (Ehlers filter period)
- D Smoothing: 3 (Signal line)
- RSI

Advanced Confluence DashboardAdvanced Confluence Dashboard - Multi-Indicator Technical Analysis Tool
OVERVIEW
The Advanced Confluence Dashboard is a comprehensive technical analysis tool designed to help traders identify high-probability trade setups by tracking multiple technical indicators simultaneously. The indicator displays up to 13 different technical confluences in an easy-to-read dashboard format, providing both individual signals and an overall market bias percentage. Switch between full table view and condensed view for maximum chart flexibility.
FEATURES
- 13 Technical Confluences: RSI, VWAP, EMA Cross (9/21), MACD, Stochastic, Trend (50 EMA), Bollinger Bands, ADX Strength, Price Momentum, Volume Breakout, VWAP Bands, 200 EMA, and Price Action (Higher Highs/Lower Lows)
- Real-time Confluence Scoring: Automatically calculates bullish vs bearish signal strength
- Multi-Timeframe Support: Analyze indicators on any timeframe while viewing your chart on another
- Customizable Display: Toggle individual indicators on/off, adjust table position, size, and transparency
- ATR Information: Optional ATR display for volatility-based position sizing
- Condensed View Mode: Ultra-minimal display showing only confluence score and ATR (perfect for scalpers who want maximum chart visibility)
- Full Table View: Detailed breakdown of each indicator's value and signal
- Color-Coded Signals: Green (bullish), red (bearish), white (neutral) for instant visual clarity
HOW IT WORKS
The indicator evaluates each enabled technical indicator and assigns it either a bullish or bearish signal based on its current state. The confluence score shows how many indicators are aligned in each direction, giving you a clear percentage-based view of market bias. For example, if 8 out of 13 indicators are bullish, you'll see a 62% LONG BIAS signal.
DISPLAY MODES
Full View: Shows all enabled indicators with their current values and signals in a detailed table format. Perfect for understanding exactly which indicators are bullish or bearish and why.
Condensed View: Shows only the confluence score (e.g., "4/13 LONG | 9/13 SHORT - SHORT BIAS 69%") and optional ATR information. This minimal display keeps your chart clean while still providing the essential confluence data you need for quick trading decisions. Ideal for scalpers and traders who want maximum chart space.
CONFLUENCES EXPLAINED
- RSI: Momentum oscillator (>50 bullish, <50 bearish, shows overbought/oversold)
- VWAP: Volume-weighted average price (above = bullish, below = bearish)
- EMA Cross: Fast EMA (9) vs Slow EMA (21) with price position
- MACD: Trend-following momentum (line above signal = bullish)
- Stochastic: Momentum oscillator (>50 bullish, <50 bearish)
- Trend (50 EMA): Price position relative to 50-period EMA
- Bollinger Bands: Volatility and mean reversion (above middle = bullish)
- ADX Strength: Trend strength indicator (shows strong trends)
- Price Momentum: Rate of price change over specified period
- Volume Breakout: Detects unusual volume with directional bias
- VWAP Bands: Standard deviation bands around VWAP
- 200 EMA: Long-term trend indicator
- Price Action: Higher Highs and Lower Lows pattern detection
SETTINGS
Timeframe Settings:
- Indicator Timeframe: Analyze indicators on a different timeframe than your chart
Display Options:
- Condensed View: Toggle between full table and minimal display
- Show ATR Info: Display/hide ATR information
- Table Position: 9 positions (top/middle/bottom + left/center/right)
- Text Size: Auto, tiny, small, normal, large, huge
- Table Transparency: 0-100%
- Border Width: 1-5 pixels
Confluence Toggles:
- Enable/disable any of the 13 confluences individually
- Confluence score automatically adjusts based on enabled indicators
Indicator Settings:
- RSI Length (default: 14)
- ATR Length (default: 14)
- Fast/Slow EMA (default: 9/21)
- Trend EMA (default: 50)
- Volume SMA Length (default: 20)
- Volume Breakout Multiplier (default: 2.0x)
- Bollinger Bands Length/StdDev (default: 20/2.0)
- ADX Length (default: 14)
- ADX Strength Threshold (default: 25)
- Momentum Length (default: 10)
IDEAL USE CASES
- Scalping: Quick identification of confluence for fast entries/exits - use condensed view for clean charts
- Day Trading: Multi-timeframe analysis for intraday setups
- Swing Trading: Confirmation of longer-term bias
- Risk Management: Higher confluence = higher probability trades
- Trade Filtering: Only take trades when confluence reaches your threshold
- Multi-Monitor Setups: Use condensed view on execution charts, full view on analysis charts
HOW TO USE
1. Add the indicator to your chart
2. Toggle on/off the confluences you prefer to use
3. Choose between Full View (detailed) or Condensed View (minimal)
4. Adjust the table position and size to your preference
5. Look for high confluence percentages (70%+ is strong bias)
6. Use the individual indicator signals (full view) to understand market structure
7. Combine with your trading strategy for entry/exit confirmation
TIPS
- Use Condensed View when scalping to keep your chart clean and uncluttered
- Switch to Full View when you need to analyze which specific indicators are conflicting
- Higher confluence doesn't guarantee success - always use proper risk management
- Consider using 60%+ confluence as a minimum threshold for trades
- Pay attention to which specific indicators are aligned vs conflicting
- Use the ATR display for quick reference on position sizing
- Experiment with different timeframes to find what works for your style
- Disable indicators you don't use to simplify your confluence scoring
DISCLAIMER
This indicator is for educational and informational purposes only. It does not constitute financial advice, investment advice, trading advice, or any other type of advice. Trading and investing in financial markets involves substantial risk of loss and is not suitable for every investor. Past performance is not indicative of future results. Always do your own research and consult with a qualified financial advisor before making any investment decisions.

RSI + Psy + ADX P2RSI + Psy + ADX
This indicator combines multi-length RSI analysis with the Psychological Line (PSY) and ADX trend strength to highlight reversal zones, emotional extremes, and trend conditions in a single unified panel.
🔹 Features
1️⃣ Triple RSI with Dynamic Colors
Displays Short / Mid / Long RSI values (9 / 26 / 52 by default)
Line color changes based on RSI levels:
🔴 Overbought (above 68)
🟢 Oversold (below 32)
⚪ Neutral market conditions
Fixed zone levels at 70 / 50 / 30 for simple visual analysis
2️⃣ Psychological Line (PSY) Extreme Signal
Measures the percentage of bearish candles in the selected period
Only highlights emotional extremes (overbought & oversold conditions)
Red/Green histogram makes market sentiment easy to read
3️⃣ ADX Trend Strength Detector
Confirms trend momentum using ADX
Color-coded levels:
🔵 Weak trend
🟡 Moderate trend
🔴 Strong trend (possible trend continuation)
Helps avoid counter-trend trades during strong momentum
4️⃣ RSI Background Highlight (Mid-term RSI Only)
Background turns RED in overbought area
Background turns GREEN in oversold area
Provides fast and clean recognition of reversal zones
🎯 Best Uses
Identifying low-risk reversal entry zones
Avoiding entries against strong trends
Confirming momentum and sentiment alignment
Useful for scalping, day-trading, and swing-trading strategies
💡 Tip
For higher precision, combine this indicator with:
🔹 Support/Resistance Levels
🔹 Candlestick Reversal Patterns
🔹 Volume Spikes or Breakout Tools

Breakout Signal (Trend+ATR+ADX+Score)Breakout Signal – Trend + ATR + ADX + Strength Score
This indicator detects high-quality bullish breakout conditions using a multi-filter confirmation system designed to reduce false signals and highlight only strong momentum events.
A breakout signal triggers when all core conditions align:
📌 Breakout Conditions
1. Price Breakout
Breakout occurs when the current high exceeds the previous close by X%.
This avoids noisy open-based signals and focuses on genuine upward expansion.
2. Volume Spike
Current volume must be higher than the average volume × multiplier.
This ensures the breakout is supported by real trading activity.
3. Trend Filter (MA)
Price must be trading above a moving average.
This prevents counter-trend breakouts and focuses on momentum continuation.
4. ATR Rising
ATR must be rising relative to its own moving average.
A rising ATR confirms volatility expansion — a key ingredient of valid breakouts.
5. ADX Trend Strength
ADX must exceed a user-defined threshold (default: 20).
This confirms the market is in a strong trend environment, reducing false signals.
⭐ Breakout Strength Score (0–5)
Each of the 5 filters contributes 1 point:
Trend OK
Volume Spike
ATR Rising
ADX Strong
Price Breakout
A score label appears on valid breakouts:
5/5 → Very strong breakout
4/5 → Strong breakout
3/5 → Moderate breakout
0–2 → Weak / avoided signals

CJ - ADX Trend Power v5This indicator highlights when the market enters a strong trend phase using ADX together with +DI and –DI.
Green background: ADX above the threshold and +DI dominates → strong bullish trend.
Red background: ADX above the threshold and –DI dominates → strong bearish trend.
It also tags the exact moment when ADX breaks above the strength level, helping traders avoid choppy markets and focus only on high-momentum conditions.

Sentinel Nexus Dashboard [AGP] Ver.1.5Sentinel Nexus Dashboard is a versatile Pine Script designed as a comprehensive technical analysis tool. It condenses a variety of key indicators and metrics into a single, intuitive visual dashboard, providing an integrated view of market trends, momentum, volatility, and liquidity, all neatly organized on your TradingView chart.
Key Features and Benefits
All-in-One Dashboard: This script centralizes relevant information, offering a clean, efficient control panel that helps you make quick decisions without cluttering your chart with multiple overlays.
Trend Analysis with ADX: It incorporates the Average Directional Index (ADX) to measure trend strength. The dashboard displays ADX, DI+, and DI- values with dynamic color-coding to highlight trend intensity (e.g., blue for a very strong trend).
Momentum Analysis with MACD: The dashboard shows MACD line and signal line values in a table. The background color of the MACD values reflects the histogram's direction, allowing you to quickly identify crosses and shifts in market momentum.
Multi-Timeframe RSI Analysis: The RSI (Relative Strength Index) dashboard displays values across multiple timeframes (from 1 minute to 1 month). Overbought (77) and oversold (23) levels are color-coded for immediate identification of market conditions, making it an ideal tool for multi-timeframe analysis.
Smart and Dynamic Volume: The script uses a bar coloring algorithm based on average volume. Chart bars change color according to volume magnitude (extreme, high, average, or low) relative to the average, distinguishing between bullish and bearish bars. This helps you identify significant, liquidity-driven price movements.
Fair Value Analysis: The script calculates an asset's "fair value" using a noise filter (similar to a Kalman filter) on recent highs and lows to determine a midpoint. The price dashboard's background color changes to indicate if the current price is above or below this fair value.
Fibonacci EMA Analysis: A table displays several Exponential Moving Averages (EMAs) based on the Fibonacci sequence. The values are color-coded to show whether the current price is above (white) or below (orange) each EMA, helping you quickly identify dynamic support and resistance levels.
CME Futures Data Integration: For Bitcoin, the script can show a chart label with the Bitcoin futures price (CME:BTC1!), allowing you to compare the spot price with the CME futures market.
Potential Uses and Applications
The Sentinel Nexus Dashboard is an excellent support tool for trading. It is not a signal system but rather a suite of confirmation tools that can be used to:
Confirm Trend Strength: Before entering a trade, use the ADX data to ensure the trend has enough strength for your expected move.
Detect Reversal Points: Multi-timeframe RSI data can alert you to potential overbought or oversold conditions, indicating possible exhaustion of a price move.
Validate Price Movements: Bar coloring based on volume helps you determine if a price move is genuine and supported by strong market participation. High volume can confirm a breakout or reversal.
Identify Support and Resistance: The Fibonacci EMAs allow you to quickly visualize key levels where price might find support or resistance, aiding in planning entries and exits.
In short, this script is perfect for traders who want a comprehensive market overview without chart clutter. It efficiently integrates trend, momentum, and volume analysis in one place.
Legal Disclaimer
RISK WARNING:
This Pine Script is a technical analysis tool and should not be considered financial advice. Past performance of any indicator is no guarantee of future results. Trading in financial markets involves a high risk of loss and is not suitable for all investors. By using this indicator, you accept full responsibility for your trading decisions and acknowledge that any financial loss is your sole responsibility.
IMPORTANT:
Some script functions, such as the CME price label, may not work correctly if your TradingView subscription plan is not a paid one. Please check your plan's limitations to ensure the indicator's optimal functionality.

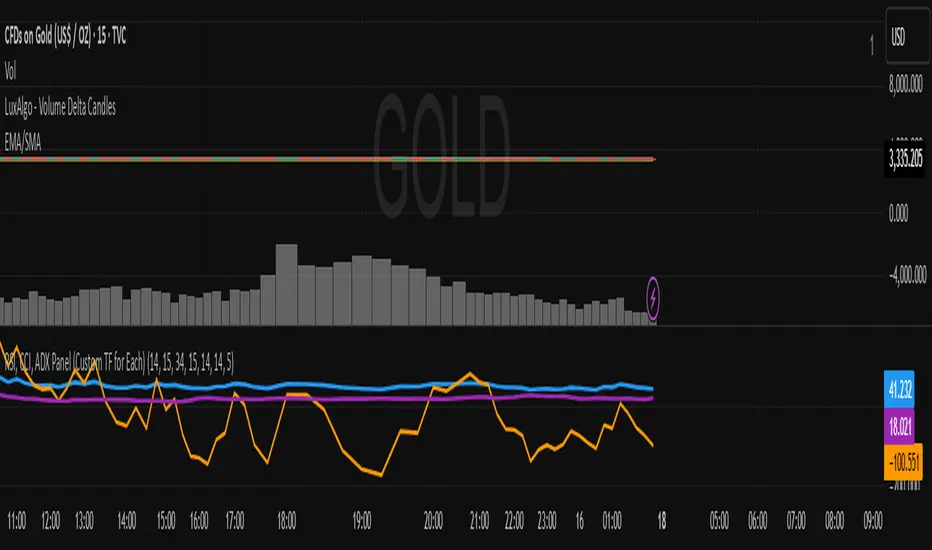
RSI, CCI, ADX Panel (Custom TF for Each)RSI, CCI, ADX Panel (Custom TF for Each)
This indicator combines RSI, CCI, and ADX into a single panel, allowing traders to view three key momentum/trend signals together. Each indicator can be calculated on its own custom timeframe, making it useful for multi-timeframe analysis.
Features:
RSI (Relative Strength Index): Measures momentum, useful for identifying overbought/oversold conditions.
CCI (Commodity Channel Index): Detects cyclical movements and potential reversals.
ADX (Average Directional Index): Evaluates trend strength without regard to direction.
Independent timeframe selection for RSI, CCI, and ADX.
Distinct colors for each indicator (RSI = Blue, CCI = Orange, ADX = Purple).
Single consolidated panel for compact analysis.
This tool is designed to give a multi-perspective view of market strength, momentum, and trend in one place.