Adaptive Trend Following Suite [Alpha Extract]A sophisticated multi-filter trend analysis system that combines advanced noise reduction, adaptive moving averages, and intelligent market structure detection to deliver institutional-grade trend following signals. Utilizing cutting-edge mathematical algorithms and dynamic channel adaptation, this indicator provides crystal-clear directional guidance with real-time confidence scoring and market mode classification for professional trading execution.
🔶 Advanced Noise Reduction
Filter Eliminates market noise using sophisticated Gaussian filtering with configurable sigma values and period optimization. The system applies mathematical weight distribution across price data to ensure clean signal generation while preserving critical trend information, automatically adjusting filter strength based on volatility conditions.
advancedNoiseFilter(sourceData, filterLength, sigmaParam) =>
weightSum = 0.0
valueSum = 0.0
centerPoint = (filterLength - 1) / 2
for index = 0 to filterLength - 1
gaussianWeight = math.exp(-0.5 * math.pow((index - centerPoint) / sigmaParam, 2))
weightSum += gaussianWeight
valueSum += sourceData * gaussianWeight
valueSum / weightSum
🔶 Adaptive Moving Average Core Engine
Features revolutionary volatility-responsive averaging that automatically adjusts smoothing parameters based on real-time market conditions. The engine calculates adaptive power factors using logarithmic scaling and bandwidth optimization, ensuring optimal responsiveness during trending markets while maintaining stability during consolidation phases.
// Calculate adaptive parameters
adaptiveLength = (periodLength - 1) / 2
logFactor = math.max(math.log(math.sqrt(adaptiveLength)) / math.log(2) + 2, 0)
powerFactor = math.max(logFactor - 2, 0.5)
relativeVol = avgVolatility != 0 ? volatilityMeasure / avgVolatility : 0
adaptivePower = math.pow(relativeVol, powerFactor)
bandwidthFactor = math.sqrt(adaptiveLength) * logFactor
🔶 Intelligent Market Structure Analysis
Employs fractal dimension calculations to classify market conditions as trending or ranging with mathematical precision. The system analyzes price path complexity using normalized data arrays and geometric path length calculations, providing quantitative market mode identification with configurable threshold sensitivity.
🔶 Multi-Component Momentum Analysis
Integrates RSI and CCI oscillators with advanced Z-score normalization for statistical significance testing. Each momentum component receives independent analysis with customizable periods and significance levels, creating a robust consensus system that filters false signals while maintaining sensitivity to genuine momentum shifts.
// Z-score momentum analysis
rsiAverage = ta.sma(rsiComponent, zAnalysisPeriod)
rsiDeviation = ta.stdev(rsiComponent, zAnalysisPeriod)
rsiZScore = (rsiComponent - rsiAverage) / rsiDeviation
if math.abs(rsiZScore) > zSignificanceLevel
rsiMomentumSignal := rsiComponent > 50 ? 1 : rsiComponent < 50 ? -1 : rsiMomentumSignal
❓How It Works
🔶 Dynamic Channel Configuration
Calculates adaptive channel boundaries using three distinct methodologies: ATR-based volatility, Standard Deviation, and advanced Gaussian Deviation analysis. The system automatically adjusts channel multipliers based on market structure classification, applying tighter channels during trending conditions and wider boundaries during ranging markets for optimal signal accuracy.
dynamicChannelEngine(baselineData, channelLength, methodType) =>
switch methodType
"ATR" => ta.atr(channelLength)
"Standard Deviation" => ta.stdev(baselineData, channelLength)
"Gaussian Deviation" =>
weightArray = array.new_float()
totalWeight = 0.0
for i = 0 to channelLength - 1
gaussWeight = math.exp(-math.pow((i / channelLength) / 2, 2))
weightedVariance += math.pow(deviation, 2) * array.get(weightArray, i)
math.sqrt(weightedVariance / totalWeight)
🔶 Signal Processing Pipeline
Executes a sophisticated 10-step signal generation process including noise filtering, trend reference calculation, structure analysis, momentum component processing, channel boundary determination, trend direction assessment, consensus calculation, confidence scoring, and final signal generation with quality control validation.
🔶 Confidence Transformation System
Applies sigmoid transformation functions to raw confidence scores, providing 0-1 normalized confidence ratings with configurable threshold controls. The system uses steepness parameters and center point adjustments to fine-tune signal sensitivity while maintaining statistical robustness across different market conditions.
🔶 Enhanced Visual Presentation
Features dynamic color-coded trend lines with adaptive channel fills, enhanced candlestick visualization, and intelligent price-trend relationship mapping. The system provides real-time visual feedback through gradient fills and transparency adjustments that immediately communicate trend strength and direction changes.
🔶 Real-Time Information Dashboard
Displays critical trading metrics including market mode classification (Trending/Ranging), structure complexity values, confidence scores, and current signal status. The dashboard updates in real-time with color-coded indicators and numerical precision for instant market condition assessment.
🔶 Intelligent Alert System
Generates three distinct alert types: Bullish Signal alerts for uptrend confirmations, Bearish Signal alerts for downtrend confirmations, and Mode Change alerts for market structure transitions. Each alert includes detailed messaging and timestamp information for comprehensive trade management integration.
🔶 Performance Optimization
Utilizes efficient array management and conditional processing to maintain smooth operation across all timeframes. The system employs strategic variable caching, optimized loop structures, and intelligent update mechanisms to ensure consistent performance even during high-volatility market conditions.
This indicator delivers institutional-grade trend analysis through sophisticated mathematical modelling and multi-stage signal processing. By combining advanced noise reduction, adaptive averaging, intelligent structure analysis, and robust momentum confirmation with dynamic channel adaptation, it provides traders with unparalleled trend following precision. The comprehensive confidence scoring system and real-time market mode classification make it an essential tool for professional traders seeking consistent, high-probability trend following opportunities with mathematical certainty and visual clarity.
In den Scripts nach "accuracy" suchen

MA Median Crossover | MisinkoMasterThe MA Median Crossover is a new trend analysis tool designed to help traders catch trends with less noisy, more accuracy and speed.
While simple, this effective indicator can improve your strategy more than you might think.
How does it work?
1. Get user defined input
=> set up your indicator to your likings, and make it capture what you want it to
2. Calculate the Moving Average and Median Base
=> this is the foundation of the indicator
3. Smooth the median
=> less noise, more accuracy, just like that!
4. Compare the MA to the smoothed Median
=> If the MA > smoothed Median, it signals an uptrend, if the MA < smoothed Median,
it signals a downtrend.
Yep, that is how simple it is.
Final note:
Changing the MA type is very influencial, so watch out when changing them.
Enjoy G´s!

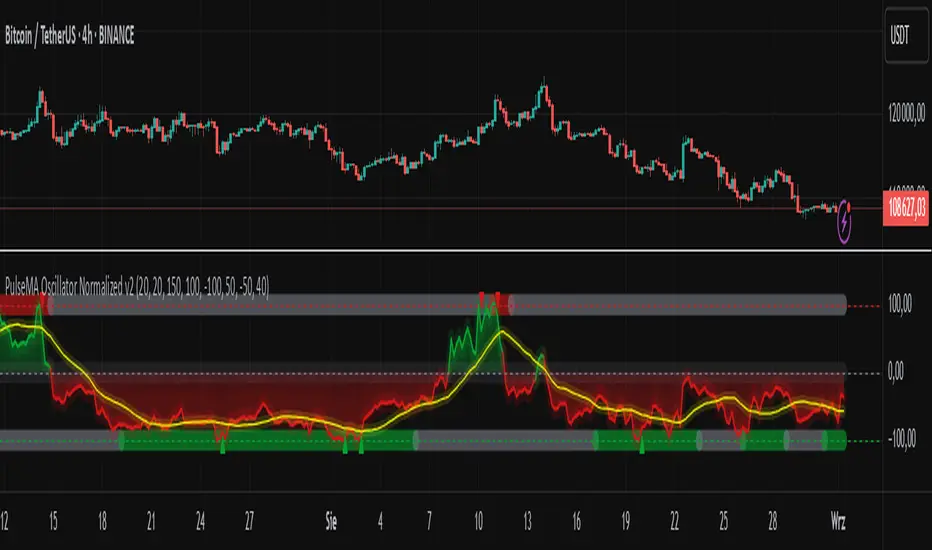
PulseMA Oscillator Normalized v2█ OVERVIEW
PulseMA Oscillator Normalized v2 is a technical indicator designed for the TradingView platform, assisting traders in identifying potential trend reversal points based on price dynamics derived from moving averages. The indicator is normalized for easier interpretation across various market conditions, and its visual presentation with gradients and signals facilitates quick decision-making.
█ CONCEPTS
The core idea of the indicator is to analyze trend dynamics by calculating an oscillator based on a moving average (EMA), which is then normalized and smoothed. It provides insights into trend strength, overbought/oversold levels, and reversal signals, enhanced by gradient visualizations.
Why use it?
Identifying reversal points: The indicator detects overbought and oversold levels, generating buy/sell signals at their crossovers.
Price dynamics analysis: Based on moving averages, it measures how long the price stays above or below the EMA, incorporating trend slope.
Visual clarity: Gradients, fills, and colored lines enable quick chart analysis.
Flexibility: Configurable parameters, such as moving average lengths or normalization period, allow adaptation to various strategies and markets.
How it works?
Trend detection: Calculates a base exponential moving average (EMA with PulseMA Length) and measures how long the price stays above or below it, multiplied by the slope for the oscillator.
Normalization: The oscillator is normalized based on the minimum and maximum values over a lookback period (default 150 bars), scaling it to a range from -100 to 100: (oscillator - min) / (max - min) * 200 - 100. This ensures values are comparable across different instruments and timeframes.
Smoothing: The main line (PulseMA) is the normalized oscillator (oscillatorNorm). The PulseMA MA line is a smoothed version of PulseMA, calculated using an SMA with the PulseMA MA length. As PulseMA MA is smoothed, it reacts more slowly and can be used as a noise filter.
Signals: Generates buy signals when crossing the oversold level upward and sell signals when crossing the overbought level downward. Signals are stronger when PulseMA MA is in the overbought or oversold zone (exceeding the respective thresholds for PulseMA MA).
Visualization: Draws lines with gradients for PulseMA and PulseMA MA, levels with gradients, gradient fill to the zero line, and signals as triangles.
Alerts: Built-in alerts for buy and sell signals.
Settings and customization
PulseMA Length: Length of the base EMA (default 20).
PulseMA MA: Length of the SMA for smoothing PulseMA MA (default 20).
Normalization Lookback Period: Normalization period (default 150, minimum 10).
Overbought/Oversold Levels: Levels for the main line (default 100/-100) and thresholds for PulseMA MA, indicating zones where PulseMA MA exceeds set values (default 50/-50).
Colors and gradients: Customize colors for lines, gradients, and levels; options to enable/disable gradients and fills.
Visualizations: Show PulseMA MA, gradients for overbought/oversold/zero levels, and fills.
█ OTHER SECTIONS
Usage examples
Trend analysis: Observe PulseMA above 0 for an uptrend or below 0 for a downtrend. Use different values for PulseMA Length and PulseMA MA to gain a clearer trend picture. PulseMA MA, being smoothed, reacts more slowly and can serve as a noise filter to confirm trend direction.
Reversal signals: Look for buy triangles when PulseMA crosses the oversold level, especially when PulseMA MA is in the oversold zone. Similarly, look for sell triangles when crossing the overbought level with PulseMA MA in the overbought zone. Such confirmation increases signal reliability.
Customization: Test different values for PulseMA Length and PulseMA MA on a given instrument and timeframe to minimize false signals and tailor the indicator to market specifics.
Notes for users
Combine with other tools, such as support/resistance levels or other oscillators, for greater accuracy.
Test different settings for PulseMA Length and PulseMA MA on the chosen instrument and timeframe to find optimal values.
ZLEMA Trend Index 2.0ZTI — ZLEMA Trend Index 2.0 (0–1000)
Overview
Price Mapped ZTI v2.0 - Enhanced Zero-Lag Trend Index.
This indicator is a significant upgrade to the original ZTI v1.0, featuring enhanced resolution from 0-100 to 0-1000 levels for dramatically improved price action accuracy. The Price Mapped ZTI uses direct price-to-level mapping to eliminate statistical noise and provide true proportional representation of market movements.
Key Innovation: Instead of statistical normalization, this version maps current price position within a user-defined lookback period directly to the ZTI scale, ensuring perfect correlation with actual price movements. I believe this is the best way to capture trends instead of directly on the charts using a plethora of indicators which introduces bad signals resulting in drawdowns. The RSI-like ZTI overbought and oversold lines filter valid trends by slicing through the current trading zone. Unlike RSI that can introduce false signals, the ZTI levels 1 to 1000 is faithfully mapped to the lowest to highest price in the current trading zone (lookback period in days) which can be changed in the settings. The ZTI line will never go off the beyond the ZTI levels in case of extreme trend continuation as the trading zone is constantly updated to reflect only the most recent bars based on lookback days.
Core Features
✅ 10x Higher Resolution - 0-1000 scale provides granular movement detection
✅ Adjustable Trading Zone - Customizable lookback period from 1-50 days
✅ Price-Proportional Mapping - Direct correlation between price position and ZTI level
✅ Zero Statistical Lag - No rolling averages or standard deviation calculations
✅ Multi-Strategy Adaptability - Single parameter adjustment for different trading styles
Trading Zone Optimization
📊 Lookback Period Strategies
Short-term (1-3 days):
Ultra-responsive to recent price action
Perfect for scalping and day trading
Tight range produces more sensitive signals
Medium-term (7-14 days):
Balanced view of recent trading range
Ideal for swing trading
Captures meaningful support/resistance levels
Long-term (21-30 days):
Broader market context
Excellent for position trading
Smooths out short-term market noise
⚡ Market Condition Adaptation
Volatile Markets: Use shorter lookback (3-5 days) for tighter ranges
Trending Markets: Use longer lookback (14-21 days) for broader context
Ranging Markets: Use medium lookback (7-10 days) for clear boundaries
🎯 Timeframe Optimization
1-minute charts: 1-2 day lookback
5-minute charts: 2-5 day lookback
Hourly charts: 7-14 day lookback
Daily charts: 21-50 day lookback
Trading Applications
Scalping Setup (2-day lookback):
Super tight range for quick reversals
ZTI 800+ = immediate short opportunity
ZTI 200- = immediate long opportunity
Swing Trading Setup (10-day lookback):
Meaningful swing levels captured
ZTI extremes = high-probability reversal zones
More stable signals, reduced whipsaws
Advanced Usage
🔧 Real-Time Adaptability
Trending days: Increase to 14+ days for broader perspective
Range-bound days: Decrease to 3 days for tighter signals
High volatility: Shorter lookback for responsiveness
Low volatility: Longer lookback to avoid false signals
💡 Multi-Timeframe Approach
Entry signals: Use 7-day ZTI on main timeframe
Trend confirmation: Use 21-day ZTI on higher timeframe
Exit timing: Use 3-day ZTI for precise exits
🌐 Session Optimization
Asian session: Shorter lookback (3-5 days) for range-bound conditions
London/NY session: Longer lookback (7-14 days) for trending conditions
How It Works
The indicator maps the current price position within the specified lookback period directly to a 0-1000 scale and plots it using ZLEMA (Zero Lag Exponential Moving Average) which has the least lag of the available popular moving averages:
Price at recent high = ZTI at 1000
Price at recent low = ZTI at 1
Price at mid-range = ZTI at 500
This creates perfect proportional representation where every price movement translates directly to corresponding ZTI movement, eliminating the false signals common in traditional oscillators.
This single, versatile indicator adapts to any market condition, timeframe, or trading style through one simple parameter adjustment, making it an essential tool for traders at every level.
Credits
ZLEMA techniques widely attributed to John Ehlers.
Disclaimer
This tool is for educational purposes only and is not financial advice. Backtest and forward‑test before live use, and always manage risk.
Please note that I set this as closed source to prevent source code cloning by others, repackaging and republishing which results in multiple confusing choices of the same indicator.

fieolouis - VSA Wyckoff Volume📌 VSA Wyckoff Volume – Enhanced Version
This tool is built on the principles of Wyckoff + VSA (Volume Spread Analysis), helping traders quickly detect whale / Market Maker activity through volume classification.
🔹 Key Features:
Classifies volume into multiple levels: Ultra High, Very High, High, Normal, Low.
Integrated ATR-based filter to remove noise and highlight significant candles.
Optional Volume MA line to track supply–demand trends.
Easy to combine with Supply/Demand zones, Volume Profile, or Price Action to spot Accumulation – Distribution phases.
🔹 Practical Use Cases:
Identify areas where whales accumulate before major moves.
Detect distribution signals when abnormal volume appears at the top.
Support entry – exit decisions in both short-term and mid-term trading with higher accuracy.
This indicator works well for both spot and futures, especially when applied across multiple timeframes.
👉 If you’re looking for a tool to “track the footsteps of smart money,” this is a practical way to bring Wyckoff & VSA into your trading strategy.

Moon Scalper v3 + VSAMoon Scalper v3 is a high-precision scalping indicator optimized for the 15-minute chart. It delivers clean buy/sell signals with TP1 (1:1 risk-reward) exits using layered confirmations:
• **Volatility Bands** — SMA + multiplier detect expansion zones
• **EMA Filter (200)** — ensures trades align with trend
• **RSI Range Filter** — avoids extreme overbought/oversold traps (buy: 52–62, sell: 38–48)
• **Volume Spike Filter** — filters for institutional activity (vol > 1.4×SMA)
• **VSA Confirmation** — requires wide-spread, high-volume bars with reclaim (volume × 1.4, spread × 1.5, reclaim 50%)
**Usage Notes:**
Best used on 15m timeframe for liquid pairs (e.g., BTCUSDT, ETHUSDT). Signals appear as “BUY” / “SELL” labels on chart. Defaults yield high TP1 hit rate; use only during active sessions (e.g., London/NY) for best accuracy.
**Disclaimer:**
This indicator is for educational purposes only. Past performance is not a guarantee of future results. Always backtest before live trading and manage risk responsibly.

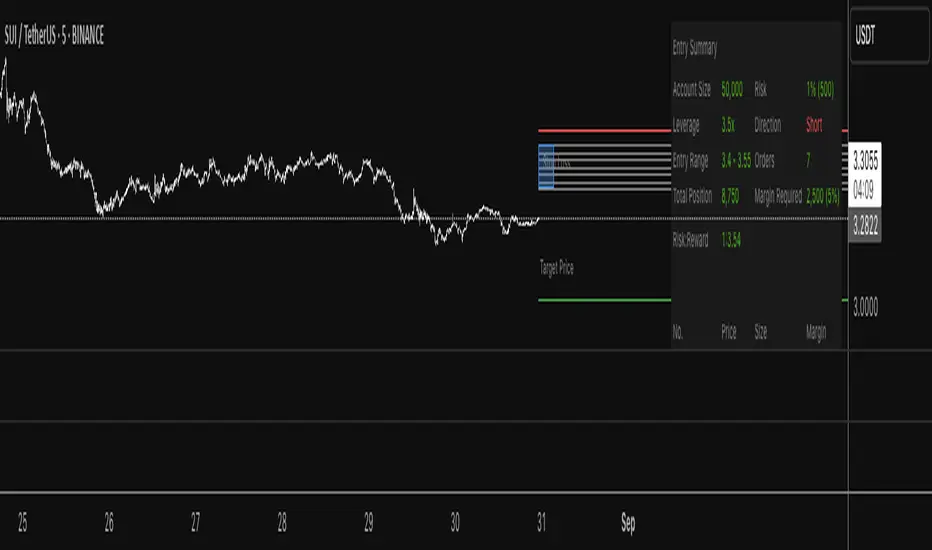
Progressive Entry Position Sizer v3Progressive Entry Position Sizer (PEPS) - DEVELOPMENT VERSION
⚠️ IMPORTANT DISCLAIMER: This indicator is currently in development and should NOT be relied upon for trading accuracy. Use at your own risk and always verify calculations independently before making any trading decisions.
Overview:
The Progressive Entry Position Sizer (PEPS) is a risk management tool designed to help traders plan multiple entry positions with progressive scaling. This indicator calculates position sizes and margin requirements across multiple entry levels while maintaining consistent risk exposure.
Key Features:
Progressive Risk Scaling: Uses a token-based system (1, 2, 3, 4, 5...) to progressively increase position sizes at each entry level
Leverage Support: Accommodates leverage up to 50x with proper margin calculations
Dollar-Based Position Sizing: Displays position values in dollar amounts rather than share quantities
Visual Entry Planning: Shows entry zones, target, and stop loss levels with extended lines
Comprehensive Risk Table: Detailed breakdown of each entry with position values and margin requirements
How It Works:
Set your account balance, risk percentage, and leverage
Define primary entry, final entry, target, and stop loss prices
Choose number of limit orders (2-8)
The indicator calculates evenly distributed entry prices with progressive position sizing
Each subsequent entry receives more "risk tokens" resulting in larger position sizes
Use Cases:
Planning DCA (Dollar Cost Averaging) strategies
Risk management for leveraged positions
Visualizing multi-entry trading setups
Educational purposes for understanding progressive scaling
⚠️ Development Status:
This script is actively being developed and may contain bugs or calculation errors. Always:
Verify all calculations manually
Test thoroughly on paper trades first
Consult with financial professionals
Never risk more than you can afford to lose
Feedback Welcome:
As this is a development version, user feedback and suggestions for improvements are greatly appreciated.
This indicator is for educational and planning purposes only. Not financial advice.
Balance & Reversal Indicator [SYNC & TRADE]ndicator Description: "Balance & Reversal Indicator "
Purpose of the Indicator
The "Balance & Reversal Indicator " indicator is designed for analyzing market activity in cryptocurrency and other financial markets. It assists traders in identifying potential trend reversal points, detecting market equilibrium zones, and evaluating the balance between buying and selling volumes. The indicator is suitable for both short-term and long-term trading, offering flexible settings to adapt to various trading styles and timeframes.
What Does the Indicator Provide?
Volume Analysis: Calculates buy and sell volumes, along with the Long/Short Ratio, to assess current market dynamics.
Reversal Signals: Generates signals for potential Long (buy) and Short (sell) reversals based on customizable levels, ranging from "Potential Reversal" to "Maximum Signal."
Equilibrium Zones: Identifies zones where the market is in balance, useful for recognizing neutral market conditions.
Flexible Calculation Methods: Supports four volume calculation methods (Tick Based, Candle Based, Delta Based, Price Movement) to suit different trading approaches.
Auto and Manual Sensitivity: Offers "Auto" mode for timeframe-based sensitivity or "Manual" mode for custom sensitivity settings.
Data Visualization: Displays key metrics (total volume, buy/sell volumes, ratio, and percentages) via a comparison table and on-chart labels for easy interpretation.
Volume Unit Customization: Allows volume display in USDT, Active contracts, or other units for enhanced flexibility.
How to Use the Indicator?
Adding to the Chart:
Find "Balance & Reversal Indicator " in the TradingView library and add it to your chart.
The indicator appears in a separate panel below the chart, keeping price data unobstructed (overlay=false).
Configuring Settings:
Calculation Method: Choose one of four volume analysis methods:
Tick Based: Analyzes price movement within a candle.
Candle Based: Evaluates candle direction (up/down).
Delta Based: Considers the difference between open and close prices.
Price Movement: Assesses movement strength based on candle body and wick sizes.
Sensitivity Mode:
In "Auto" mode, sensitivity adjusts automatically based on the timeframe (e.g., higher for minute charts, lower for daily charts).
In "Manual" mode, set sensitivity manually (from 0.1 to 1.0).
Reversal Levels (Long/Short): Configure levels for Long and Short signals with associated ranges. For example, Long Reversal Level 1 = -30% with a 5% range triggers signals between -35% and -30%.
Equilibrium Levels: Set levels for neutral market zones (e.g., ±7% for Equilibrium Level 1).
Messages: Customize signal messages to align with your trading style.
Analysis Period (Start/End Time): Define the time range for volume calculations.
Volume Unit: Select USDT, Active (active contracts), or Contracts for volume display.
Interpreting Signals:
Comparison Table (Top-Right Corner): Displays analysis results for all four calculation methods (Long/Short Ratio, Buy %, Sell %, Signal), enabling method comparison.
On-Chart Labels: Show total volume, buy/sell volumes, Long/Short Ratio, buy/sell percentages, current method, and sensitivity.
Color-Coded Signals:
Green: Potential Long (buy) opportunity.
Red: Potential Short (sell) opportunity.
Yellow: Market in equilibrium zone.
Chart Levels: Horizontal lines indicate reversal levels (green for Long, red for Short, yellow for equilibrium) with a transparency gradient for clarity.
Applying in Trading:
Use reversal signals to enter positions. For example, a "Maximum Long Signal" may indicate a strong buying opportunity.
Equilibrium zones help avoid trading during low-volatility periods.
Compare methods in the table to confirm signals.
Adjust settings to match your timeframe and asset. For instance, use "Tick Based" with high sensitivity for scalping on minute charts or "Price Movement" with low sensitivity for long-term trading.
Recommendations:
Test the indicator on historical data to optimize settings for your asset and strategy.
Combine indicator signals with other technical analysis tools (e.g., support/resistance levels or trend indicators) for greater accuracy.
Regularly update the time range (Start/End Time) to ensure relevant data analysis.
Who Is This Indicator For?
"Balance & Reversal Indicator " is ideal for traders who:
Trade on cryptocurrency exchanges and want to analyze trading volumes.
Seek reversal points for entering Long or Short positions.
Prefer customizable settings and the ability to compare different analysis methods.
Operate across various timeframes, from minutes to months.
Note: This indicator is not financial advice. Always conduct your own analysis and consider risks before making trading decisions.
© TradingStrategyCourses, 2025. All rights reserved.

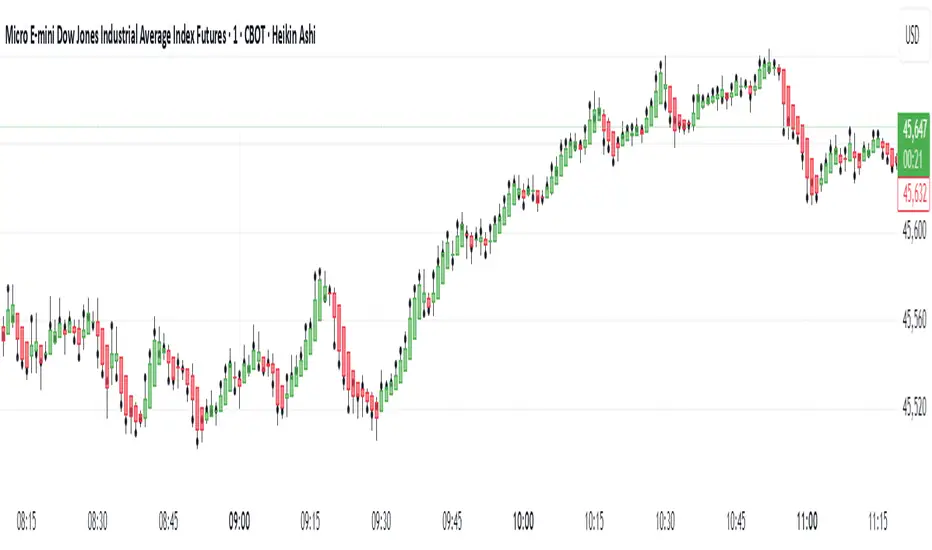
Real Close Overlay for Heiken AshiDescription:
The Real Close on Heiken Ashi indicator solves one of the biggest problems traders face when using Heiken Ashi candles, the fact that the displayed close is not the true market close.
By default, Heiken Ashi modifies the open, high, low, and close values to create smoother-looking candles. This makes them great for identifying trends, but it also means entries and exits can be misleading if you rely only on the chart.
This tool fixes that by overlaying the real closing price (traditional candlestick close) directly onto your Heiken Ashi chart.
How It Works:
- Plots the true closing price of each bar (from standard candles) onto your Heiken Ashi chart.
- Displays a small, unobtrusive marker (black dot by default) so you can instantly see where price actually closed. Not only does it plot the close, but it moves with real price as the candle is forming so price action is not lost.
- Updates in real time with every new bar.
Why It Matters:
- Use Heiken Ashi for trend clarity without losing price accuracy.
- Avoid entering/exiting based on inaccurate Heiken Ashi body closes.
- Improves stop-loss and take-profit placement by showing where price truly ended the candle.
- Essential for scalpers and short-term traders who need precision without losing true price action.
Best Uses:
- Combine with Heiken Ashi for momentum trading.
- Verify breakout confirmations against the real close.
- Use as an execution reference if you trade a HA-based system.
Disclaimer:
This script is for educational purposes only. It is open source and fully accessible. It does not provide financial advice. Always test thoroughly before applying to live markets.
HorizonSigma Pro [CHE]HorizonSigma Pro
Disclaimer
Not every timeframe will yield good results . Very short charts are dominated by microstructure noise, spreads, and slippage; signals can flip and the tradable edge shrinks after costs. Very high timeframes adapt more slowly, provide fewer samples, and can lag regime shifts. When you change timeframe, you also change the ratios between horizon, lookbacks, and correlation windows—what works on M5 won’t automatically hold on H1 or D1. Liquidity, session effects (overnight gaps, news bursts), and volatility do not scale linearly with time. Always validate per symbol and timeframe, then retune horizon, z-length, correlation window, and either the neutral band or the z-threshold. On fast charts, “components” mode adapts quicker; on slower charts, “super” reduces noise. Keep prior-shift and calibration enabled, monitor Hit Rate with its confidence interval and the Brier score, and execute only on confirmed (closed-bar) values.
For example, what do “UP 61%” and “DOWN 21%” mean?
“UP 61%” is the model’s estimated probability that the close will be higher after your selected horizon—directional probability, not a price target or profit guarantee. “DOWN 21%” still reports the probability of up; here it’s 21%, which implies 79% for down (a short bias). The label switches to “DOWN” because the probability falls below your short threshold. With a neutral-band policy, for example ±7%, signals are: Long above 57%, Short below 43%, Neutral in between. In z-score mode, fixed z-cutoffs drive the call instead of percentages. The arrow length on the chart is an ATR-scaled projection to visualize reach; treat it as guidance, not a promise.
Part 1 — Scientific description
Objective.
The indicator estimates the probability that price will be higher after a user-defined horizon (a chosen number of bars) and emits long, short, or neutral decisions under explicit thresholds. It combines multi‑feature, z‑normalized inputs, adaptive correlation‑based weighting, a prior‑shifted sigmoid mapping, optional rolling probability calibration, and repaint‑safe confirmation. It also visualizes an ATR‑scaled forward projection and prints a compact statistics panel.
Data and labeling.
For each bar, the target label is whether price increased over the past chosen horizon. Learning is deliberately backward‑looking to avoid look‑ahead: features are associated with outcomes that are only known after that horizon has elapsed.
Feature engineering.
The feature set includes momentum, RSI, stochastic %K, MACD histogram slope, a normalized EMA(20/50) trend spread, ATR as a share of price, Bollinger Band width, and volume normalized by its moving average. All features are standardized over rolling windows. A compressed “super‑feature” is available that aggregates core trend and momentum components while penalizing excessive width (volatility). Users can switch between a “components” mode (weighted sum of individual features) and a “super” mode (single compressed driver).
Weighting and learning.
Weights are the rolling correlations between features (evaluated one horizon ago) and realized directional outcomes, smoothed by an EMA and optionally clamped to a bounded range to stabilize outliers. This produces an adaptive, regime‑aware weighting without explicit machine‑learning libraries.
Scoring and probability mapping.
The raw score is either the weighted component sum or the weighted super‑feature. The score is standardized again and passed through a sigmoid whose steepness is user‑controlled. A “prior shift” moves the sigmoid’s midpoint to the current base rate of up moves, estimated over the evaluation window, so that probabilities remain well‑calibrated when markets drift bullish or bearish. Probabilities and standardized scores are EMA‑smoothed for stability.
Decision policy.
Two modes are supported:
- Neutral band: go long if the probability is above one half plus a user‑set band; go short if it is below one half minus that band; otherwise stay neutral.
- Z‑score thresholds: use symmetric positive/negative cutoffs on the standardized score to trigger long/short.
Repaint protection.
All values used for decisions can be locked to confirmed (closed) bars. Intrabar updates are available as a preview, but confirmed values drive evaluation and stats.
Calibration.
An optional rolling linear calibration maps past confirmed probabilities to realized outcomes over the evaluation window. The mapping is clipped to the unit interval and can be injected back into the decision logic if desired. This improves reliability (probabilities that “mean what they say”) without necessarily improving raw separability.
Evaluation metrics.
The table reports: hit rate on signaled bars; a Wilson confidence interval for that hit rate at a chosen confidence level; Brier score as a measure of probability accuracy; counts of long/short trades; average realized return by side; profit factor; net return; and exposure (signal density). All are computed on rolling windows consistent with the learning scheme.
Visualization.
On the chart, an arrowed projection shows the predicted direction from the current bar to the chosen horizon, with magnitude scaled by ATR (optionally scaled by the square‑root of the horizon). Labels display either the decision probability or the standardized score. Neutral states can display a configurable icon for immediate recognition.
Computational properties.
The design relies on rolling means, standard deviations, correlations, and EMAs. Per‑bar cost is constant with respect to history length, and memory is constant per tracked series. Graphical objects are updated in place to obey platform limits.
Assumptions and limitations.
The method is correlation‑based and will adapt after regime changes, not before them. Calibration improves probability reliability but not necessarily ranking power. Intrabar previews are non‑binding and should not be evaluated as historical performance.
Part 2 — Trader‑facing description
What it does.
This tool tells you how likely price is to be higher after your chosen number of bars and converts that into Long / Short / Neutral calls. It learns, in real time, which components—momentum, trend, volatility, breadth, and volume—matter now, adjusts their weights, and shows you a probability line plus a forward arrow scaled by volatility.
How to set it up.
1) Choose your horizon. Intraday scalps: 5–10 bars. Swings: 10–30 bars. The default of 14 bars is a balanced starting point.
2) Pick a feature mode.
- components: granular and fast to adapt when leadership rotates between signals.
- super: cleaner single driver; less noise, slightly slower to react.
3) Decide how signals are triggered.
- Neutral band (probability based): intuitive and easy to tune. Widen the band for fewer, higher‑quality trades; tighten to catch more moves.
- Z‑score thresholds: consistent numeric cutoffs that ignore base‑rate drift.
4) Keep reliability helpers on. Leave prior shift and calibration enabled to stabilize probabilities across bullish/bearish regimes.
5) Smoothing. A short EMA on the probability or score reduces whipsaws while preserving turns.
6) Overlay. The arrow shows the call and a volatility‑scaled reach for the next horizon. Treat it as guidance, not a promise.
Reading the stats table.
- Hit Rate with a confidence interval: your recent accuracy with an uncertainty range; trust the range, not only the point.
- Brier Score: lower is better; it checks whether a stated “70%” really behaves like 70% over time.
- Profit Factor, Net Return, Exposure: quick triage of tradability and signal density.
- Average Return by Side: sanity‑check that the long and short calls each pull their weight.
Typical adjustments.
- Too many trades? Increase the neutral band or raise the z‑threshold.
- Missing the move? Tighten the band, or switch to components mode to react faster.
- Choppy timeframe? Lengthen the z‑score and correlation windows; keep calibration on.
- Volatility regime change? Revisit the ATR multiplier and enable square‑root scaling of horizon.
Execution and risk.
- Size positions by volatility (ATR‑based sizing works well).
- Enter on confirmed values; use intrabar previews only as early signals.
- Combine with your market structure (levels, liquidity zones). This model is statistical, not clairvoyant.
What it is not.
Not a black‑box machine‑learning model. It is transparent, correlation‑weighted technical analysis with strong attention to probability reliability and repaint safety.
Suggested defaults (robust starting point).
- Horizon 14; components mode; weight EMA 10; correlation window 500; z‑length 200.
- Neutral band around seven percentage points, or z‑threshold around one‑third of a standard deviation.
- Prior shift ON, Calibration ON, Use calibrated for decisions OFF to start.
- ATR multiplier 1.0; square‑root horizon scaling ON; EMA smoothing 3.
- Confidence setting equivalent to about 95%.
Disclaimer
No indicator guarantees profits. HorizonSigma Pro is a decision aid; always combine with solid risk management and your own judgment. Backtest, forward test, and size responsibly.
The content provided, including all code and materials, is strictly for educational and informational purposes only. It is not intended as, and should not be interpreted as, financial advice, a recommendation to buy or sell any financial instrument, or an offer of any financial product or service. All strategies, tools, and examples discussed are provided for illustrative purposes to demonstrate coding techniques and the functionality of Pine Script within a trading context.
Any results from strategies or tools provided are hypothetical, and past performance is not indicative of future results. Trading and investing involve high risk, including the potential loss of principal, and may not be suitable for all individuals. Before making any trading decisions, please consult with a qualified financial professional to understand the risks involved.
By using this script, you acknowledge and agree that any trading decisions are made solely at your discretion and risk.
Enhance your trading precision and confidence 🚀
Best regards
Chervolino

Volume Profile + VAH, VAL, and POCWhat it is
A clean, on-chart volume profile that approximates your visible range using a configurable Bars Back window. It builds a horizontal histogram of volume by price, splits each price bin into Buy vs Sell volume, draws POC, and computes Value Area High/Low (VAH/VAL). A Stealth Mode toggle switches to a subtle grayscale palette for low-key charts.
Why this instead of the built-in VPVR?
Buy/Sell split per bin: See which prices were defended by buyers vs sellers, not just total volume.
Value Area from POC outward: Classic expansion method until the selected % of total volume (default 70%).
Sleek borders & Stealth Mode: Crisp bin outlines and a one-click professional colorway.
Deterministic & fast: No sessions or anchors needed—set your Bars Back and go.
How it works (under the hood)
Window selection – Pine can’t read your viewport, so we approximate it with Bars Back (user input).
Binning – The window’s price range is divided into N bins.
Volume allocation – For each bar in the window:
Distribute Across Hi–Lo (optional): Spread volume across all bins the bar overlaps, weighted by overlap; or
Single-price mode: Assign all volume to one bin using a representative price (hlc3).
Buy/Sell split (two methods):
Body Proportional (recommended): Split by relative up/down body size (|close−open|).
Up/Down Candle: 100% buy if close ≥ open, else 100% sell.
POC & VA: Point of Control is the bin with max total volume. VAH/VAL expands from POC toward the higher-volume neighbor until the selected % of total volume is included.
Reading the visuals
Horizontal bars (right side): Total volume per price bin.
Left sub-segment = Sell volume
Right sub-segment = Buy volume
POC line: Price level with peak total volume.
VAH / VAL (dashed): Upper and lower bounds of the selected Value Area.
Borders: Each bin has a clean outer outline so the profile looks tight and organized.
Stealth Mode: Grayscale palette that preserves contrast without loud colors.
Key inputs (organized for clarity)
Theme
Stealth Mode: Toggles the grayscale look.
Core
Price Bins: Vertical resolution of the profile.
Lookback (Bars): Approximates your visible range.
Style
Profile Width (bars): How far the histogram extends to the right.
Bin Border Width: Outline thickness.
Markers & Lines
Show POC, Show VAH/VAL, Value Area %, VA line width.
Advanced
Distribute Volume Across Hi–Lo: More accurate, heavier compute.
Buy/Sell Split Method: Body Proportional (realistic) or Up/Down (simple).
Tips & best practices
Start with Body Proportional + Distribute Across ON for intraday accuracy.
If the chart lags, reduce Price Bins or Bars Back, or switch off distribution.
For small windows, fewer bins often looks cleaner (e.g., 30–60).
Stealth Mode plays nicely with both dark and light chart themes.
Limitations & notes
Viewport: Pine can’t access the actual visible bars; Bars Back is a practical stand-in.
Buy/Sell split: This is an approximation from candle bodies, not true bid/ask delta.
Designed for overlay; profile renders to the right of the latest bar.

SMC - Institutional Confidence Oscillator [PhenLabs]📊 Institutional Confidence Oscillator
Version: PineScript™v6
📌 Description
The Institutional Confidence Oscillator (ICO) revolutionizes market analysis by automatically detecting and evaluating institutional activity at key support and resistance levels using our own in-house detection system. This sophisticated indicator combines volume analysis, volatility measurements, and mathematical confidence algorithms to provide real-time readings of institutional sentiment and zone strength.
Using our advanced thin liquidity detection, the ICO identifies high-volume, narrow-range bars that signal institutional zone formation, then tracks how these zones perform under market pressure. The result is a dual-wave confidence oscillator that shows traders when institutions are actively defending price levels versus when they’re abandoning positions.
The indicator transforms complex institutional behavior patterns into clear, actionable confidence percentiles, helping traders align with smart money movements and avoid common retail trading pitfalls.
🚀 Points of Innovation
Automated thin liquidity zone detection using volume threshold multipliers and zone size filtering
Dual-sided confidence tracking for both support and resistance levels simultaneously
Sigmoid function processing for enhanced mathematical accuracy in confidence calculations
Real-time institutional defense pattern analysis through complete test cycles
Advanced visual smoothing options with multiple algorithmic methods (EMA, SMA, WMA, ALMA)
Integrated momentum indicators and gradient visualization for enhanced signal clarity
🔧 Core Components
Volume Threshold System: Analyzes volume ratios against baseline averages to identify institutional activity spikes
Zone Detection Algorithm: Automatically identifies thin liquidity zones based on customizable volume and size parameters
Confidence Lifecycle Engine: Tracks institutional defense patterns through complete observation windows
Mathematical Processing Core: Uses sigmoid functions to convert raw market data into normalized confidence percentiles
Visual Enhancement Suite: Provides multiple smoothing methods and customizable display options for optimal chart interpretation
🔥 Key Features
Auto-Detection Technology: Automatically scans for institutional zones without manual intervention, saving analysis time
Dual Confidence Tracking: Simultaneously monitors both support and resistance institutional activity for comprehensive market view
Smart Zone Validation: Evaluates zone strength through volume analysis, adverse excursion measurement, and defense success rates
Customizable Parameters: Extensive input options for volume thresholds, observation windows, and visual preferences
Real-Time Updates: Continuously processes market data to provide current institutional confidence readings
Enhanced Visualization: Features gradient fills, momentum indicators, and information panels for clear signal interpretation
🎨 Visualization
Dual Oscillator Lines: Support confidence (cyan) and resistance confidence (red) plotted as percentage values 0-100%
Gradient Fill Areas: Color-coded regions showing confidence dominance and strength levels
Reference Grid Lines: Horizontal markers at 25%, 50%, and 75% levels for easy interpretation
Information Panel: Real-time display of current confidence percentiles with color-coded dominance indicators
Momentum Indicators: Rate of change visualization for confidence trends
Background Highlights: Extreme confidence level alerts when readings exceed 80%
📖 Usage Guidelines
Auto-Detection Settings
Use Auto-Detection
Default: true
Description: Enables automatic thin liquidity zone identification based on volume and size criteria
Volume Threshold Multiplier
Default: 6.0, Range: 1.0+
Description: Controls sensitivity of volume spike detection for zone identification, higher values require more significant volume increases
Volume MA Length
Default: 15, Range: 1+
Description: Period for volume moving average baseline calculation, affects volume spike sensitivity
Max Zone Height %
Default: 0.5%, Range: 0.05%+
Description: Filters out wide price bars, keeping only thin liquidity zones as percentage of current price
Confidence Logic Settings
Test Observation Window
Default: 20 bars, Range: 2+
Description: Number of bars to monitor zone tests for confidence calculation, longer windows provide more stable readings
Clean Break Threshold
Default: 1.5 ATR, Range: 0.1+
Description: ATR multiple required for zone invalidation, higher values make zones more persistent
Visual Settings
Smoothing Method
Default: EMA, Options: SMA/EMA/WMA/ALMA
Description: Algorithm for signal smoothing, EMA responds faster while SMA provides more stability
Smoothing Length
Default: 5, Range: 1-50
Description: Period for smoothing calculation, higher values create smoother lines with more lag
✅ Best Use Cases
Trending market analysis where institutional zones provide reliable support/resistance levels
Breakout confirmation by validating zone strength before position entry
Divergence analysis when confidence shifts between support and resistance levels
Risk management through identification of high-confidence institutional backing
Market structure analysis for understanding institutional sentiment changes
⚠️ Limitations
Performs best in liquid markets with clear institutional participation
May produce false signals during low-volume or holiday trading periods
Requires sufficient price history for accurate confidence calculations
Confidence readings can fluctuate rapidly during high-impact news events
Manual fallback zones may not reflect actual institutional activity
💡 What Makes This Unique
Automated Detection: First Pine Script indicator to automatically identify thin liquidity zones using sophisticated volume analysis
Dual-Sided Analysis: Simultaneously tracks institutional confidence for both support and resistance levels
Mathematical Precision: Uses sigmoid functions for enhanced accuracy in confidence percentage calculations
Real-Time Processing: Continuously evaluates institutional defense patterns as market conditions change
Visual Innovation: Advanced smoothing options and gradient visualization for superior chart clarity
🔬 How It Works
1. Zone Identification Process:
Scans for high-volume bars that exceed the volume threshold multiplier
Filters bars by maximum zone height percentage to identify thin liquidity conditions
Stores qualified zones with proximity threshold filtering for relevance
2. Confidence Calculation Process:
Monitors price interaction with identified zones during observation windows
Measures volume ratios and adverse excursions during zone tests
Applies sigmoid function processing to normalize raw data into confidence percentiles
3. Real-Time Analysis Process:
Continuously updates confidence readings as new market data becomes available
Tracks institutional defense success rates and zone validation patterns
Provides visual and numerical feedback through the oscillator display
💡 Note:
The ICO works best when combined with traditional technical analysis and proper risk management. Higher confidence readings indicate stronger institutional backing but should be confirmed with price action and volume analysis. Consider using multiple timeframes for comprehensive market structure understanding.

Smart Money Trades Pro [BOSWaves]Smart Money Trades Pro – Advanced Market Structure & Liquidity Visualizer
Overview
Smart Money Trades Pro is a comprehensive trading tool designed for traders seeking an in-depth understanding of market structure, liquidity dynamics, and institutional flow. The indicator systematically identifies key market turning points, including break of structure (BOS) and change of character (CHoCH) events, and overlays these with adaptive visualizations to highlight high-probability trade setups. By integrating ATR-based risk zones, progressive take-profit levels, and real-time trade analytics, Smart Money Trades Pro transforms complex price action into an interpretable framework suitable for multiple trading styles, including scalping, intraday, and swing trading.
Unlike traditional static indicators, Smart Money Trades Pro adapts continuously to market conditions. It evaluates swing highs and lows over a configurable lookback period, then determines structural breaks using customizable confirmation methods (candle body or wick). The resulting signals are augmented with dynamic entry, stop-loss, and target levels, allowing traders to analyze potential trade opportunities with both precision and context. The indicator’s design ensures that each visual element—trend-colored candles, signal markers, and risk/reward boxes—reflects real-time market conditions, offering an actionable interpretation of institutional activity.
How It Works
The indicator’s foundation is built upon market structure analysis. By calculating pivot highs and lows over a specified period, Smart Money Trades Pro identifies potential points of liquidity accumulation and exhaustion. When price breaks a pivot high or low, the indicator evaluates whether this constitutes a BOS or a CHoCH, signaling trend continuation or reversal. These events are marked on the chart with distinct visual cues, allowing traders to quickly discern shifts in market sentiment without manually analyzing historical price action.
Once a structural break is confirmed, the indicator automatically determines entry levels, stop-loss placements, and progressive take-profit zones (TP1, TP2, TP3). These calculations are based on ATR-derived volatility, ensuring that targets scale with current market conditions. Risk and reward zones are plotted as shaded boxes, providing a clear visual representation of potential profit relative to risk for each trade setup. This system allows traders to maintain discipline and consistency, with dynamic trade management baked directly into the visualization.
Trend direction is further reinforced by color-coded candles, which reflect the prevailing market bias. Bullish trends are represented by one color, bearish trends by another, and neutral conditions are displayed in muted tones. This continuous visual feedback simplifies the process of trend assessment and helps confirm the validity of trade setups alongside BOS and CHoCH markers.
Signals and Breakouts
Smart Money Trades Pro includes structured visual signals to indicate actionable price movements:
Bullish Break Signals – Triangular markers below the candle appear when a swing high is broken, suggesting potential long opportunities.
Bearish Break Signals – Triangular markers above the candle appear when a swing low is broken, indicating potential short setups.
Change of Character (CHoCH) – Special markers highlight trend reversals, showing where momentum shifts from bullish to bearish or vice versa.
These markers are strategically spaced to prevent overlap and remain clear during high-volatility periods. Traders can use them in combination with trend-colored candles, risk/reward zones, and ATR-based targets to assess the strength and reliability of each setup. The integrated table provides live trade information, including entry price, stop-loss level, take-profit levels, risk/reward ratio, and trade direction, ensuring that trade decisions are informed and data-driven.
Interpretation
Trend Analysis : The indicator’s trend coloring, combined with BOS and CHoCH detection, provides an immediate view of market direction. Rising structures indicate bullish momentum, while falling structures signal bearish momentum. CHoCH markers highlight potential trend reversals or significant liquidity sweeps.
Volatility and Risk Assessment : ATR-based calculations determine stop-loss distances and target levels, giving a quantitative measure of risk relative to market volatility. Wide ATR readings indicate periods of high price fluctuation, whereas narrow readings suggest consolidation and reduced risk exposure.
Market Structure Insights : By monitoring swing highs and lows alongside break confirmations, traders can identify where institutional players are likely active. Areas with multiple structural breaks or overlapping targets can indicate liquidity hotspots, potential reversal zones, or areas of market congestion.
Trade Management : The built-in trade zones allow traders to visualize entry, risk, and reward simultaneously. Progressive targets (TP1, TP2, TP3) reflect incremental profit-taking strategies, while dynamic stop-loss levels help preserve capital during adverse moves.
Strategy Integration
Smart Money Trades Pro supports a range of trading approaches:
Trend Following : Enter trades in the direction of confirmed BOS while using CHoCH markers and trend-colored candles to validate momentum.
Pullback Entries : Use failed breakout retests or minor reversals toward broken structure levels for lower-risk entries.
Mean Reversion : In consolidated zones with narrow ATR and repeated BOS/CHoCH activity, anticipate reversals or short-term corrective moves.
Multi-Timeframe Confirmation : Overlay signals on higher or lower timeframes to filter noise and improve trade accuracy.
Stop-loss levels should be placed just beyond the opposing structural point, while take-profit targets can be scaled using the ATR-based zones. Progressive targets allow for partial exits or scaling out of trades while maintaining exposure to larger moves.
Advanced Techniques
Traders seeking greater precision can combine Smart Money Trades Pro with volume, momentum, or volatility indicators to validate signals. Observing sequences of BOS and CHoCH markers across multiple timeframes provides insight into liquidity accumulation and depletion trends. Tracking the expansion or contraction of ATR-based zones helps anticipate shifts in volatility, enabling better timing for entries and exits.
Customizing the structure period and confirmation type allows the indicator to adapt to different asset classes and timeframes. Shorter periods increase sensitivity to smaller swings, while longer periods filter noise and emphasize higher-probability structural breaks. By integrating these features, the indicator offers a robust statistical framework for disciplined, data-driven trading decisions.
Inputs and Customization
Structure Detection Period : Defines the lookback window for pivot high and low calculation.
Break Confirmation : Choose whether to confirm breaks using candle body or wick.
Display CHoCH : Toggle visibility of change-of-character markers.
Color Trend Bars : Enable color-coding of candles based on market structure direction.
Show Info Table : Display trade dashboard showing entry, stop-loss, take-profits, risk/reward, and bias.
Table Position : Choose from top-left, top-right, bottom-left, or bottom-right placement.
Color Customization : Configure bullish, bearish, neutral, risk, reward, and text colors for enhanced visual clarity.
Why Use Smart Money Trades Pro
Smart Money Trades Pro transforms complex market behavior into an actionable visual framework. By combining market structure analysis, liquidity tracking, ATR-based risk/reward mapping, and a dynamic trade dashboard, it provides a multidimensional view of the market. Traders can focus on execution, interpret trends, and evaluate overextensions or reversals without relying on guesswork. The indicator is suitable for scalping, intraday, and swing strategies, offering a comprehensive system for understanding and trading alongside institutional participants.

Pasrsifal.RegressionTrendStateSummary
The Parsifal.Regression.Trend.State Indicator analyzes the leading coefficients of linear and quadratic regressions of price (against time). It also considers their first- and second-order changes. These features are aggregated into a Trend-State background, shown as a gradient color. In addition, the indicator generates fast and slow signals that can be used as potential entry- or exit triggers.
This tool is designed for advanced trend-following strategies, leveraging information from multiple trendline features.
Background
Trendlines provide insight into the state of a trend or the “trendiness” of a price process. While moving averages or pivot-based lines can serve as envelopes and breakout levels, they are often too lagging for swing traders, who need tools that adapt more closely to price swings, ideally using trendlines, around which the price process swings continuously.
Regression lines address this by cutting directly through the data, making them a natural anchor for observing how price winds around a central trendline within a chosen lookback period.
Regression Trendlines
• Linear Regression:
o Minimizes distance to all closing values over the lookback period.
o The slope represents the short-term linear trend.
o The change of slope indicates trend acceleration or deceleration.
o Linear regression lags during phases of rapid market shifts.
• Quadratic Regression:
o Fits a second-degree polynomial to minimize deviation from closing prices.
o The convexity term (leading coefficient) reflects curvature:
Positive convexity → accelerating uptrend or fading downtrend.
Negative convexity → accelerating downtrend or fading uptrend.
o The change of convexity detects early shifts in momentum and often reacts faster than slope features.
Features Extracted
The indicator evaluates six features:
• Linear features: slope, first derivative of slope, second derivative of slope.
• Quadratic features: convexity term, first derivative of the convexity term, second derivative of the convexity term.
• Linear features: capture broad, background trend behavior.
• Quadratic features: detect deviations, accelerations, and smaller-scale dynamics.
Quadratic terms generally react first to market changes, while linear terms provide stability and context.
Dynamics of Market Moves as seen by linear and quadratic regressions
• At the start of a rapid move:
The change of convexity reacts first, capturing the shift in dynamics before other features. The convexity term then follows, while linear slope features lag further behind. Because convexity measures deviation from linearity, it reflects accelerating momentum more effectively than slope.
• At the end of a rapid move:
Again, the change of convexity responds first to fading momentum, signaling the transition from above-linear to below-linear dynamics. Even while a strong trend persists, the change of convexity may flip sign early, offering a warning of weakening strength. The convexity term itself adjusts more slowly but may still turn before the price process does. Linear features lag the most, typically only flipping after price has already reversed, thereby smoothing out the rapid, more sensitive reactions of quadratic terms.
________________________________________
Parsifal Regression.Trend.State Method
1. Feature Mapping:
Each feature is mapped to a range between -1 and 1, preserving zero-crossings (critical for sign interpretation).
2. Aggregation:
A heuristic linear combination*) produces a background information value, visualized as a gradient color scale:
o Deep green → strong positive trend.
o Deep red → strong negative trend.
o Yellow → neutral or transitional states.
3. Signals:
o Fast signal (oscillator): ranges from -1 to 1, reflecting short-term trend state.
o Slow signal (smoothed): moving average of the fast signal.
o Their interactions (crossovers, zero-crossings) provide actionable trading triggers.
How to Use
The Trend-State background gradient provides intuitive visual feedback on the aggregated regression features (slope, convexity, and their changes). Because these features reflect not only current trend strength but also their acceleration or deceleration, the color transitions help anticipate evolving market states:
• Solid Green: All features near their highs. Indicates a strong, accelerating uptrend. May also reflect explosive or hyperbolic upside moves (including gaps).
• Fading Solid Green: A recently strong uptrend is losing momentum. Price may shift into a slower uptrend, consolidation, or even a reversal.
• Fading Green → Yellow: Often appears as a dirty yellow or a rapidly mixing pattern of green and red. Signals that the uptrend is weakening toward neutrality or beginning to turn negative.
• Yellow → Deepening Red: Two possible scenarios:
o Coming from a strong uptrend → suggests a sharp fade, though the trend may still technically be up.
o Coming from a weaker uptrend or sideways market → suggests the start of an accelerating downtrend.
• Solid Red: All features near their lows. Indicates a strong, accelerating downtrend. May also reflect crash-type conditions or downside gaps.
• Fading Solid Red: A recently strong downtrend is losing strength. Market may move into a slower decline, consolidation, or early reversal upward.
• Fading Red → Yellow : The downtrend is weakening toward neutral, with potential for a bullish shift.
• Yellow → Increasing Green: Two possible scenarios:
o Coming from a strong downtrend, it reflects a sharp fade of bearish momentum, though the market may still technically be trending down.
o Coming from a weaker downtrend or sideways movement, it suggests the start of an accelerating uptrend.
Note: Market evolution does not always follow this neat “color cycle.” It may jump between states, skip stages, or reverse abruptly depending on market conditions. This makes the background coloring particularly valuable as a contextual map of current and evolving price dynamics.
Signal Crossovers:
Although the fast signal is very similar (but not identical) to the background coloring, it provides a numerical representation indicating a bullish interpretation for rising values and bearish for falling.
o High-confidence entries:
Fast signal rising from < -0.7 and crossing above the slow signal → potential long entry.
Fast signal falling from > +0.7 and crossing below the slow signal → potential short entry.
o Low-confidence entries:
Crossovers near zero may still provide a valid trigger but may be noisy and should be confirmed with other signals.
o Zero-crossings:
Indicate broader state changes, useful for conservative positioning or option strategies. For confirmation of a Fast signal 0-crossing, wait for the Slow signal to cross as well.
________________________________________
*) Note on Aggregation
While the indicator currently uses a heuristic linear combination of features, alternatives such as Principal Component Analysis (PCA) could provide a more formal aggregation. However, while in the absence of matrix algebra, the required eigenvalue decomposition can be approximated, its computational expense does not justify the marginal higher insight in this case. The current heuristic approach offers a practical balance of clarity, speed, and accuracy.

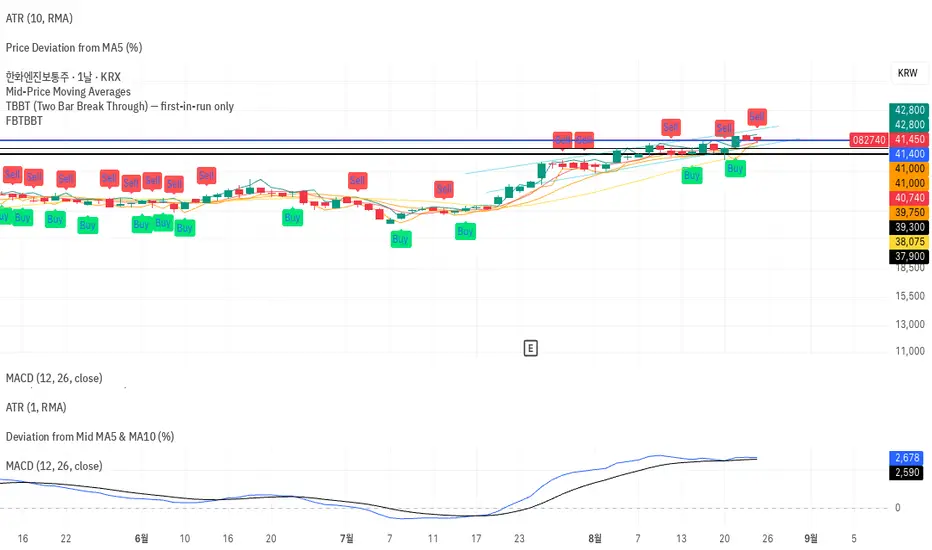
FBTBBT (Filtered Black Two Bar Break Through)📘 FBTBBT (Filtered Black Two Bar Break Through)
Overview
FBTBBT is a filtered breakout indicator based on the classical Two Bar Break Through (TBBT) concept.
It generates Buy and Sell signals when price breaks above or below the previous bar’s high/low, but only displays the **first signal in a run** to avoid noise and duplicates.
- Buy Signal → Break above previous high
- Sell Signal → Break below previous low
- Filtered → Only the first signal in a consecutive streak is shown
---
Key Features
1. Filtered Signals
• Avoids repeated identical signals.
• Example: 3 consecutive bars breaking the previous low → only the first bar shows a Sell signal.
2. Confirmation Options
• Real-Time Mode: signals appear intrabar as soon as the breakout happens.
• Close Confirmation: signals appear only after bar close beyond previous high/low (reduces repainting).
3. Visual Aids
• Green “Buy” labels below breakout bars.
• Red “Sell” labels above breakout bars.
• Optional lines for previous bar’s high/low levels.
4. Alerts
• Alerts trigger only on the first filtered signal in each run.
• Messages specify breakout above (Buy) or below (Sell).
---
How to Use
• Add FBTBBT to your TradingView chart.
• Choose Real-Time or Close-Confirmed signals depending on your style.
• Focus on the **first breakout signal**; ignore duplicates until the opposite side appears.
• Combine with trend filters, volume, or higher timeframe context for stronger accuracy.
---
👉 In short:
**FBTBBT = Clean, filtered breakout signals with no noise.**
Perfect for traders who want **precise first-bar breakouts** while avoiding repeated alerts.
Harmonic Patterns + Fib [CRT Trader]Overview
The Harmonic Patterns Fibonacci indicator is an advanced technical analysis tool designed to automatically detect and visualize Fibonacci-based harmonic patterns on financial charts. This indicator helps traders identify high-probability reversal zones and potential entry/exit points based on precise mathematical relationships.
Supported Patterns
5-Point Patterns (X-A-B-C-D Structure)
Gartley Pattern: The most common harmonic pattern with reliable reversal signals
AB/XA = 0.618, BC/AB = 0.618, CD/BC = 1.272, AD/XA = 0.786
Butterfly Pattern: Strong reversal pattern indicating potential trend changes
AB/XA = 0.786, BC/AB = 0.618, CD/BC = 1.618, AD/XA = 1.270
Bat Pattern: Medium-term reversal pattern with high accuracy
AB/XA = 0.382, BC/AB = 0.886, CD/BC = 1.618, AD/XA = 0.886
Crab Pattern: Aggressive reversal pattern with extended D point
AB/XA = 0.618, BC/AB = 0.886, CD/BC = 2.240, AD/XA = 1.618
Shark Pattern: Trend continuation or reversal pattern
AB/XA = 0.618, BC/AB = 1.130, CD/BC = 1.618, AD/XA = 0.886
4-Point Pattern (A-B-C-D Structure)
ABCD Pattern: Basic harmonic structure forming the foundation of all patterns
BC/AB = 0.382-0.886, CD/BC = 1.130-2.618
Key Features
Fibonacci Validation
Each pattern is validated against precise Fibonacci ratios with customizable tolerance
Mathematical accuracy ensures reliable pattern recognition
Eliminates false signals through strict ratio requirements
Performance Optimization
Pivot Detection: Automatically identifies significant highs and lows
Scan Frequency Control: Adjustable scanning intervals to optimize performance
Early Exit Algorithms: Efficient computation to reduce processing load
Pattern Limit: Control maximum number of patterns displayed
Visual Elements
Pattern Lines: Clear visualization of pattern structure with colored lines
Fill Areas: Highlighted zones between pattern legs
Point Labels: X, A, B, C, D markers for easy identification
Fibonacci Levels: Optional Fibonacci retracement/extension levels
Bullish/Bearish Colors: Green for bullish, red for bearish patterns
Customizable Settings
Pattern Selection: Enable/disable specific pattern types
Tolerance Adjustment: Fine-tune pattern recognition sensitivity (5-30%)
Color Customization: Personalize visual appearance
Information Table: Optional statistics display
Trading Applications
Entry Signals
Reversal Zones: Identify high-probability reversal areas at pattern completion
Confluence Trading: Combine with other technical indicators for confirmation
Risk Management: Use pattern structure to define stop-loss levels
Market Analysis
Support/Resistance: Pattern points often act as future S/R levels
Price Targets: Fibonacci extensions provide potential profit targets
Market Structure: Understand underlying market geometry and rhythm
Strategy Integration
Swing Trading: Ideal for medium-term position entries
Position Trading: Long-term trend reversal identification
Day Trading: Intraday reversal patterns on lower timeframes
How to Use
Add to Chart: Apply the indicator to any timeframe and instrument
Configure Settings: Adjust tolerance, colors, and pattern types as needed
Wait for Completion: Patterns are valid only when D point is formed
Confirm with Volume: Look for volume confirmation at pattern completion
Set Stop Loss: Place stops beyond X point for 5-point patterns, or A point for ABCD
Target Levels: Use Fibonacci extensions for profit targets
Important Notes
Pattern Completion: Wait for full pattern formation before taking action
Market Context: Consider overall market trend and conditions
Risk Management: Always use appropriate position sizing and stops
Backtesting: Test the indicator on historical data before live trading
Multiple Timeframes: Analyze patterns across different timeframes for confirmation
Technical Requirements
Lookback Period: Adjustable pivot detection sensitivity
Depth Setting: Controls how far back the algorithm searches for patterns
Memory Efficient: Optimized for real-time performance without lag
This indicator is suitable for all experience levels, from beginners learning harmonic patterns to advanced traders seeking automated pattern recognition. The combination of mathematical precision and visual clarity makes it an essential tool for harmonic trading strategies.

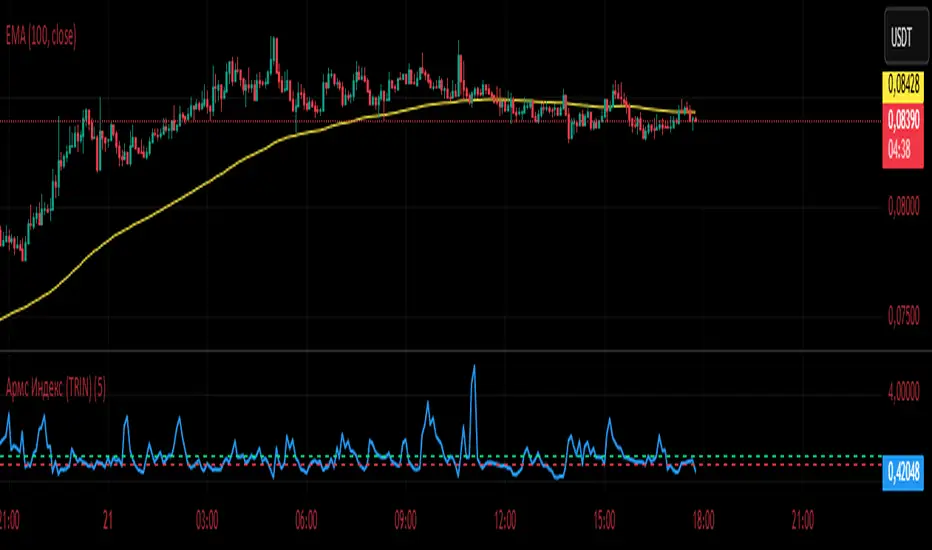
Армс Индекс (TRIN)
Arms Indicator (TRIN)
General description
This indicator is designed to visualize the overbought and oversold levels of the stock market. The Arms Index (TRIN) evaluates the ratio of the number of rising and falling stocks to the corresponding ratio of the trading volume of rising and falling stocks. The lower the TRIN indicator, the more overbought the market is, and vice versa — a high TRIN indicates oversold conditions.
How to interpret the signal?
- Zone below 0.8: The market is overbought, and a downward correction is likely to follow soon.
- Zone above 1.2: The market is oversold, an upward reversal is possible.
These zones help to identify entry and exit points in a timely manner, optimizing trading decisions.
Implementation features
1. Calculation method: The classic TRIN formula is based on the ratio of volume indicators of rising and falling assets.
2. Averaging interval: A moving average (MA) is used with a configurable default period of five days. The user can change this value manually.
3. Level display: The chart shows two key levels: the oversold (1.2) and overbought (0.8) lines. These lines are guidelines for decision-making.
Instructions for use
1. Upload the indicator to the chart of your financial instrument.
2. Keep an eye on the TRIN value: does it cross the critical levels (1.2 and 0.8)?
3. Use the TRIN readings as an additional filter to confirm the signal of your main strategies.
Remember that the Arms index is best used in conjunction with other technical analysis indicators to achieve maximum signal accuracy.
---
I hope this implementation will help you to trade more efficiently and find the best opportunities in the market!
© The authorship belongs to Eva-S-Apple.
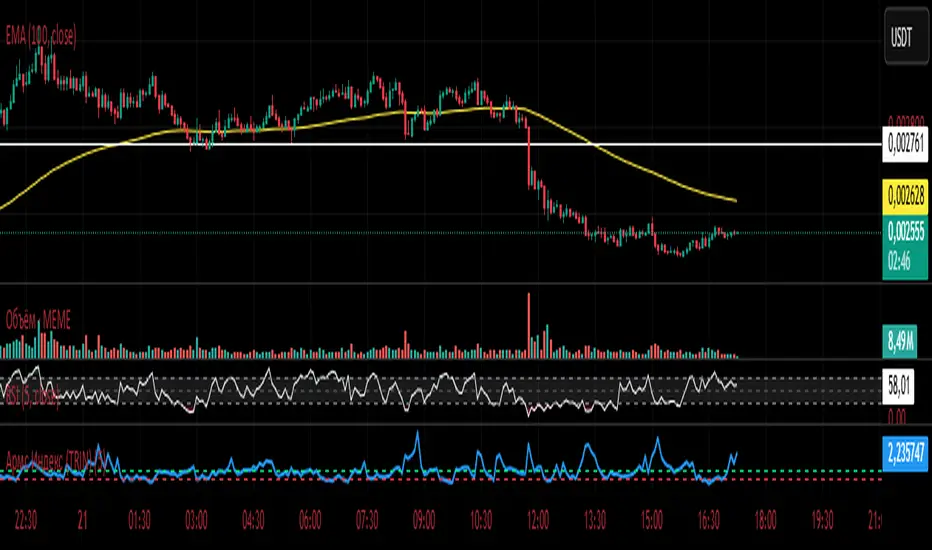
Армс Индекс (TRIN)Arms Indicator (TRIN)
General description
This indicator is designed to visualize the overbought and oversold levels of the stock market. The Arms Index (TRIN) evaluates the ratio of the number of rising and falling stocks to the corresponding ratio of the trading volume of rising and falling stocks. The lower the TRIN indicator, the more overbought the market is, and vice versa — a high TRIN indicates oversold conditions.
How to interpret the signal?
- Zone below 0.8: The market is overbought, and a downward correction is likely to follow soon.
- Zone above 1.2: The market is oversold, an upward reversal is possible.
These zones help to identify entry and exit points in a timely manner, optimizing trading decisions.
Implementation features
1. Calculation method: The classic TRIN formula is based on the ratio of volume indicators of rising and falling assets.
2. Averaging interval: A moving average (MA) is used with a configurable default period of five days. The user can change this value manually.
3. Level display: The chart shows two key levels: the oversold (1.2) and overbought (0.8) lines. These lines are guidelines for decision-making.
Instructions for use
1. Upload the indicator to the chart of your financial instrument.
2. Keep an eye on the TRIN value: does it cross the critical levels (1.2 and 0.8)?
3. Use the TRIN readings as an additional filter to confirm the signal of your main strategies.
Remember that the Arms index is best used in conjunction with other technical analysis indicators to achieve maximum signal accuracy.
---
I hope this implementation will help you to trade more efficiently and find the best opportunities in the market!
© The authorship belongs to Eva-S-Apple.
Gott's Copernican Trend PredictorThe Gott's Copernican Trend Predictor predicts trend duration using the Copernican Principle - Based on astrophysicist Richard Gott's temporal prediction method.
I had the idea to create this indicator after reading the book The Doomsday Calculation by William Poundstone.
Background & Theory
This indicator implements J. Richard Gott III's Copernican Principle - a statistical method that famously predicted the fall of the Berlin Wall and the duration of Broadway shows with remarkable accuracy.
The Copernican Principle Explained
Named after Copernicus who showed that Earth is not at the center of the universe, this principle assumes that you are not observing something at a special moment in time. When you observe a trend at any random point, you're statistically more likely to be seeing it during the "middle portion" of its lifetime rather than at its very beginning or end.
The Mathematics
Gott's formula provides a 95% confidence interval for how much longer a trend will continue:
Minimum remaining duration = Current Age ÷ 39
Maximum remaining duration = Current Age × 39
The factor of 39 comes from statistical analysis where:
There's only a 2.5% chance you're observing in the first 1/40th of the trend's life
There's only a 2.5% chance you're observing in the last 1/40th of the trend's life
This gives us 95% confidence that the trend will last between Age/39 and Age×39
How It Works
Trend Detection
The indicator uses dual moving averages (default: 50 & 200 period) to identify trend changes:
Bullish Cross: Fast MA crosses above Slow MA → Uptrend begins
Bearish Cross: Fast MA crosses below Slow MA → Downtrend begins
Real-Time Predictions
Once a trend is detected, the indicator continuously calculates:
Trend Age: How long the current trend has been active
Gott's 95% CI: Statistical range for remaining trend duration
Projected End Dates: Calendar dates when the trend might end
How to Use
Setup
Add the indicator to any timeframe (works on minutes, hours, days, weeks)
Customize MA periods and type (SMA, EMA, WMA)
Choose table position and font size for optimal viewing
Interpretation
Example: If a trend is 100 hours old:
Minimum duration: 100 ÷ 39 = ~3 more hours
Maximum duration: 100 × 39 = ~3,900 more hours
95% confidence: The trend will end between these times
This indicator might be useful for swing traders, trend followers, and quantitative analysts.
Coca-Cola example:
Coca-Cola's chart shows an uptrend spanning 810 weeks, approximately 15.5 years. According to Gott's Copernican Principle, this trend age generates a 95% confidence interval predicting the trend will continue for a minimum of 20 weeks and a maximum of 31,590 weeks.
On the other hand, a shorter trend age produces a proportionally smaller minimum duration and different risk profile in terms of statistical continuation probability. For this reason, more recent trends (and more recent companies) are likely to remain in trend for shorter.
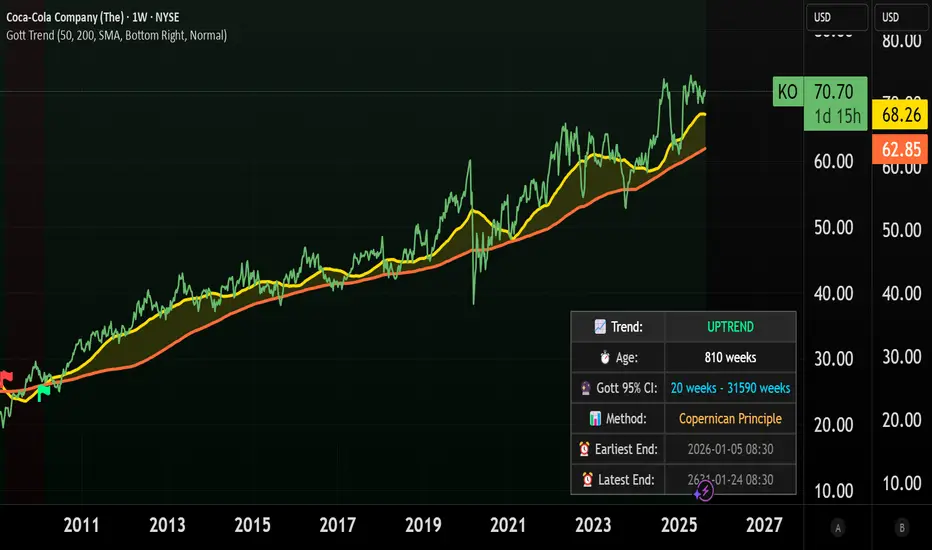
VSA Signals [odnac]This indicator applies Volume Spread Analysis (VSA) concepts to highlight important supply and demand events directly on the chart. It automatically detects common VSA patterns using price spread, relative volume, and candle structure, with optional trend filtering for higher accuracy.
Features:
Stopping Volume (SV): Signals potential end of a downtrend when heavy buying appears.
Buying Climax (BC): Indicates exhaustion of an uptrend with heavy volume near the top.
No Supply (NS): Weak selling pressure, often a bullish sign in an uptrend.
No Demand (ND): Weak buying interest, often a bearish sign in a downtrend.
Test: Low-volume test bar probing for supply.
Up-thrust (UT): Failed breakout with long upper wick, often a bearish trap.
Shakeout: Bear trap with high-volume wide down bar closing low.
Demand Absorption (DA): Demand absorbing heavy selling pressure.
Supply Absorption (SA): Supply absorbing heavy buying pressure.
Additional Options:
Background highlights for detected signals.
Configurable moving average (SMA, EMA, WMA, VWMA) as a trend filter.
Adjustable multipliers for volume and spread sensitivity.
Legend table for quick reference of signals and meanings.
Alerts available for all signals.
This tool is designed to help traders spot professional accumulation and distribution activity and to improve trade timing by recognizing supply/demand imbalances in the market.
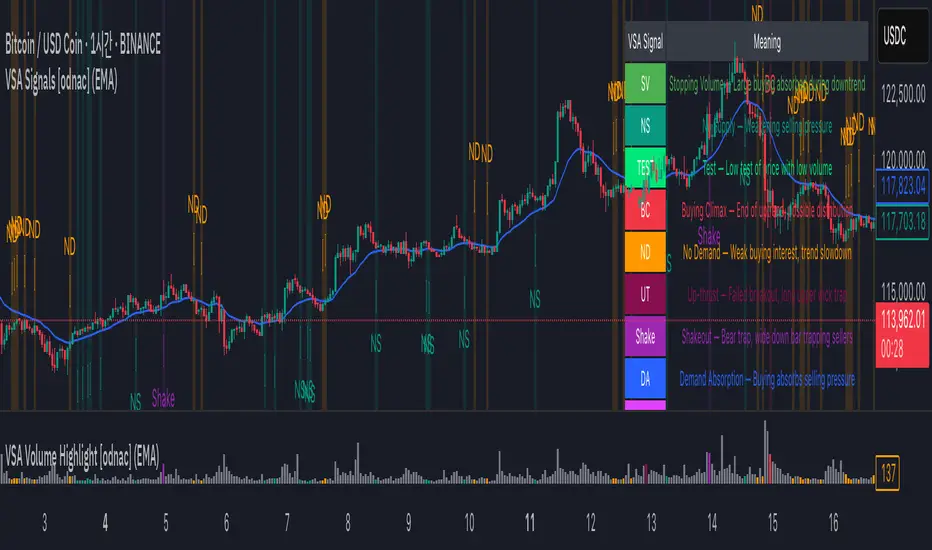
Market Outlook Score (MOS)Overview
The "Market Outlook Score (MOS)" is a custom technical indicator designed for TradingView, written in Pine Script version 6. It provides a quantitative assessment of market conditions by aggregating multiple factors, including trend strength across different timeframes, directional movement (via ADX), momentum (via RSI changes), volume dynamics, and volatility stability (via ATR). The MOS is calculated as a weighted score that ranges typically between -1 and +1 (though it can exceed these bounds in extreme conditions), where positive values suggest bullish (long) opportunities, negative values indicate bearish (short) setups, and values near zero imply neutral or indecisive markets.
This indicator is particularly useful for traders seeking a holistic "outlook" score to gauge potential entry points or market bias. It overlays on a separate pane (non-overlay mode) and visualizes the score through horizontal threshold lines and dynamic labels showing the numeric MOS value along with a simple trading decision ("Long", "Short", or "Neutral"). The script avoids using the plot function for compatibility reasons (e.g., potential TradingView bugs) and instead relies on hline for static lines and label.new for per-bar annotations.
Key features:
Multi-Timeframe Analysis: Incorporates slope data from 5-minute, 15-minute, and 30-minute charts to capture short-term trends.
Trend and Strength Integration: Uses ADX to weight trend bias, ensuring stronger signals in trending markets.
Momentum and Volume: Includes RSI momentum impulses and volume deviations for added confirmation.
Volatility Adjustment: Factors in ATR changes to assess market stability.
Customizable Inputs: Allows users to tweak periods for lookback, ADX, and ATR.
Decision Labels: Automatically classifies the MOS into actionable categories with visual labels.
This indicator is best suited for intraday or swing trading on volatile assets like stocks, forex, or cryptocurrencies. It does not generate buy/sell signals directly but can be combined with other tools (e.g., moving averages or oscillators) for comprehensive strategies.
Inputs
The script provides three user-configurable inputs via TradingView's input panel:
Lookback Period (lookback):
Type: Integer
Default: 20
Range: Minimum 10, Maximum 50
Purpose: Defines the number of bars used in slope calculations for trend analysis. A shorter lookback makes the indicator more sensitive to recent price action, while a longer one smooths out noise for longer-term trends.
ADX Period (adxPeriod):
Type: Integer
Default: 14
Range: Minimum 5, Maximum 30
Purpose: Sets the smoothing period for the Average Directional Index (ADX) and its components (DI+ and DI-). Standard value is 14, but shorter periods increase responsiveness, and longer ones reduce false signals.
ATR Period (atrPeriod):
Type: Integer
Default: 14
Range: Minimum 5, Maximum 30
Purpose: Determines the period for the Average True Range (ATR) calculation, which measures volatility. Adjust this to match your trading timeframe—shorter for scalping, longer for positional trading.
These inputs allow customization without editing the code, making the indicator adaptable to different market conditions or user preferences.
Core Calculations
The MOS is computed through a series of steps, blending trend, momentum, volume, and volatility metrics. Here's a breakdown:
Multi-Timeframe Slopes:
The script fetches data from higher timeframes (5m, 15m, 30m) using request.security.
Slope calculation: For each timeframe, it computes the linear regression slope of price over the lookback period using the formula:
textslope = correlation(close, bar_index, lookback) * stdev(close, lookback) / stdev(bar_index, lookback)
This measures the rate of price change, where positive slopes indicate uptrends and negative slopes indicate downtrends.
Variables: slope5m, slope15m, slope30m.
ATR (Average True Range):
Calculated using ta.atr(atrPeriod).
Represents average volatility over the specified period. Used later to derive volatility stability.
ADX (Average Directional Index):
A detailed, manual implementation (not using built-in ta.adx for customization):
Computes upward movement (upMove = high - high ) and downward movement (downMove = low - low).
Derives +DM (Plus Directional Movement) and -DM (Minus Directional Movement) by filtering non-relevant moves.
Smooths true range (trur = ta.rma(ta.tr(true), adxPeriod)).
Calculates +DI and -DI: plusDI = 100 * ta.rma(plusDM, adxPeriod) / trur, similarly for minusDI.
DX: dx = 100 * abs(plusDI - minusDI) / max(plusDI + minusDI, 0.0001).
ADX: adx = ta.rma(dx, adxPeriod).
ADX values above 25 typically indicate strong trends; here, it's normalized (divided by 50) to influence the trend bias.
Volume Delta (5m Timeframe):
Fetches 5m volume: volume_5m = request.security(syminfo.tickerid, "5", volume, lookahead=barmerge.lookahead_on).
Computes a 12-period SMA of volume: avgVolume = ta.sma(volume_5m, 12).
Delta: (volume_5m - avgVolume) / avgVolume (or 0 if avgVolume is zero).
This measures relative volume spikes, where positive deltas suggest increased interest (bullish) and negative suggest waning activity (bearish).
MOS Components and Final Calculation:
Trend Bias: Average of the three slopes, normalized by close price and scaled by 100, then weighted by ADX influence: (slope5m + slope15m + slope30m) / 3 / close * 100 * (adx / 50).
Emphasizes trends in strong ADX conditions.
Momentum Impulse: Change in 5m RSI(14) over 1 bar, divided by 50: ta.change(request.security(syminfo.tickerid, "5", ta.rsi(close, 14), lookahead=barmerge.lookahead_on), 1) / 50.
Captures short-term momentum shifts.
Volatility Clarity: 1 - ta.change(atr, 1) / max(atr, 0.0001).
Measures ATR stability; values near 1 indicate low volatility changes (clearer trends), while lower values suggest erratic markets.
MOS Formula: Weighted average:
textmos = (0.35 * trendBias + 0.25 * momentumImpulse + 0.2 * volumeDelta + 0.2 * volatilityClarity)
Weights prioritize trend (35%) and momentum (25%), with volume and volatility at 20% each. These can be adjusted in code for experimentation.
Trading Decision:
A variable mosDecision starts as "Neutral".
If mos > 0.15, set to "Long".
If mos < -0.15, set to "Short".
Thresholds (0.15 and -0.15) are hardcoded but can be modified.
Visualization and Outputs
Threshold Lines (using hline):
Long Threshold: Horizontal dashed green line at +0.15.
Short Threshold: Horizontal dashed red line at -0.15.
Neutral Line: Horizontal dashed gray line at 0.
These provide visual reference points for MOS interpretation.
Dynamic Labels (using label.new):
Placed at each bar's index and MOS value.
Text: Formatted MOS value (e.g., "0.2345") followed by a newline and the decision (e.g., "Long").
Style: Downward-pointing label with gray background and white text for readability.
This replaces a traditional plot line, showing exact values and decisions per bar without cluttering the chart.
The indicator appears in a separate pane below the main price chart, making it easy to monitor alongside price action.
Usage Instructions
Adding to TradingView:
Copy the script into TradingView's Pine Script editor.
Save and add to your chart via the "Indicators" menu.
Select a symbol and timeframe (e.g., 1-minute for intraday).
Interpretation:
Long Signal: MOS > 0.15 – Consider bullish positions if supported by other indicators.
Short Signal: MOS < -0.15 – Potential bearish setups.
Neutral: Between -0.15 and 0.15 – Avoid trades or wait for confirmation.
Watch for MOS crossings of thresholds for momentum shifts.
Combine with price patterns, support/resistance, or volume for better accuracy.
Limitations and Considerations:
Lookahead Bias: Uses barmerge.lookahead_on for multi-timeframe data, which may introduce minor forward-looking bias in backtesting (use with caution).
No Alerts Built-In: Add custom alerts via TradingView's alert system based on MOS conditions.
Performance: Tested for compatibility; may require adjustments for illiquid assets or extreme volatility.
Backtesting: Use TradingView's strategy tester to evaluate historical performance, but remember past results don't guarantee future outcomes.
Customization: Edit weights in the MOS formula or thresholds to fit your strategy.
This indicator distills complex market data into a single score, aiding decision-making while encouraging users to verify signals with additional analysis. If you need modifications, such as restoring plot functionality or adding features, provide details for further refinement.

Advanced Volume Profile Pro Delta + POC + VAH/VAL# Advanced Volume Profile Pro - Delta + POC + VAH/VAL Analysis System
## WHAT THIS SCRIPT DOES
This script creates a comprehensive volume profile analysis system that combines traditional volume-at-price distribution with delta volume calculations, Point of Control (POC) identification, and Value Area (VAH/VAL) analysis. Unlike standard volume indicators that show only total volume over time, this script analyzes volume distribution across price levels and estimates buying vs selling pressure using multiple calculation methods to provide deeper market structure insights.
## WHY THIS COMBINATION IS ORIGINAL AND USEFUL
**The Problem Solved:** Traditional volume indicators show when volume occurs but not where price finds acceptance or rejection. Standalone volume profiles lack directional bias information, while basic delta calculations don't provide structural context. Traders need to understand both volume distribution AND directional sentiment at key price levels.
**The Solution:** This script implements an integrated approach that:
- Maps volume distribution across price levels using configurable row density
- Estimates delta (buying vs selling pressure) using three different methodologies
- Identifies Point of Control (highest volume price level) for key support/resistance
- Calculates Value Area boundaries where 70% of volume traded
- Provides real-time alerts for key level interactions and volume imbalances
**Unique Features:**
1. **Developing POC Visualization**: Real-time tracking of Point of Control migration throughout the session via blue dotted trail, revealing institutional accumulation/distribution patterns before they complete
2. **Multi-Method Delta Calculation**: Price Action-based, Bid/Ask estimation, and Cumulative methods for different market conditions
3. **Adaptive Timeframe System**: Auto-adjusts calculation parameters based on chart timeframe for optimal performance
4. **Flexible Profile Types**: N Bars Back (precise control), Days Back (calendar-based), and Session-based analysis modes
5. **Advanced Imbalance Detection**: Identifies and highlights significant buying/selling imbalances with configurable thresholds
6. **Comprehensive Alert System**: Monitors POC touches, Value Area entry/exit, and major volume imbalances
## HOW THE SCRIPT WORKS TECHNICALLY
### Core Volume Profile Methodology:
**1. Price Level Distribution:**
- Divides price range into user-defined rows (10-50 configurable)
- Calculates row height: `(Highest Price - Lowest Price) / Number of Rows`
- Distributes each bar's volume across price levels it touched proportionally
**2. Delta Volume Calculation Methods:**
**Price Action Method:**
```
Price Range = High - Low
Buy Pressure = (Close - Low) / Price Range
Sell Pressure = (High - Close) / Price Range
Buy Volume = Total Volume × Buy Pressure
Sell Volume = Total Volume × Sell Pressure
Delta = Buy Volume - Sell Volume
```
**Bid/Ask Estimation Method:**
```
Average Price = (High + Low + Close) / 3
Buy Volume = Close > Average ? Volume × 0.6 : Volume × 0.4
Sell Volume = Total Volume - Buy Volume
```
**Cumulative Method:**
```
Buy Volume = Close > Open ? Volume : Volume × 0.3
Sell Volume = Close ≤ Open ? Volume : Volume × 0.3
```
**3. Point of Control (POC) Identification:**
- Scans all price levels to find maximum volume concentration
- POC represents the price level with highest trading activity
- Acts as significant support/resistance level
- **Developing POC Feature**: Tracks POC evolution in real-time via blue dotted trail, showing how institutional interest migrates throughout the session. Upward POC migration indicates accumulation patterns, downward migration suggests distribution, providing early trend signals before price confirmation.
**4. Value Area Calculation:**
- Starts from POC and expands up/down to encompass 70% of total volume
- VAH (Value Area High): Upper boundary of value area
- VAL (Value Area Low): Lower boundary of value area
- Expansion algorithm prioritizes direction with higher volume
**5. Adaptive Range Selection:**
Based on profile type and timeframe optimization:
- **N Bars Back**: Fixed lookback period with performance optimization (20-500 bars)
- **Days Back**: Calendar-based analysis with automatic timeframe adjustment (1-365 days)
- **Session**: Current trading session or custom session times
### Performance Optimization Features:
- **Sampling Algorithm**: Reduces calculation load on large datasets while maintaining accuracy
- **Memory Management**: Clears previous drawings to prevent performance degradation
- **Safety Constraints**: Prevents excessive memory usage with configurable limits
## HOW TO USE THIS SCRIPT
### Initial Setup:
1. **Profile Configuration**: Select profile type based on trading style:
- N Bars Back: Precise control over data range
- Days Back: Intuitive calendar-based analysis
- Session: Real-time session development
2. **Row Density**: Set number of rows (30 default) - more rows = higher resolution, slower performance
3. **Delta Method**: Choose calculation method based on market type:
- Price Action: Best for trending markets
- Bid/Ask Estimate: Good for ranging markets
- Cumulative: Smoothed approach for volatile markets
4. **Visual Settings**: Configure colors, position (left/right), and display options
### Reading the Profile:
**Volume Bars:**
- **Length**: Represents relative volume at that price level
- **Color**: Green = net buying pressure, Red = net selling pressure
- **Intensity**: Darker colors indicate volume imbalances above threshold
**Key Levels:**
- **POC (Blue Line)**: Highest volume price - major support/resistance
- **VAH (Purple Dashed)**: Value Area High - upper boundary of fair value
- **VAL (Orange Dashed)**: Value Area Low - lower boundary of fair value
- **Value Area Fill**: Shaded region showing main trading range
**Developing POC Trail:**
- **Blue Dotted Lines**: Show real-time POC evolution throughout the session
- **Migration Patterns**: Upward trail indicates bullish accumulation, downward trail suggests bearish distribution
- **Early Signals**: POC movement often precedes price movement, providing advance warning of institutional activity
- **Institutional Footprints**: Reveals where smart money concentrated volume before final POC establishment
### Trading Applications:
**Support/Resistance Analysis:**
- POC acts as magnetic price level - expect reactions
- VAH/VAL provide intermediate support/resistance levels
- Profile edges show areas of low volume acceptance
**Developing POC Analysis:**
- **Upward Migration**: POC moving higher = institutional accumulation, bullish bias
- **Downward Migration**: POC moving lower = institutional distribution, bearish bias
- **Stable POC**: Tight clustering = balanced market, range-bound conditions
- **Early Trend Detection**: POC direction change often precedes price breakouts
**Entry Strategies:**
- Buy at VAL with POC as target (in uptrends)
- Sell at VAH with POC as target (in downtrends)
- Breakout plays above/below profile extremes
**Volume Imbalance Trading:**
- Strong buying imbalance (>60% threshold) suggests continued upward pressure
- Strong selling imbalance suggests continued downward pressure
- Imbalances near key levels provide high-probability setups
**Multi-Timeframe Context:**
- Use higher timeframe profiles for major levels
- Lower timeframe profiles for precise entries
- Session profiles for intraday trading structure
## SCRIPT SETTINGS EXPLANATION
### Volume Profile Settings:
- **Profile Type**: Determines data range for calculation
- N Bars Back: Exact number of bars (20-500 range)
- Days Back: Calendar days with timeframe adaptation (1-365 days)
- Session: Trading session-based (intraday focus)
- **Number of Rows**: Profile resolution (10-50 range)
- **Profile Width**: Visual width as chart percentage (10-50%)
- **Value Area %**: Volume percentage for VA calculation (50-90%, 70% standard)
- **Auto-Adjust**: Automatically optimizes for different timeframes
### Delta Volume Settings:
- **Show Delta Volume**: Enable/disable delta calculations
- **Delta Calculation Method**: Choose methodology based on market conditions
- **Highlight Imbalances**: Visual emphasis for significant volume imbalances
- **Imbalance Threshold**: Percentage for imbalance detection (50-90%)
### Session Settings:
- **Session Type**: Daily, Weekly, Monthly, or Custom periods
- **Custom Session Time**: Define specific trading hours
- **Previous Sessions**: Number of historical sessions to display
### Days Back Settings:
- **Lookback Days**: Number of calendar days to analyze (1-365)
- **Automatic Calculation**: Script automatically converts days to bars based on timeframe:
- Intraday: Accounts for 6.5 trading hours per day
- Daily: 1 bar per day
- Weekly/Monthly: Proportional adjustment
### N Bars Back Settings:
- **Lookback Bars**: Exact number of bars to analyze (20-500)
- **Precise Control**: Best for systematic analysis and backtesting
### Visual Customization:
- **Colors**: Bullish (green), Bearish (red), and level colors
- **Profile Position**: Left or Right side of chart
- **Profile Offset**: Distance from current price action
- **Labels**: Show/hide level labels and values
- **Smooth Profile Bars**: Enhanced visual appearance
### Alert Configuration:
- **POC Touch**: Alerts when price interacts with Point of Control
- **VA Entry/Exit**: Alerts for Value Area boundary interactions
- **Major Imbalance**: Alerts for significant volume imbalances
## VISUAL FEATURES
### Profile Display:
- **Horizontal Bars**: Volume distribution across price levels
- **Color Coding**: Delta-based coloring for directional bias
- **Smooth Rendering**: Optional smoothing for cleaner appearance
- **Transparency**: Configurable opacity for chart readability
### Level Lines:
- **POC**: Solid blue line with optional label
- **VAH/VAL**: Dashed colored lines with value displays
- **Extension**: Lines extend across relevant time periods
- **Value Area Fill**: Optional shaded region between VAH/VAL
### Information Table:
- **Current Values**: Real-time POC, VAH, VAL prices
- **VA Range**: Value Area width calculation
- **Positioning**: Multiple table positions available
- **Text Sizing**: Adjustable for different screen sizes
## IMPORTANT USAGE NOTES
**Realistic Expectations:**
- Volume profile analysis provides structural context, not trading signals
- Delta calculations are estimations based on price action, not actual order flow
- Past volume distribution does not guarantee future price behavior
- Combine with other analysis methods for comprehensive market view
**Best Practices:**
- Use appropriate profile types for your trading style:
- Day Trading: Session or Days Back (1-5 days)
- Swing Trading: Days Back (10-30 days) or N Bars Back
- Position Trading: Days Back (60-180 days)
- Consider market context (trending vs ranging conditions)
- Verify key levels with additional technical analysis
- Monitor profile development for changing market structure
**Performance Considerations:**
- Higher row counts increase calculation complexity
- Large lookback periods may affect chart performance
- Auto-adjust feature optimizes for most use cases
- Consider using session profiles for intraday efficiency
**Limitations:**
- Delta calculations are estimations, not actual transaction data
- Profile accuracy depends on available price/volume history
- Effectiveness varies across different instruments and market conditions
- Requires understanding of volume profile concepts for optimal use
**Data Requirements:**
- Requires volume data for accurate calculations
- Works best on liquid instruments with consistent volume
- May be less effective on very low volume or exotic instruments
This script serves as a comprehensive volume analysis tool for traders who need detailed market structure information with integrated directional bias analysis and real-time POC development tracking for informed trading decisions.

[RealEdgeFX] - Manipulation CandleOverview
The Manipulation Candle indicator highlights potential liquidity grabs and false breakouts directly on the chart. It focuses on moments when price sweeps prior highs or lows but closes in the opposite direction, suggesting a possible manipulation before a market reversal.
Core Logic
The indicator compares the current candle against the previous one and colors the bar when specific conditions are met:
Sell Manipulation (dark red)
When the current candle breaks above the previous high but then closes below the prior low.
→ This often signals a stop hunt to the upside followed by bearish intent.
Buy Manipulation (light green)
When the current candle breaks below the previous low but then closes above the prior high.
→ This suggests a liquidity sweep to the downside before bullish continuation.
Neutral candles remain uncolored to avoid clutter and keep the focus on high-impact moments.
Design Approach
Clarity: Only the candles that meet strict criteria are marked, reducing noise.
Liquidity Focused : Built for traders who want to quickly spot manipulative price action.
Non-Repainting : Once a candle is identified as manipulation, the color stays fixed.
Usage
Add it as an overlay on your chart.
Watch for green or red manipulation candles as alerts of possible reversals or liquidity events.
Combine with your own market structure or bias tools to increase accuracy.