Aethix Cipher DivergencesAethix Cipher Divergences v6
Core Hook: Custom indicator inspired by VuManChu B, Grok-enhanced for crypto intel—blends WaveTrend (WT) oscillator with multi-divergences for buy/sell circles (green/teal buys #00FFFF, red sells) and dots (divs, gold overbought alerts).
Key Features:
WaveTrend Waves: Dual waves (teal WT1, darker teal WT2) with VWAP (purple for neon vibe), overbought/oversold lines, crosses for signals.
Divergences: Regular/hidden for WT, RSI, Stoch—red bearish, green bullish dots; extra range for deeper insights.
RSI + MFI Area: Colored area (green positive, red negative) for sentiment/volume flow.
Stochastic RSI: K/D lines with fill for overbought/oversold trends.
Schaff Trend Cycle: Purple line for cycle smoothing.
Sommi Patterns: Flags (pink bearish, blue bullish) and diamonds for HTF patterns, purple higher VWAP.
MACD Colors on WT: Dynamic WT shading based on MACD for enhanced reads.
In den Scripts nach "WaveTrend" suchen

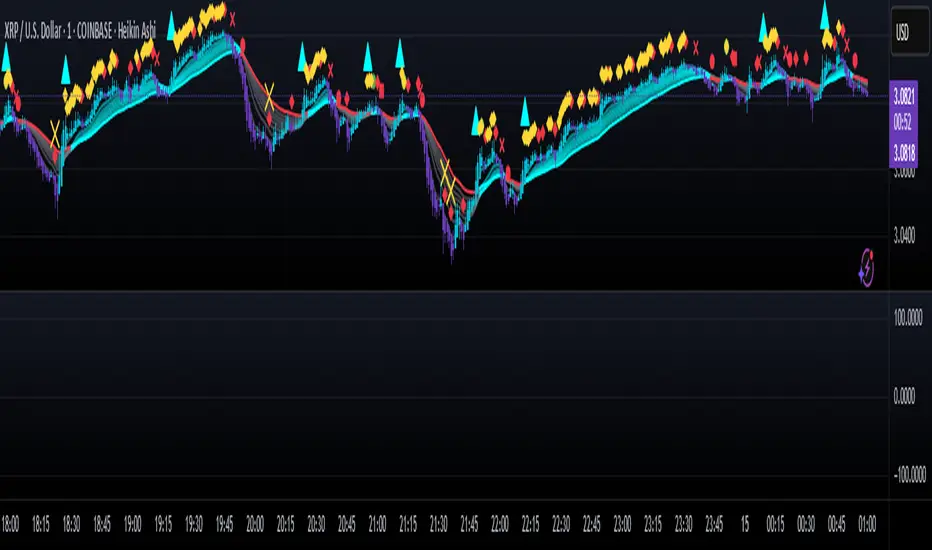
Aethix Cipher ProAethix Cipher Pro: AI-Enhanced Crypto Signal Indicator grok Ai made signal created for aethix users.
Unlock the future of crypto trading with Aethix Cipher Pro—a powerhouse indicator inspired by Market Cipher A, turbocharged for Aethix.io users! Built on WaveTrend Oscillator, 8-EMA Ribbon, RSI+MFI, and custom enhancements like Grok AI confidence levels (70-100%), on-chain whale volume thresholds, and fun meme alerts ("To the moon! 🌕").
Key Features:
WaveTrend Signals: Spot overbought/oversold with levels at ±53/60/100—crosses trigger red diamonds, blood diamonds, yellow X's for high-prob buy/sell entries.
Neon Teal EMA Ribbon: Dynamic 5-34 EMA gradient (bullish teal/bearish red) for trend direction—crossovers plot green/red circles, blue triangles.
RSI+MFI Fusion: Overbought (70+)/oversold (30-) with long snippets for sentiment edges.
WT + Stoch RSI Reversal ComboOverview – WT + Stoch RSI Reversal Combo
This custom TradingView indicator combines WaveTrend (WT) and Stochastic RSI (Stoch RSI) to detect high-probability market reversal zones and generate Buy/Sell signals.
It enhances accuracy by requiring confirmation from both oscillators, helping traders avoid false signals during noisy or weak trends.
🔧 Key Features:
WaveTrend Oscillator with optional Laguerre smoothing.
Stochastic RSI with adjustable smoothing and thresholds.
Buy/Sell combo signals when both indicators agree.
Histogram for WT momentum visualization.
Configurable overbought/oversold levels.
Custom dotted white lines at +100 / -100 levels for reference.
Alerts for buy/sell combo signals.
Toggle visibility for each element (lines, signals, histogram, etc.).
✅ How to Use the Indicator
1. Add to Chart
Paste the full Pine Script code into TradingView's Pine Editor and click "Add to Chart".
2. Understand the Signals
Green Triangle (BUY) – Appears when:
WT1 crosses above WT2 in oversold zone.
Stoch RSI %K crosses above %D in oversold region.
Red Triangle (SELL) – Appears when:
WT1 crosses below WT2 in overbought zone.
Stoch RSI %K crosses below %D in overbought region.
⚠️ A signal only appears when both WT and Stoch RSI agree, increasing reliability.
3. Tune Settings
Open the settings ⚙️ and adjust:
Channel Lengths, smoothing, and thresholds for both indicators.
Enable/disable visibility of:
WT lines
Histogram
Stoch RSI
Horizontal level lines
Combo signals
4. Use with Price Action
Use this indicator in conjunction with support/resistance zones, chart patterns, or trendlines.
Works best on lower timeframes (5m–1h) for scalping or 1h–4h for swing trading.
5. Set Alerts
Set alerts using:
"WT + Stoch RSI Combo BUY Signal"
"WT + Stoch RSI Combo SELL Signal"
This helps you catch setups in real time without watching the chart constantly.
📊 Ideal Use Cases
Reversal trading from extremes
Mean reversion strategies
Timing entries/exits during consolidations
Momentum confirmation for breakouts

Elite RSI Strategy Elite RSI Strategy
________________________________________
🔍 Overview
The Elite RSI Strategy combines multiple technical indicators into a unified visual toolkit, providing deep insights into market strength, reversals, and momentum shifts. Designed for serious traders who value confluence, clarity, and customizability.
________________________________________
📊 Core Components
🔸 Relative Strength Index (RSI)
• Classic RSI calculation with customizable length and price source.
• Dynamic background shading on RSI/MA crosses.
• Gradient fills highlight overbought and oversold zones.
• Alerts on RSI-MA crossovers for bullish or bearish momentum signals.
🔸 Smoothing Moving Averages (MA)
• Choose from SMA, EMA, SMMA, WMA, or VWMA.
• Configurable length and style.
• MA plotted over RSI for cross signal visualization.
________________________________________
🔸 WaveTrend Oscillator (WT)
• Built-in WaveTrend calculation using dual smoothing.
• Color-coded histogram based on oscillator direction:
o 🟢 Green: Bullish momentum
o 🔴 Red: Bearish momentum
• Optional candle coloring based on WT sentiment.
• Alert system for WT trend shifts.
________________________________________
🔸 Money Flow Index (MFI)
• Centered around 0 for clear trend polarity:
o Positive → Bullish Bias
o Negative → Bearish Bias
• Includes custom MFI smoothing, not available in standard indicators.
• Custom levels plotted: +30, +15, 0, -15, -30 for confluence.
• Dynamic color changes on zero-line crosses.
• Alert-ready behavior on trend shifts.
________________________________________
🖌️ Customization & Styling
• Toggle visibility for:
o RSI
o WT
o MFI
o Bar Colors
o Level Lines
• Style options for all plot types: line, area, or columns.
• Full color customization for bullish and bearish signals.
________________________________________
🚨 Built-In Alerts
• 📈 RSI crosses above MA
• 📉 RSI crosses below MA
• 🔄 RSI/MA Cross (any)
• 🟢 WT turns Bullish
• 🔴 WT turns Bearish
• 🔁 WT Direction Change
________________________________________
🧠 Why Use Elite RSI Strategy?
• Combines momentum, volume flow, and trend structure.
• Helps filter false signals through multi-layer confluence.
• Increases confidence in entry/exit decisions.
• Fully customizable to suit any trading style.
________________________________________
Disclaimer:
This indicator script is intended for educational and informational purposes only. It does not constitute investment advice or a recommendation to buy or sell any asset.
Always seek guidance from a licensed financial advisor or broker. You are solely responsible for your own trading decisions.
Thank you.

Golden Pocket Syndicate [GPS]Golden Pocket Syndicate is a multi-layered market analysis toolkit built for precision entries and sniper-style reversals in both trending and ranging conditions. The script fuses volume dynamics, golden pocket structures, market maker behavior, and liquidation cluster tracking into one high-confluence system.
Core Features:
• 📐 Golden Pocket Zones: Dynamic GP levels from daily, weekly, monthly, and yearly timeframes. These levels update in real-time and serve as confluence zones for entries and exits.
• 📊 WaveTrend Divergence Diamonds: Momentum shifts are detected using a custom filtered WaveTrend cross system to mark high-probability reversal conditions.
• 🧠 Market Maker Premium Divergence: Tracks price dislocation between CME and Binance to detect large player manipulation using a configurable premium threshold.
• 💎 MM Reversal Diamonds: Identifies potential market maker traps and large player pivots using historical candle behavior, EMA alignment, and price structure breaks.
• 📉 Stealth Liquidation Cluster Arrows: Volume-based liquidation pressure visualized as lightweight directional arrows based on calculated wick expansion and volume bursts. Highlights key zones where price is likely to bounce or reject.
• 🧭 Trend Validation: Uses volume-based trend conditions and short-term EMA positioning to further qualify signals and eliminate noise.
How to Use:
This indicator is designed to help traders visualize confluence between key institutional price levels, momentum shifts, and volume-based pressure points. Long/short opportunities can be explored at marked reversal diamonds or liquidation zones that align with key GP levels. Intended for use on higher timeframes (15m to 4H), though flexible across any pair or market.

Frankie Candles Essentials [LuxAlgo]The Frankie Candles Essentials toolkit is a collection of essential features used by trader Frankie Candles. This toolkit focuses on the relationship between MTF oscillator divergences and volume profiles, allowing the detection of different kinds of reversals. Retracements from the "Golden Pocket" features are also included.
🔶 USAGE
When adding the script to your chart you will be prompted to select the calculation interval of the "Top-Down Volume Profile", simply click on your chart where you want the starting and ending points of the calculation interval.
🔹 Top-Down Volume Profile
The Top-Down Volume Profile is a classical fixed-range volume profile and highlights the amount of traded volume within equidistant price areas. The amount of areas is determined by the "Rows" setting (Note that the volume profile can use up to 250 rows).
The value area (VA) highlights the area where the specified percentage of the total volume is traded, that is the area with the most recorded trading activity relative to a selected percentage.
Finally, the point of control (POC) highlights the price level with the most trading activity.
🔹 Divergences
Users can highlight divergences made by oscillators on their charts. The toolkit includes three indicators such as RSI, MFI, and WaveTrend with MTF support, users can also select external oscillators but these will not support MTF divergence detection.
Once the Top-Down Volume Profile is set historical divergences will be affected by its value area (VA), with bearish divergences located above the upper VA or bullish divergences located under the lower VA being highlighted with a sauce can, a signature display stel of Frankie Candles.
Users can also filter out divergences based on the point of control (POC) using the "Filter According To POC" setting, with bearish divergences located below the POC or bullish divergences located above it being filtered out.
Do note that divergences are detected N bars after their occurrence, where N is the divergence lookback setting
🔹 Golden Pockets
The script includes an MTF Golden Pockets feature displaying Fibonacci retracements on the user chart, these can be used to identify optimal trade entries (OTE) or serve as support/resistance levels.
Golden Pockets are based on maximum/minimum prices in a window determined by the "Golden Pocket Lookback" setting, using longer-term lookbacks will return longer-term divergences, this will also be the case when using HTF golden pockets.
🔶 SETTINGS
🔹 Candle Coloring
Candle Coloring: Determine the candle coloring method used by the indicator. "Simple" will color the candles based on the candle body, while "Golden Pocket" will color candles using a gradient based on the golden pocket rolling maximum/minimum.
🔹 Top-Down Volume Profile
Top-Down Volume Profile: Enable Top-Down Volume Profile.
Rows: Amount of rows used by the Top-Down Volume Profile.
Width (%): Controls the histogram bar width as a percentage of the calculation window specified by the user set anchors.
Value Area (%): Area where the specified percentage of total volume is traded.
Extend To The Right: Extends the calculation window from the first anchor to the most recent bar.
🔹 MTF Divergences
Oscillator: Determines the oscillator and its length used for divergence detection. Options include "RSI", "MFI", "WaveTrend" and "External".
Divergence Lookback: Lookback period used to track oscillator tops/bottoms. Divergence will be detected n bars after an oscillator top/bottom, where n is the specified lookback period.
External Oscillator: External oscillator used for divergence detection if "External" is selected in the "Oscillator" dropdown menu, incompatible with Divergence Timeframe setting.
Divergence Timeframe: Timeframe used to calculate the selected oscillator and detect divergences. Incompatible with external oscillators.
Divergence From: Determines if price tops/bottoms evaluated to detect divergences are based on wicks (high/low price) or candle body (closing/opening price).
Filter According To POC: Filter displayed divergences based on the Top-Down Volume Profile POC.
Show Hidden: Display hidden divergences.
Show Sauce: Display canned source emoji on specific divergences.
🔹 Golden Pockets
Golden Pocket Lookback: Period used to calculate golden pockets, options include "Short-Term", "Medium-Term", and "Long-Term".
Extend: Extend Golden Pockets lines from the most recent bar by the specified amount of bars.
Golden Pocket Timeframe: Timeframe used to calculate the Golden Pockets.
Retracements: Display specific retracements, users can also control the ratio from the provided numerical setting.
Show Coordinate Line: Display a line connecting the top/bottom used to calculate the Golden Pockets.
Invert: Invert top/bottom for the Golden Pockets calculation.

Overlay - HARSI + Divergences // All credit to © //@author=JayRogers & VuManChu Cipher B for their original Scripts (Open Source)
/ ====== ABOUT THIS INDICATOR
// I've combined some part of the code of the following indicators to get some alerts based on the Idea and Use section below :
// - RSI based Heikin Ashi candle oscillator
// - Divergence based on the VuManChu Cipher B
// -- This is the OVERLAY Version
//
// ====== ARTICLES and FURTHER READING
//
// - www.investopedia.com
//
// "Heikin-Ashi is a candlestick pattern technique that aims to reduce
// some of the market noise, creating a chart that highlights trend
// direction better than typical candlestick charts"
//
// ====== IDEA AND USE
// - The use of the HA RSI indicator when in the OverSold and OverBought
// area combined to a Divergence & a OB/OS buy/sell
// on the Cipher B by VuManChu.
// Can be useful as a confluence at S/R levels.
// *** Tip = 1 minute timeframe seems to work the best on FOREX
//
// *** Alerts :
// - The Divergence alert needs 2 bar to calculate,
// so alerts and dots as well, it will be placed on the right spot on
// the chart as per the offset added.
// - Use "Once Per Bar" for the alert, not per bar close, or you would
// have 1 extra bar delay
//
// ** Contributions : Remodel some part of the original script in order to get :
// --> Total conditions for an alert and a dot to display, resumed :
// - Buy/Sell in OB/OS
// - Divergence Buy/Sell
// - RSI Overlay is in OB/OS on current bar (or was the bar before)
// when both Buy/Sell dots from VMC appears.
//
// ====== DISCLAIMER
// For Tradingview & Pinescript moderators =
// This follow a strategy where RSI Overlay from @JayRogers script shall be
// in OB/OS zone, while combining it with the VuManChu Cipher B Divergences
// Buy&Sell + Buy/sell alerts In OB/OS areas.
// Any trade decisions you make are entirely your own responsibility.
//
// Thanks to dynausmaux for the code
// Thanks to falconCoin for inspired me to start this.
// Thanks to LazyBear for WaveTrend Oscillator
// Thanks to RicardoSantos for

HARSI + Divergences// All credit to © //@author=JayRogers & VuManChu Cipher B for their original Scripts (Open Source)
/ ====== ABOUT THIS INDICATOR
// I've combined some part of the code of the following indicators to get some alerts based on the Idea and Use section below :
// - RSI based Heikin Ashi candle oscillator
// - Divergence based on the VuManChu Cipher B
//
// ====== ARTICLES and FURTHER READING
//
// - www.investopedia.com
//
// "Heikin-Ashi is a candlestick pattern technique that aims to reduce
// some of the market noise, creating a chart that highlights trend
// direction better than typical candlestick charts"
//
// ====== IDEA AND USE
// - The use of the HA RSI indicator when in the OverSold and OverBought
// area combined to a Divergence & a OB/OS buy/sell
// on the Cipher B by VuManChu.
// Can be useful as a confluence at S/R levels.
// *** Tip = 1 minute timeframe seems to work the best on FOREX
//
// *** Alerts :
// - The Divergence alert needs 2 bar to calculate,
// so alerts and dots as well, it will be placed on the right spot on
// the chart as per the offset added.
// - Use "Once Per Bar" for the alert, not per bar close, or you would
// have 1 extra bar delay
//
// ** Contributions : Remodel some part of the original script in order to get :
// --> Total conditions for an alert and a dot to display, resumed :
// - Buy/Sell in OB/OS
// - Divergence Buy/Sell
// - RSI Overlay is in OB/OS on current bar (or was the bar before)
// when both Buy/Sell dots from VMC appears.
//
// ====== DISCLAIMER
// For Tradingview & Pinescript moderators =
// This follow a strategy where RSI Overlay from @JayRogers script shall be
// in OB/OS zone, while combining it with the VuManChu Cipher B Divergences
// Buy&Sell + Buy/sell alerts In OB/OS areas.
// Any trade decisions you make are entirely your own responsibility.
//
// Thanks to dynausmaux for the code
// Thanks to falconCoin for inspired me to start this.
// Thanks to LazyBear for WaveTrend Oscillator
// Thanks to RicardoSantos for

Bitcoin Risk Long Term indicatorOBJECTIVE:
The purpose of this indicator is to synthesize via an average several indicators from a wide choice with in order to simplify the reading of the bitcoin price and that on a long term vision.
Useful for those who want to see things simply, typically to make a smart DCA based on risk.
I originally used this script as a sandbox to understand and test the usefulness of several indicators, and to develop my PineScript skills, but finally the Risk Indicator output seems relevant so I decided to share it.
USAGE:
The selected indicators are the ones that I think give the best market bottoms, but the idea here is that anyone can try and use any set of indicators based on those preferences (post in comments if you find a relevant config)
Most of the indicator inputs are configurable. And some are not taken into account in the calculation of the Risk indicator because I consider them not relevant, this script is also a test more than a final version.
NOTES :
If you have any idea of adding an indicator, modification, criticism, bug found: share them, it is appreciated!
In the future I will create another more versatile Risk indicator that will not be focused on bitcoin in weekly. (this indicator is still usable on other assets and timeframe)
THANKS:
to Benjamin Cowen for inspiring me with his Bitcoin Risk metric
to Lazybear for his Wavetrend Indicator and all the scripts he shares
to Mabonyi for his Bitcoin Logarithmic Growth Curves & Zones script
to VuManChu for his VMC Cypher B Divergence
to the Trading view team for developing TV and PineScript
And to all the community for all the published codes that allowed me to progress and create this script
---- FR ----
OBJECTIF :
L'objectif de cet indicateur est de synthétiser via une moyenne plusieurs indicateurs parmi un large choix avec afin de simplifier la lecture du cours de bitcoin et cela sur une vision longue terme.
Utile pour ceux qui veulent voir les choses simplement, typiquement faire un DCA intelligent en fonction du risque.
À la base j'ai utilisé ce script comme un bac à sable pour comprendre puis tester l'utilité de plusieurs indicateurs, et développer mes compétences PineScript, mais finalement l'output Risk Indicateur me semble pertinent donc autant le partager.
UTILISATION :
Les indicateurs sélectionnés sont ceux qui permettent selon moi d'avoir les meilleurs point bas de marché, mais l'idée ici est que chacun puisse essayer et utiliser n'importe quel ensemble d'indicateur en fonction de ces préférences (poster en commentaire si vous trouvez une configuration pertinente)
La plupart des inputs indicateurs sont paramétrables. Et certains ne sont pas pris en compte dans le calcul du Risk indicateur car je les estime non pertinent, ce script est aussi un essai plus qu'une version finale.
NOTES :
Si vous avez la moindre idée d'ajout d'indicateur, modification, critique, bug trouvé : partagez-les, c'est apprécié !
à l'avenir je créerais un autre Risk indicator plus polyvalent qui ne sera pas focalisé sur bitcoin en weekly. (cet indicateur est tout de même utilisable sur d'autre actif et timeframe)
REMERCIEMENT :
à Benjamin Cowen pour m'avoir inspiré avec son Bitcoin Risk metric
à Lazybear pour son Wavetrend Indicator et globalement tout les scripts qu'il partage
à Mabonyi pour son script Bitcoin Logarithmic Growth Curves & Zones
à VuManChu pour son VMC Cypher B Divergence
à l'équipe Trading view pour avoir développé TV et PineScript
Et à toute la communauté pour tous les codes publiés qui m'ont permis de progresser et de créer ce script

MTF VWAPA simple wavetrend oscillator based off WaveTrend Oscillator by @LazyBear to visualise 4 different timeframe vwap under 1 chart.
Timeframe can be changed in indicator settings in minutes. Unnecessary waves can be removed by unchecking said TF wave in Style settings.

Price Action Trading System v0.3 by JustUncleL with modifcationsThe base of this script is the Price Action Trading System from JustUncle .
I have first combined it with script ADX and DI by BeikabuOyaji to indicate when the +DI is above the -DI and the ADX is above 20. This is represented by crosses at the top of the page: green indicating that the +DI is above the -DI and ADX above 20, and red if -DI is above the +DI and ADX above 20. If the ADX is increasing in slope while the +DI is above the -DI, an up green arrow is shown at the bottom of the page, indicating an increase in this trend, and the slope of the ADX is increasing and the -DI is above the +DI, a down arrow is shown at the bottom. One could think to a green cross with a green up arrow as a potential buy opportunity, and a red cross with a red down arrow as a potential sell opportunity.
Next, I have combined this script with the Indicator: WaveTrend Oscillator from Lazybear . If the oscillator has readings below -45 and the slope of the line is increasing, a green diamond appears above the chart. This indicates a potential buy opportunity. If the oscillator has readings above 50 and the slope of the line is decreasing, a red diamond appears above the chart. This indicates a potential sell opportunity. Now if the slope of the oscillator is rising significantly but does not hit the -45 threshold to start its increase, but is negative in value, a green flag appears at the top of the page. This represents a potential buy opportunity. If the slope of the oscillator is significantly decreasing and is positive in value, a red flag appears at the bottom of the page. This represents a potential sell opportunity.
The base of this script, the Price Action Trading System v0.3 by JustUncle , has many of its own features that I have kept. If the MACD is positive, the background colour is green. If it is negative, the colour is red. If the CCI and RSI indicate an oversold opportunity and the MACD is positive, you get an up olive arrow below the chart. If they indicate an overbought opportunity and the MACD is negative, you get a red down arrow above the chart. If the CCI value stays oversold after a green arrow, the candle chart turns turquoise, and if overbought, turns black after a red arrow.
You can use these indicators in combination to help you with your trading strategy.

MPI - Medic's Pulse Indicator v6MPI - Medic's Pulse Indicator has been formed over years and thousands of trades. Its completely customized for me, MedicWill. I have analyzed my best trading as well as the worst trades and compiled a system to keep my head clear and not get distracted by market swings. This started as v1 with my good friend OhHeyMatty working on his Bart indicator. I then customized the base and wrote the accompanying scripts which all work in conjunction. I believe the patterns and safety built in can help any traders psychologically to not get caught in market manipulation. But as anything else, I fear misuse will just reinforce bad ideas. Be careful.
As a 20 year paramedic I feel I have found the pulse of the market so I built the MPI around keeping me clear headed and in touch with the markets. Everything is termed in medical terminology because that's the world I come from. When I look at a trade-able chart and a patients EKG, I see many similarities and patterns. I believe the system will work on anything that is trad-able, but I have only personally tested on BTC/USD pairs and optimized for 2 hr setting. Do not confused being optimized for 2 hour as the only use-able time frame. All time frames under and over 2hr are important, but the 2hr is the official signaler if other time frames agree. Seeing the patterns and using them together is the key.
I did not know how to code, I did not know script. I know how to find the best of people (and indicators) and put them together to create something very powerful. I tweaked it for my needs and make it optimized for myself. Ive been doing that my whole life.
This lead me to trying to find coders who could write what Im doing, Ive yet to find a coder that can do it, especially on Pine which I guess is shit ;).
There is no hesitation releasing the indicator as I know without the Medic Pulse Strategy, you will be creating your own way. The tools are here, and they are free. Figure it out, I did. If not, come talk to me. Show me how you figured out the MPI pulse and please come share your success with me. Its what I'm here for and would make me very happy to see the success spread.
I have no interest in selling indicators. I'm here to help the community. I've dedicated my life to helping others and this is just another extension of my commitment. As a paramedic, my scope of help is restricted to the people that get in my ambulance. Here I have the ability to spread help on much bigger scale.
My hesitation is in releasing a powerful tool without explaining how to use it. This is the secret sauce. So although my scripts will be free, its based on the years of trading and using the MPI showed me if used correctly can be very amazing, but just as anything else in life, if not used properly the results will not be as expected.
I have never back tested it besides just manually because Ive yet to find a coder that can put into code what I am doing and looking at.
So I just did it myself. Its my very first indicator and I am so excited to see what the future brings. What I have noticed is there is a difference between traders and coders. Trading is more of an art form than a science. I've been painting this art my whole life and never realized it. Hanging out with OhHeyMatty helped me understand the mechanic behind what I was seeing.
My assumption will be the first mistake traders will make is not referencing multiple times frames and getting stuck in a view they they WANT to see. I urge caution about letting your bias influence your views.
The MPI works best when you are not in a trade, and dont care which way the market goes. As professionals we do not care which way the market moves, we just know exactly what we will do no matter what it does.
This is KEY. The MPI does not target exits because the MPI reads the market, it does not dictate the market. You can use the same common targets, MA's etc, that everyone uses. If unsure, use those as everyone targets them. Over time your trust in the MPI will grow.
The beauty of the MPI is it will not take you out of a winning trade and NEVER caps gains. You position sizing and management will be key to your success. This is a big key. We ride the waves for as long as they let us, but we know when to jump off and catch the next wave.
We are wavenostic.
I like the idea of releasing the script for people and letting them create their own vision with it. I have no doubt there is someone out there that will see things differently and even might find a better way to use the MPI than I have found. This is very exciting.
If you find any benefits from the MPI and create your trading using it, please contact me and let me know!
Im so curious, and I know with all the powerful minds in this space, there is plenty of room for growth.
I dont need to talk about my gains or percentages. Working amazing for me does NOT mean it will or you.
But remember, that does NOT mean you CANT do way better than me. Its up to you. Do it.
Indicators designed to work together:
Medic's Pulse Indicator - Indicator v6 (MPI-v6)
Medic's Pulse Indicator - Pulse v6 (MPI-v6)
Medic's Pulse Indicator - RS (MPI-RS)
Medic's Pulse Indicator - WaveTrend (MPI-WaveTrend)
A very special and heart felt thanks goes out to my good friend and part of the fam, OhHeyMatty.
Matty shares my love for others and desire to spread as much good as possible. We know one of the ways we are strongest is helping people interpret markets. So please enjoy and best wishes!
And a heartfelt thanks goes to rapper and inspiration, Nipsey Hustle.
if you think that is just rap, I encourage you to listen to the words. Nipsey will always be someone special that inspires me on the deepest level. Same with 2Pac, Biggie and all the true OG's. Listen to the words before you tell me its just rap. You might be surprised, to the level of being overwhelmed with inspiration. Or you might just think its some thugs singing about money. The choice is yours.
Everything is what you make it. You decide. The world is what you make it. Make is amazing. Cheers!
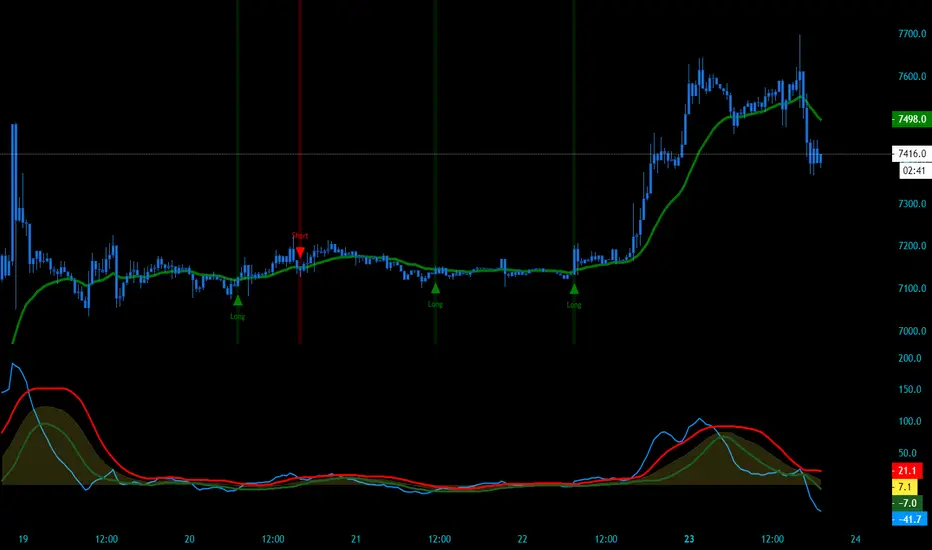
Kite Crossing Oscillator Quick script based on LazyBear's WaveTrend Oscillator , adding multiple time frames to evaluate potential long/short opportunities
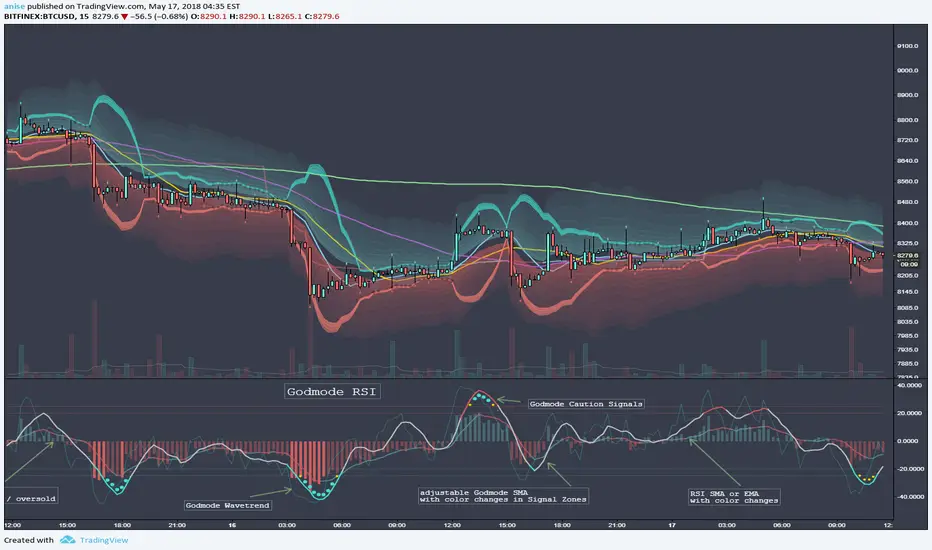
Godmode RSIbased on the popular Godmode Indicator with modifications by LEGION, LAZYBEAR, Ni6HTH4wK, xSilas, oh92, sco77m4r7in
All Credit belongs to them. THX Guys!
This is a Combination of a RSI and Godmode.
RSI has a Simple or Exponential Moving Average, Histogram Color Changes when the RSI reaches the Overbought/Oversold Zones.
Godmode is basicly the same as the Original one only scaled down a bit with slightly adjusted Caution Signal Zones which i like more. I also added the Option to adjust the Length of the 2nd Wavetrend SMA. Removed the Wavetrend Area because it doesnt have any use for me.
Hope you like it.
rem sim v0.1every alt-coin has similarity.
cause of bitcoin.
always i want to delete that similarity and read the true(?) value of each coin.
and i made some script for that, but not good enough.
this one is different.
Rem Sim (rs) removes the similarity very effectively.
it make avg WaveTrend from nxt, strat, steem, ...
and that is the similarity
and it show true(?) WaveTrend without similarity.
so if the alt-coin move like other alt-coin, the WT almost 0.
sorry my bad english.
if you dont understand my english. just look at that chart.
also you can see source code.
--------
대부분의 알트가 어느정도 비슷한 차트를 가지는데, 그 유사성을 제거하면 어떤 모양인지 궁금해서 만들었어요.
전에 만들었던 비트코인의 영향력을 제거해주는 아이디어는 실제론 별 효용이 없는데 이건 좀 쓸만해보이네요.
웨이브트렌드의 모양으로 보여줍니다.

Leola Lens SignalPro📌 Leola Lens SignalPro — Structure-Aware Momentum Overlay (Invite-Only)
This script is designed for traders who prioritize clear structure, liquidity trap zones, and momentum transitions. It provides adaptive visual overlays that align with key decision points — emphasizing structure over lagging indicators.
________________________________________
⚙️ Core Operating Modes
✅ Momentum Shift Mode (Always Active)
Tracks microstructure shifts using volatility compression, imbalance reactions, and adaptive logic for directional bias.
⚡ Scalper Mode (Optional)
Activates fast-response overlays for 1m–15m charts — tuned for crypto, indices, and intraday setups.
🛡 Safeguard Mode (Optional)
Applies volume and exhaustion filters for higher timeframe or conservative entries, ideal for swing traders.
________________________________________
📦 Liquidity Control Box (LCB) Logic
🔵 Blue Box = Bullish Control
• Break above → continuation likely
• Break below → caution for reversal
🟧 Orange Box = Bearish Control
• Break below → continuation likely
• Break above → caution for squeeze
Use the last visible box for bias.
Box edges = confluence zones.
Box overlaps = consolidation → avoid impulsive trades.
________________________________________
🧠 Signal Logic & Concept
Built using a custom structural engine, not derived from public scripts like RSI, MACD, or WaveTrend.
The overlays aim to capture price behavior often aligned with institutional concepts, such as:
• Order Blocks
• Liquidity Sweeps
• Trap Reversals
• Mitigation Moves
Pairs well with SMC-style analysis and order-flow-based trading.
________________________________________
🟡 Visual Signal Layers
• BUY / SELL Labels → Appear near structure flips and trap zones
• Yellow Label → High-risk trend shift zone
• LCB Boxes → Real-time market control zones
• Green/Red Liquidity Zones → Absorption or rejection
• MA Overlays → Adaptive slope-based guidance (optional)
• Pink Lines → High-reactivity reversal zones
• Yellow Line → Soft S/R (psychological pivot)
________________________________________
🎯 Suggested Entry & Exit Cues (Educational Use Only)
✅ Entry
• BUY near Blue LCB + liquidity reaction
• SELL after extended rallies into Orange LCB + trap behavior
• ⚠ Avoid trades directly at Yellow Labels unless other context supports
✅ Exit
• On opposite label after structure break
• On formation of opposite LCB
• Near major liquidity zones or pink levels
🧪 Always backtest label behavior to fit your strategy before use.
________________________________________
🔍 Originality Justification
This script introduces a non-indicator-based approach to structure detection — combining real-time volatility response, adaptive liquidity logic, and multi-mode filtering. It avoids conventional oscillators in favor of clarity-driven visual overlays, offering a novel experience especially useful to discretionary traders.
________________________________________
⚠️ Disclaimer
This script is for educational and informational purposes only. It does not constitute financial advice or a trading signal. Always validate performance with backtesting and forward testing before live use.
________________________________________

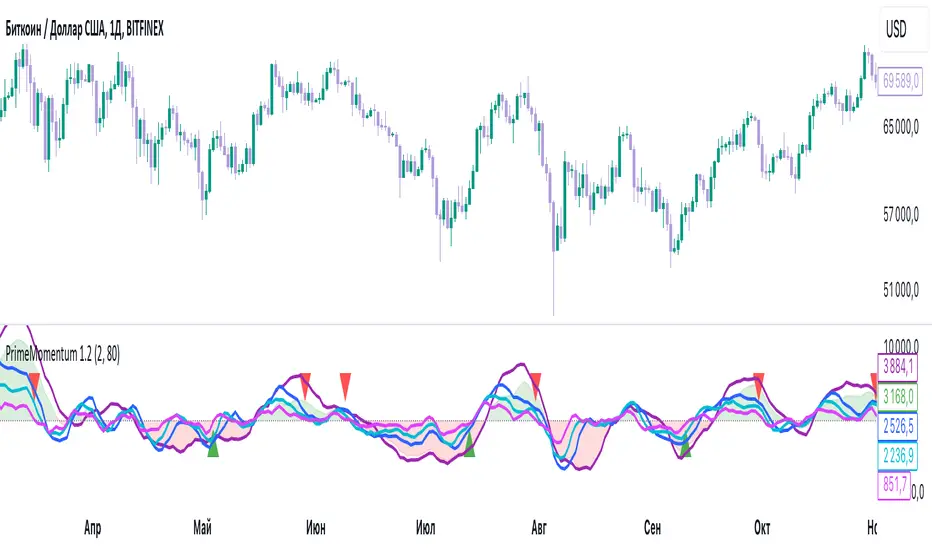
PrimeMomentum 1.1The PrimeMomentum indicator is not just an adaptation of classic tools like MA, BB, RSI, or WaveTrend. It is an innovative tool that combines several key elements and offers a unique methodology for market analysis. Its primary goal is to help traders avoid false entries and provide signals for making trading decisions.
What Makes PrimeMomentum Unique?
Integration of Multi-Timeframe Data with a Unique Signal Filtering Approach
PrimeMomentum processes data from four timeframes simultaneously, not merely to display trends but to assess the synchronization of momentum across each timeframe. This allows traders to receive signals only when all intervals confirm the direction. This approach minimizes the risk of false signals often encountered with standard tools.
PrimeMomentum analyzes the market across four timeframes:
TF1 (long-term): Displays the overall market direction.
TF2 (medium-term): Refines the current dynamics.
TF3 (short-term): Provides detailed analysis.
TF4 (very short-term): Confirms entry or exit points.
The combination of data from these timeframes allows traders to avoid frequent switching between intervals, simplifying analysis.
Innovative Reversal Logic
PrimeMomentum features a specialized algorithm for identifying trend reversals. Its uniqueness lies in the interaction between dynamic smoothing (EMA) and multi-level momentum assessment, enabling accurate identification of potential trend reversal points.
Dynamic Adaptation to Market Conditions
The indicator automatically adjusts smoothing parameters and threshold values based on market volatility. This enables it to adapt effectively to both calm and volatile markets.
Signals for entering Long or Short positions are generated only when the following conditions are met:
- Momentum shifts from negative to positive (for Long) or from positive to negative (for Short).
- Dynamic smoothing confirms the trend.
- Defined thresholds are reached.
Trend Strength Assessment
Unlike traditional indicators, PrimeMomentum evaluates not only the direction but also the strength of a trend by analyzing the relationship between momentum across each timeframe. This helps traders understand how stable the current market movement is.
The indicator analyzes price changes over a specific period, determining how much current prices deviate from previous ones. This data allows for assessing the strength of market movements.
Combination of Classic Elements with Proprietary Logic
While PrimeMomentum may utilize some widely known components like EMA, its algorithm is built on proprietary logic for evaluating market conditions. This sets it apart from standard solutions that merely display basic indicators without deeper analysis.
Added Value of PrimeMomentum
Trend Visualization with Concept Explanations
PrimeMomentum provides traders with clear visual signals, simplifying market analysis. Each element (color, line direction) is based on momentum and trend-smoothing concepts, enabling traders to make decisions quickly.
Results are displayed as color-coded lines:
- Dark violet: Long-term trend.
- Blue: Medium-term trend.
- Turquoise and light blue: Short-term trends.
If all momentum lines reach a peak and begin turning downward, it may indicate an approaching bearish trend.
If all lines reach a bottom and start turning upward, it may signal the beginning of a bullish trend.
Reversals can also serve as signals for exiting positions.
MoneyFlow
The PrimeMomentum indicator includes a visualization of MoneyFlow, allowing traders to assess capital flows within the selected timeframe. This functionality helps to analyze market trends more accurately and make well-informed decisions.
MoneyFlow Features:
Dynamic MoneyFlow Visualization:
MoneyFlow is displayed as an area that changes color based on its value:
- Green (with transparency) when MoneyFlow is above zero (positive flow).
- Red (with transparency) when MoneyFlow is below zero (negative flow).
Automatic Scaling:
MoneyFlow values automatically adjust to the chart’s scale to ensure visibility alongside the Momentum lines.
Double Smoothing:
To ensure a smoother and more representation, MoneyFlow uses double smoothing based on EMA.
Customizable Colors and Transparency:
Traders can customize the colors for positive and negative MoneyFlow and adjust the transparency level to fit their preferences.
How MoneyFlow Works:
- MoneyFlow calculations are based on the MFI (Money Flow Index), which considers both price and volume.
- MoneyFlow values are integrated into the overall PrimeMomentum chart and combined with other signals for deeper analysis.
Advantages of the New Functionality:
- Helps quickly identify capital flows into or out of the market.
- Complements Momentum analysis to provide a more comprehensive view of market conditions.
- Enhances decision-making efficiency through flexible visualization settings.
Note: MoneyFlow adapts to the selected timeframe and displays data corresponding to the current interval on the price chart.
Simplicity for Beginners and Depth for Professionals
The indicator is designed to be user-friendly for traders of all experience levels. Beginners benefit from intuitive signals, while experienced traders can leverage in-depth analysis for more complex strategies.
PrimeMomentum Usage Modes
PrimeMomentum adapts to various strategies and supports three modes:
Short-term: Recommended to use a 2H timeframe. Optimal for intraday trading with small TakeProfit levels.
Medium-term: Recommended to use a 1D timeframe for trades lasting several days.
Long-term: Use the 1W timeframe for analyzing global trends.
Support for Different Strategies
Thanks to its flexible settings and support for multiple timeframes, PrimeMomentum is suitable for both day trading and long-term analysis.
Why Is PrimeMomentum Worth Your Attention?
Unlike standard indicators, which often rely solely on basic mathematical models or publicly available components, PrimeMomentum offers a comprehensive approach to market analysis. It combines unique momentum assessment algorithms, multi-timeframe analysis, and volatility adaptation. This not only provides traders with signals but also helps them understand the underlying market processes, making it a truly innovative solution.
Disclaimer
The PrimeMomentum indicator is designed to assist traders in market analysis but does not guarantee future profitability. Its use should be combined with traders' own research and informed decision-making.
Wolfpack Id with DivergenceThis indicator simply identifies if the markets are in an up or down trend. You should always use it in combination with other indicators, just as Wavetrends.
This indicator is mostly known because of Market Cipher. The script that was published under the name Wolfpack Id is for some reason closed source, but as it turns out there is of course no secret sauce involved, the original indicator goes way back and the thing that was then called Wolfpack Indicator is simply a MACD Signal Line with 3,8 settings. I added a simple divergence hunter for some extra Informations that might help, brought it up to contemporary pinescript standards, added Alerts and made the whole script open source, as it should be and as the original script also once was. Have fun!

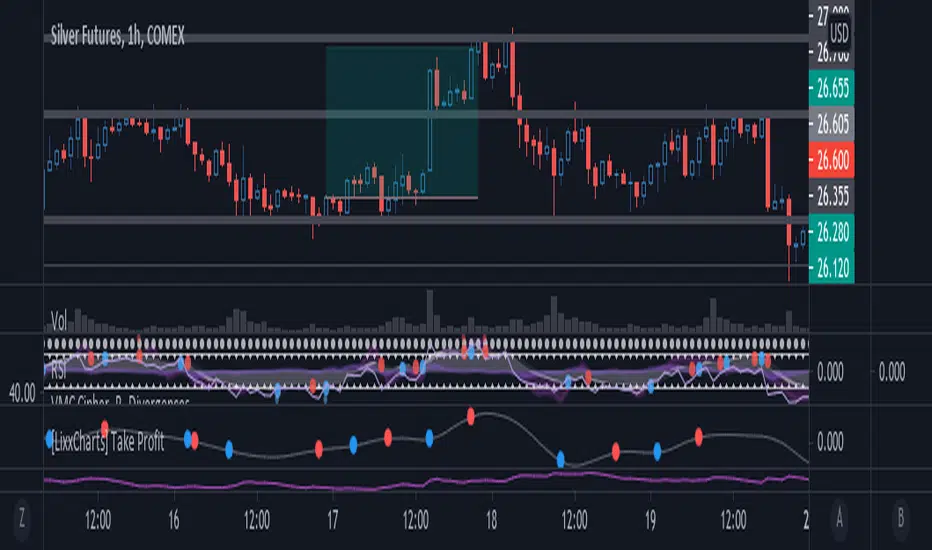
[Lixx] MESA(EMA/SMA) and ROC(ROC/MESA) Take Profit TriggersThis script uses the MESA EMA and SMA as well as the ROC/MESA cross to help find the take profit areas when trading divergences using market cipher or wavetrend. It is inspired by jordanfungs MESA indicator, however this one is different because it is not lagging in the signals.
Hope you enjoy it, and make sure to backtest any strategy before you use it.
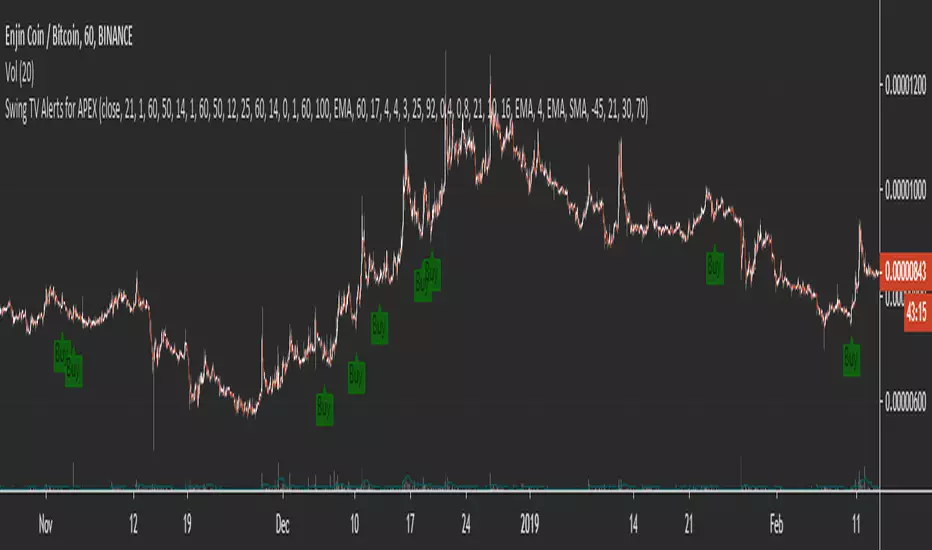
Swing TV Alerts for APEXI have put a collection of my favorite scripts together so that everyone can make a simple entry trading system with it.
You first have to think about using a trend filter there are several of them you can pick I would advise using at least one. After that, you select a combo of the most popular indicators on Tradingview for an exact entry. SO far my personal favorite is Godmode / Wavetrend.
Then you add alerts and either trade manually or use one of the services that allow you to put buy orders vie alerts such as Autoview / Profitview /Profit trailer or my personal favorite APEX.
I have hidden the code cause it's messy but you don't need to worry there is zero repainting.
Volume Momentum [LucF]Volume momentum gives much more information than a simple volume MA. It does require interpretation however, since increasing volume momentum can indicate strengthening of both an up or down movement. Volume momentum peaks and bottoms are also interesting as they often lead to shifts in price movement.
In order to help interpretation, I color rising volume momentum using price momentum. Green indicates volume-supported upward price movement and red indicates volume-supported downward price movement.
As to falling volume momentum, in my world view it indicates exhaustion or disinterest which requires prior price activity to be interpreted. In strong and steady price movements it can indicate a mere pause. After high price volatility often signalling a top or bottom, falling volume momentum often leads reversals.
Features
Two optional MAs on the main volume momentum line, with crosses on the short MA.
A higher time frame line (shown by default), with the higher time frame being a user-defined multiple of the current chart’s interval. The default is 8, so that a 15m chart will also show a 2h volume momentum.
Two Markers
Tops/Bottoms (marker 1): these occur on high/low price momentum pivots situated in favorable regions, combined with volume momentum peaks.
Pauses/Reversals (marker 2): these simply identify volume momentum high pivots that often lead to shifts in price movement. They are not directional. You can choose to color bars where these markers occur (shown on chart).
You can show only long or short markers.
Alerts
You can define alerts on any combination of markers you configure. After defining the markers you want the alert to trigger on, make sure you are on the interval you want the alert to be monitoring at, then create the alert, select Volume Momentum, use the default “Configured Markers” alert condition and choose your triggering window (usually “Once Per Bar Close”). Once the alert is created, you can change the indicator's inputs with no effect on the alert.
Use Cases
The higher time frame line is very useful in situating current volume activity in a larger context.
I consider all peaks in volume momentum as potentially significant events.
When looking for an entry, I will often wait for the descending volume momentum to change direction at a shorter interval, using price momentum to confirm that increasing volume is working in my favor.
Volume momentum variations can often inform otherwise insignificant price momentum activity.
Here I use price momentum to color volume momentum; inversely, I also use volume momentum to color my momentum indicator.
Notes
Where the markers on my Volume Columns indicator focus on confirming strength of price movements, this indicators’ markers try to focus on shifts in price movement.
My volume momentum is calculated using a smoother variant of CCI which came to be known as WaveTrend.

CM MACD Color MFT Wavetrendcoss [PlungerMen]This Script version I made for a friend named Huu Trung
CM MACD
MACD color
Wave trend cross

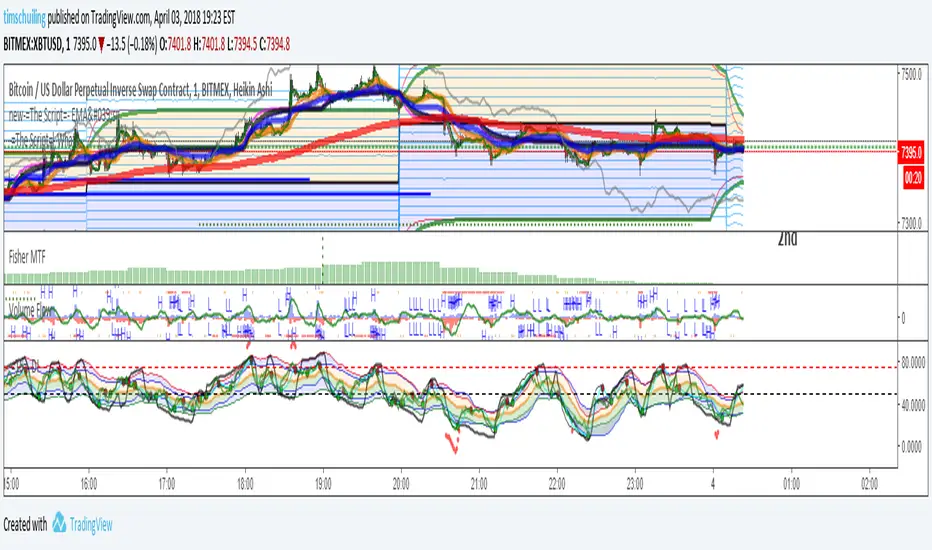
-=The Script=- DI-=The Script=- DI, Fisher Transformation
A indicator build around fisher transformation, aka wavetrend.