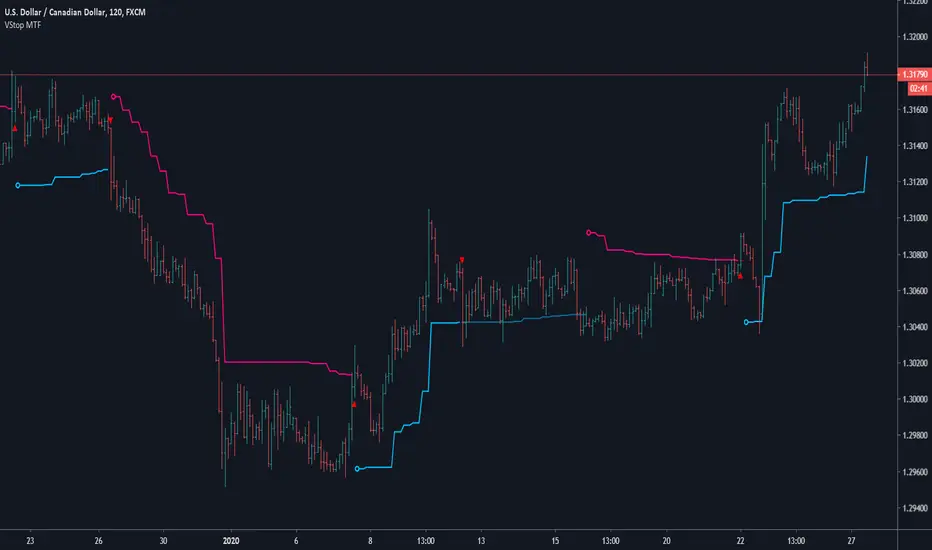
Volatility Stop MTFThis is a multi-timeframe version of our Volatility Stop , an ATR-based trend detector that can be used as a stop.
► Timeframe selection
The higher timeframe can be selected using 3 different ways:
• By steps (60 min., 1D, 3D, 1W, 1M, 1Y).
• As a multiple of the current chart's resolution, which can be fractional, so 3.5 will work.
• Fixed.
Note that you can also use this indicator without the higher timeframe functionality. It will then behave as our normal Volatility Stop would.
► Stop breaches
Two modes of stop-breaching logic can be selected.
• In the default, Early Breach mode, the stop is considered breached when a bar at the chart's current resolution breaches the higher timeframe stop.
• You may also choose to calculate breaches on the higher timeframe information only.
Choosing the Early Breach mode has the advantage of generating faster exits. It will create a state of limbo where the stop has been breached but the Volatility Stop trend has not yet reversed. The impact of detecting earlier exits to minimize losses comes, as is usually the case, at the cost of a compromise: if the stop is breached early in a long trend, the indicator will then spend most of that trend in limbo. Sizeable portions of a trend can thus be missed.
A few options are provided when you use Early Breach mode:
• A red triangle can identify early breaches (default).
• You can color bars or the background to identify limbo states.
When in limbo, the color used to plot the indicator's line or shapes will always be darker.
► Alerts
Five pre-defined alerts are supplied:
• #1: On any trend change.
• #2: On changes into an uptrend.
• #3: On changes into a downtrend.
• #4: Only on breaches of the uptrend by the chart's bars (Early Breach mode). Will not trigger on a trend change.
• #5: Only on breaches of the downtrend by the chart's bars (Early Breach mode). Will not trigger on a trend change.
As usual, alerts should be configured to trigger Once Per Bar Close . When creating alerts, you will see a warning to the effect that potentially repainting code is used, even if the indicator's default non-repainting mode is active. The warning is normal.
► Other features
• You can color bars using the indicator's up/down state. When bars are colored, up bars are more brightly colored.
• The HTF line is non-repainting by default, but you can allow it to repaint.
• You can confirm the higher timeframe used by displaying it at a selectable distance from the last bar on the chart.
• Choice of 2 color themes.
• Choice of display as a line, circles, diamonds or arrows. The line can be used with the other shapes. If no line is required, set its thickness to zero.
Enjoy!
Look first. Then leap.
In den Scripts nach "Volatility" suchen
Volatility StopThis is a new version of the classic Volatility Stop originally published in 2014 by admin and written in Pine v1. While the code has evolved, its logic is identical. It is an ATR-based trend detector that can also be used as a stop. It belongs to the same family of indicators as:
• Charles Le Beau's Chandelier Exit ,
• Olivier Seban's Super Trend , and
• Sylvain Vervoort's Average True Range Trailing Stop .
Unlike the Chandelier Exit , Volatility Stop will not move against the trend.
This new version is written in Pine v4. The indicator can be used as a chart overlay, like the original. The calculations have been functionalized for easier reuse, so it is now easier to lift the logic out of the script and use it in others.
Features
• Choice of 2 color themes.
• Choice of display as a line, circles, diamonds or arrows. The line can be used with the other shapes. If no line is required, set its thickness to zero.
• Same default of length=20 and ATR factor=2 used in the original Volatility Stop.
• 3 alerts: on any trend change, or on changes into up or downtrends only. Alerts should be configured to trigger Once Per Bar Close .
Original version:
Look first. Then leap.

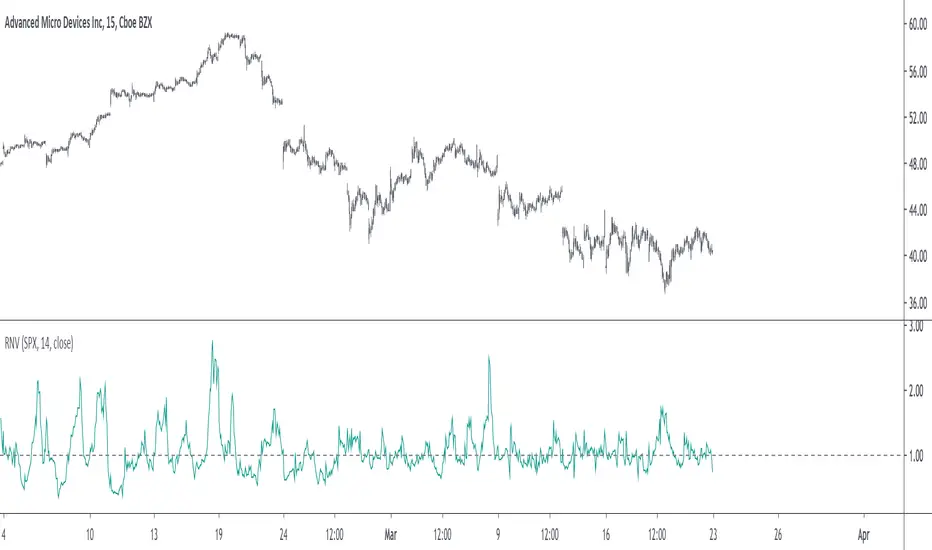
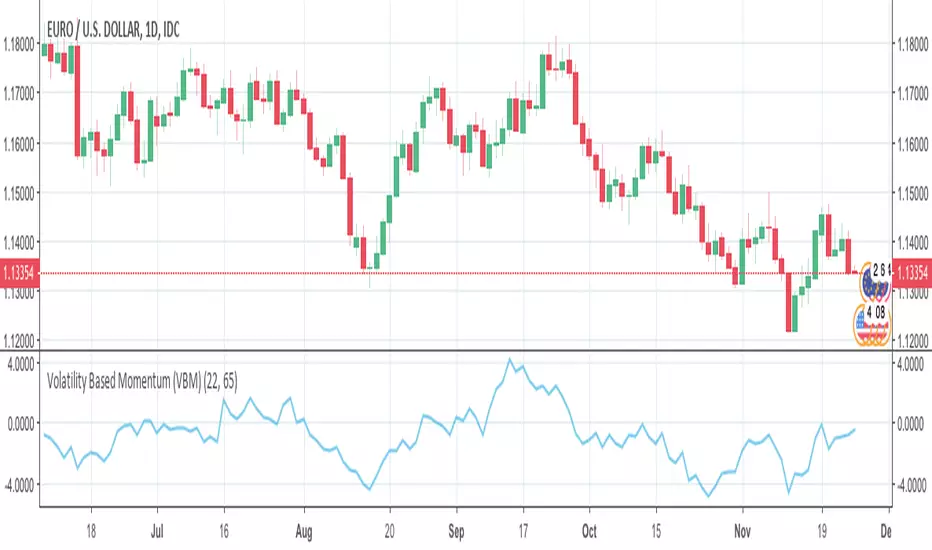
Volatility Based Momentum (VBM)The Volatility Based Momentum (VBM) indicator is a variation on the rate-of-change (ROC) indicator. Instead of expressing momentum in a percentage gain or loss, VBM normalizes momentum using the historical volatility of the underlying security.
The VBM indicator offers numerous benefits to traders who orient their trading around volatility. For these traders, VBM expresses momentum in a normalized, universally applicable ‘multiples of volatility’ (MoV) unit. Given the universal applicability of MoV, VBM is especially suited to traders whose trading incorporates numerous timeframes, different types of securities (e.g., stocks, Forex pairs), or the frequent comparison of momentum between multiple securities.
The calculation for a volatility based momentum (VBM) indicator is very similar to ROC, but divides by the security’s historical volatility instead. The average true range indicator (ATR) is used to compute historical volatility.
VBM(n,v) = (Close - Close n periods ago) / ATR(v periods)
For example, on a daily chart, VBM(22,65) calculates how many MoV price has increased or decreased over the last 22 trading days (approximately one calendar month). The second parameter is the number of periods to use with the ATR indicator to normalize the momentum in terms of volatility.
For more details, there is an article further describing VBM and its applicability versus ROC.
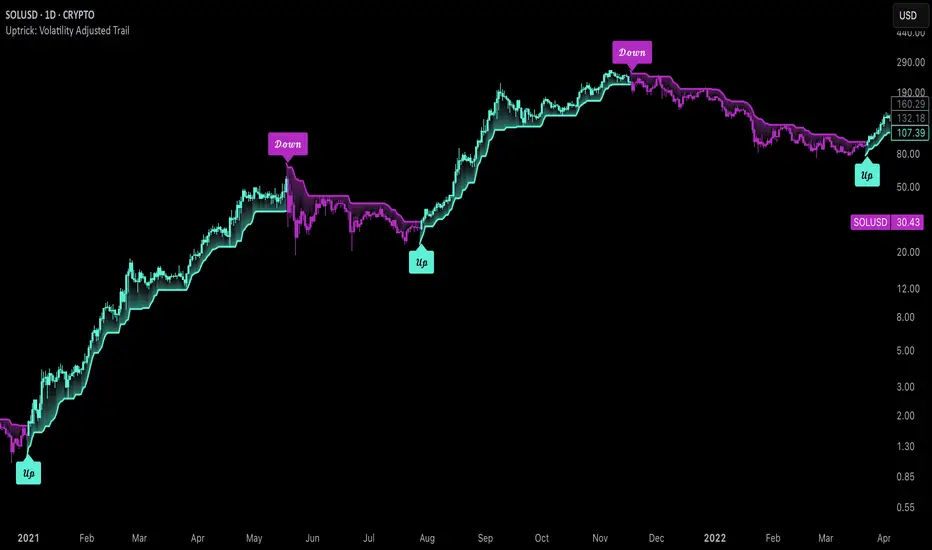
Uptrick: Volatility Adjusted TrailIntroduction
The "Uptrick: Volatility Adjusted Trail" is a dynamic trailing band indicator. It adapts in real time to changing market conditions by adjusting both to volatility and trend consistency. Inspired by Supertrend-style logic, it enhances traditional approaches by introducing adaptive mechanisms for more context-sensitive behavior in both trending and consolidating environments.
Overview
This indicator combines an exponential moving average (EMA) as its basis with an Average True Range (ATR)-derived multiplier that adjusts dynamically. Unlike fixed-multiplier tools, this indicator modifies its band distances in real time according to volatility expansion and trend persistence. The result is a trailing system that adapts to the prevailing market regime, providing traders with clearer signals for trend bias, stop placement, and potential momentum shifts.
Originality
The script’s originality lies in its multi-layered approach to trail calculation. It introduces a real-time ATR multiplier adjustment driven by two factors: a volatility expansion ratio and a trend persistence model. The expansion ratio compares the current ATR to its moving average, making the indicator more sensitive during volatile conditions and less sensitive during quieter periods. The trend persistence model assesses directional consistency to widen the bands during sustained trends. This dual adjustment method creates a system that evolves with market behavior, making it more responsive and adaptive than static-band or fixed-multiplier alternatives.
Components & Inspiration
This indicator was designed with specific components that work together:
Exponential Moving Average (EMA): Chosen as the central baseline because it responds faster to recent price changes than a simple moving average, providing a more current reference for trailing bands.
Average True Range (ATR): Used as the volatility measure because it accounts for both intraday and gap movement, making it a robust and widely accepted standard for market volatility.
Dynamic Multiplier: The multiplier is adjusted by both volatility expansion and trend persistence to produce bands that tighten during low volatility and widen during consistent trends. This combination was chosen to give the indicator the ability to self-regulate across different market regimes.
Trend Persistence Model: Integrated to assess directional consistency, ensuring the bands expand during strong trends, which can prevent premature stop-outs.
Flip Confirmation Logic: Added to filter out noise by requiring multiple bar closes beyond a band before confirming a state change, reducing false reversals.
For inspiration, the indicator draws on the core idea behind Supertrend—using a baseline and volatility-derived bands to define trailing stop levels. However, while Supertrend uses a fixed ATR multiplier, this indicator introduces a dynamic multiplier system and persistence weighting, making it more adaptive and suited for varying conditions.
Inputs and Parameters
Basis EMA Length
Defines the period for the EMA that serves as the core price reference.
ATR Length
Sets the lookback period for the Average True Range calculation used in band spacing.
Base ATR Mult
The base multiplier applied to ATR before adjustments. Forms the starting scale of the band offset.
Volatility Expansion Sensitivity
Controls how strongly the band spacing reacts to short-term volatility bursts. Higher values create more pronounced band expansions or contractions.
Trend Persistence Window
Determines how many bars are used to calculate directional trend consistency using a smoothed step function.
Persistence Impact
Scales how much influence the trend persistence has on band widening. Values range from 0 (no effect) to 1 (maximum effect).
Min Effective Mult
Sets the minimum value that the adjusted multiplier can reach. Prevents the bands from becoming too narrow.
Max Effective Mult
Sets the maximum value the adjusted multiplier can reach. Prevents the bands from over-expanding during high volatility.
Bars Above/Below to Confirm Flip
Number of consecutive bars required to close above or below the opposing trail before confirming a bullish or bearish flip. Helps reduce noise and false signals.
Show Flip Labels
Enables or disables the display of flip markers on the chart.
Label Size
Allows users to adjust the size of flip labels from Tiny to Huge.
Label ATR Offset
Adjusts the vertical placement of flip labels in relation to the trail using an ATR-based offset.
Features and Logic
EMA Basis: All calculations stem from an EMA that tracks the centerline of price action.
Dynamic ATR Multiplier: The ATR multiplier adjusts in real time based on volatility expansion and trend persistence.
Clamped Multiplier: The adjusted multiplier is limited between user-defined minimum and maximum values to keep the band scale practical.
Upper and Lower Bands: Bands are plotted above and below the EMA using the dynamic multiplier and ATR values.
Trailing Logic: The script uses Supertrend-style trailing logic, updating the active band in the current trend direction and resetting the opposite band.
Trend State Detection: A state variable tracks the current market regime (bullish, bearish, or neutral). Transitions are confirmed only after a user-specified number of bars close beyond the respective bands.
Visual Elements: Trail lines and fill zones are color-coded (bullish cyan, bearish magenta). Candlestick and bar colors match the trend state. Optional flip labels mark confirmed transitions.
Alerts: Built-in alert conditions allow users to receive real-time notifications for bullish or bearish flips.
Usage Guidelines
This indicator can be used for:
Defining context-aware dynamic stop levels that adjust with market behavior.
Identifying trend direction and reversal points based on adaptive logic.
Filtering entry or exit signals during trending vs. consolidating conditions.
Supplementing trade management strategies with responsive visual markers.
Entering long or short positions based on the appearance of flip labels and managing stop losses by following the adaptive trail.
Traders may tune the parameters to suit different trading styles or timeframes. For example, lower ATR and EMA values may suit intraday setups, while longer settings may benefit swing or positional trading.
Summary
The "Uptrick: Volatility Adjusted Trail" provides a flexible, adaptive trailing band system that accounts for both volatility and directional consistency. By combining an EMA baseline with a dynamic ATR multiplier influenced by volatility expansion and trend persistence, it creates a context-sensitive trailing system that aligns with changing market conditions. Customizable confirmation, flip labels, alerts, and dynamic visual cues make it a versatile tool for trend-following, breakout filtering, and trailing stop logic.
Disclaimer
This indicator is provided for educational and research purposes only. It does not constitute financial advice. Trading involves risk, and past performance does not guarantee future results. Always conduct your own analysis and risk management before making trading decisions.
Volatility Quality [Alpha Extract]The Alpha-Extract Volatility Quality (AVQ) Indicator provides traders with deep insights into market volatility by measuring the directional strength of price movements. This sophisticated momentum-based tool helps identify overbought and oversold conditions, offering actionable buy and sell signals based on volatility trends and standard deviation bands.
🔶 CALCULATION
The indicator processes volatility quality data through a series of analytical steps:
Bar Range Calculation: Measures true range (TR) to capture price volatility.
Directional Weighting: Applies directional bias (positive for bullish candles, negative for bearish) to the true range.
VQI Computation: Uses an exponential moving average (EMA) of weighted volatility to derive the Volatility Quality Index (VQI).
vqiRaw = ta.ema(weightedVol, vqiLen)
Smoothing: Applies an additional EMA to smooth the VQI for clearer signals.
Normalization: Optionally normalizes VQI to a -100/+100 scale based on historical highs and lows.
Standard Deviation Bands: Calculates three upper and lower bands using standard deviation multipliers for volatility thresholds.
vqiStdev = ta.stdev(vqiSmoothed, vqiLen)
upperBand1 = vqiSmoothed + (vqiStdev * stdevMultiplier1)
upperBand2 = vqiSmoothed + (vqiStdev * stdevMultiplier2)
upperBand3 = vqiSmoothed + (vqiStdev * stdevMultiplier3)
lowerBand1 = vqiSmoothed - (vqiStdev * stdevMultiplier1)
lowerBand2 = vqiSmoothed - (vqiStdev * stdevMultiplier2)
lowerBand3 = vqiSmoothed - (vqiStdev * stdevMultiplier3)
Signal Generation: Produces overbought/oversold signals when VQI reaches extreme levels (±200 in normalized mode).
Formula:
Bar Range = True Range (TR)
Weighted Volatility = Bar Range × (Close > Open ? 1 : Close < Open ? -1 : 0)
VQI Raw = EMA(Weighted Volatility, VQI Length)
VQI Smoothed = EMA(VQI Raw, Smoothing Length)
VQI Normalized = ((VQI Smoothed - Lowest VQI) / (Highest VQI - Lowest VQI) - 0.5) × 200
Upper Band N = VQI Smoothed + (StdDev(VQI Smoothed, VQI Length) × Multiplier N)
Lower Band N = VQI Smoothed - (StdDev(VQI Smoothed, VQI Length) × Multiplier N)
🔶 DETAILS
Visual Features:
VQI Plot: Displays VQI as a line or histogram (lime for positive, red for negative).
Standard Deviation Bands: Plots three upper and lower bands (teal for upper, grayscale for lower) to indicate volatility thresholds.
Reference Levels: Horizontal lines at 0 (neutral), +100, and -100 (in normalized mode) for context.
Zone Highlighting: Overbought (⋎ above bars) and oversold (⋏ below bars) signals for extreme VQI levels (±200 in normalized mode).
Candle Coloring: Optional candle overlay colored by VQI direction (lime for positive, red for negative).
Interpretation:
VQI ≥ 200 (Normalized): Overbought condition, strong sell signal.
VQI 100–200: High volatility, potential selling opportunity.
VQI 0–100: Neutral bullish momentum.
VQI 0 to -100: Neutral bearish momentum.
VQI -100 to -200: High volatility, strong bearish momentum.
VQI ≤ -200 (Normalized): Oversold condition, strong buy signal.
🔶 EXAMPLES
Overbought Signal Detection: When VQI exceeds 200 (normalized), the indicator flags potential market tops with a red ⋎ symbol.
Example: During strong uptrends, VQI reaching 200 has historically preceded corrections, allowing traders to secure profits.
Oversold Signal Detection: When VQI falls below -200 (normalized), a lime ⋏ symbol highlights potential buying opportunities.
Example: In bearish markets, VQI dropping below -200 has marked reversal points for profitable long entries.
Volatility Trend Tracking: The VQI plot and bands help traders visualize shifts in market momentum.
Example: A rising VQI crossing above zero with widening bands indicates strengthening bullish momentum, guiding traders to hold or enter long positions.
Dynamic Support/Resistance: Standard deviation bands act as dynamic volatility thresholds during price movements.
Example: Price reversals often occur near the third standard deviation bands, providing reliable entry/exit points during volatile periods.
🔶 SETTINGS
Customization Options:
VQI Length: Adjust the EMA period for VQI calculation (default: 14, range: 1–50).
Smoothing Length: Set the EMA period for smoothing (default: 5, range: 1–50).
Standard Deviation Multipliers: Customize multipliers for bands (defaults: 1.0, 2.0, 3.0).
Normalization: Toggle normalization to -100/+100 scale and adjust lookback period (default: 200, min: 50).
Display Style: Switch between line or histogram plot for VQI.
Candle Overlay: Enable/disable VQI-colored candles (lime for positive, red for negative).
The Alpha-Extract Volatility Quality Indicator empowers traders with a robust tool to navigate market volatility. By combining directional price range analysis with smoothed volatility metrics, it identifies overbought and oversold conditions, offering clear buy and sell signals. The customizable standard deviation bands and optional normalization provide precise context for market conditions, enabling traders to make informed decisions across various market cycles.

Volatility Cloud (SAR)Inspired by the Volatility Index from Wilder
Apply the SAR point to highs, lows ans medians and create a cloud of volatility

Candle Percent Volatility by AllenlkThis indicator gives you the percentage movement of each candle. Measurements are taken between the candle High point and Low point, and also between the Open and Close and calculated in percent %. From there it smooths out the data with a moving average. This gives you an idea of how much volatility is within each candle given the time resolution of the chart.
I like to use this information as a way to turn off a strategy, or select a proper time resolution for a strategy. If each candle has less than 2.5% Volatility most strategies will typically buy and sell rapidly at prices that are too close together, potentially losing money. During those times it seems best to either temporarily turn off the strategy, change the time resolution or switch to another strategy.

TS - Volatility ScreenerWhat is it?
Get a quick view on market volatility , helpful to avoid fakeout or to see when the bull or bears are really pushing the price.
Also detects candle outliers (represented by the squares) for individual candle volatility analysis
How do I get access?
PM me on TradingView!

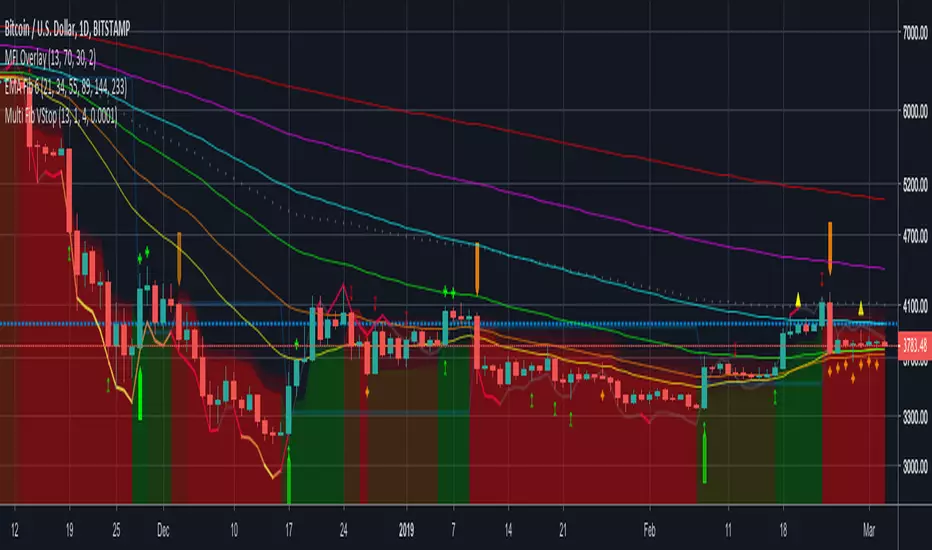
Multi Fib Volatility StopA 7-band overlapping Fibonacci volatility stop. Select the start and multiplier and 6 increasing fibonacci bands will be overlayed to suggest areas of high probability buy/ sell opportunities.
[RS]Function Volatility Stop V0Function for Volatility Stop:
added some tweeks so it can be used on any series as in example a rsi.

Volatility Regime NavigatorA guide to understanding VIX, VVIX, VIX9D, VVIX/VIX, and the Composite Risk Score
1. Purpose of the Indicator
This dashboard summarizes short-term market volatility conditions using four core volatility metrics.
It produces:
• Individual readings
• A combined Regime classification
• A Composite Risk Score (0–100)
• A simplified Risk Bucket (Bullish → Stress)
Use this to evaluate market fragility, drift potential, tail-risk, and overall risk-on/off conditions.
This is especially useful for intraday ES/NQ trading, expected-move context, and understanding when breakouts or fades have edge.
2. The Four Core Volatility Inputs
(1) VIX — Baseline Equity Volatility
• < 16: Complacent (easy drift-up, but watch for fragility)
• 16–22: Healthy, normal volatility → ideal trading conditions
• > 22: Stress rising
• > 26: Tail-risk / risk-off environment
(2) VIX9D — Short-Term Event Vol
Measures 9-day implied volatility. Reacts to immediate news/events.
• < 14: Strongly bullish (drift regime)
• 14–17: Bullish to neutral
• 17–20: Event risk building
• > 20: Short-term stress / caution
(3) VVIX — Volatility of VIX (fragility index)
Tracks volatility of volatility.
• < 100: “Bullish, Bullish” — very low fragility
• 100–120: Normal
• 120–140: Fragile
• > 140: Stress, hedging pressure
(4) VVIX/VIX Ratio — Microstructure Risk-On/Risk-Off
One of the most sensitive indicators of market confidence.
• 5.0–6.5: Strongest “normal/bullish” zone
• < 5.0: Bottom-stalking / fear regime
• > 6.5: Complacency → vulnerable to reversals
• > 7.5: Fragile / top-risk
3. Composite Risk Score (0–100)
The dashboard converts all four inputs into a single score.
Score Interpretation
• 80–100 → Bullish - Drift regime. Shallow pullbacks. Upside favored.
• 60–79 → Normal - Healthy tape. Balanced two-way trading.
• 40–59 → Fragile - Choppy, failed breakouts, thinner liquidity.
• 20–39 → Risk-Off - Downside tails active. Favor fades and defensive behavior.
• < 20 → Stress - Crisis or event-driven tape. Avoid longs.
Score updates every bar.
4. Regime Label
Independent of the composite score, the script provides a Regime classification based on combinations of VIX + VVIX/VIX:
• Bullish+ → Buying is easy, tape lifts passively
• Normal → Cleanest and most tradable conditions
• Complacent → Top-risk; be careful chasing upside
• Mixed → Signals conflict; chop potential
• Bottom Stalk → High VIX, low VVIX/VIX (capitulation signatures)
A trailing “+” or “*” indicates additional bullish or caution overlays from VIX9D/VVIX.
5. How to Use the Dashboard in Trading
When Bullish (Score ≥ 80):
• Expect drift-up behavior
• Downside limited unless catalyst hits
• Structure favors breakouts and trend continuation
• Mean reversion trades have lower expectancy
When Normal (Score 60–79):
• The “playbook regime”
• Breakouts and mean reversion both valid
• Best overall trading environment
When Fragile (Score 40–59):
• Expect chop
• Breakouts fail
• Take quicker profits
• Avoid overleveraged directional bets
When Risk-Off (20–39):
• Favor fades of strength
• Downside tails activate
• Trend-following short setups gain edge
• Respect volatility bands
When Stress (<20):
• Avoid long exposure
• Do not chase dips
• Expect violent, news-sensitive behavior
• Position sizing becomes critical
6. Quick Summary
• VIX = weather
• VIX9D = short-term storm radar
• VVIX = foundation stability
• VVIX/VIX = confidence vs fragility
• Composite Score = overall regime health
• Risk Bucket = simple “what do I do?” label
This dashboard gives traders a high-confidence, low-noise view of equity volatility conditions in real time.

CDVI – First Crypto Dominance Volatility Index by Armi GoldmanThe Crypto Dominance Volatility Index (CDVI) is the first volatility-based indicator designed specifically to analyze the stability and instability of dominance flows in the crypto market.
Instead of measuring price volatility, CDVI focuses on the volatility of market dominance itself — a structural driver behind capital rotation cycles such as Bitcoin Season, Altseason, accumulation zones, and macro cycle transitions.
CDVI transforms dominance changes into a clear volatility index that highlights compression, expansion, and regime shifts.
How it works
CDVI calculates the absolute or percentage-based realized volatility of your chosen dominance benchmark (BTC.D, TOTAL.D, or any dominance index available on TradingView).
The indicator then:
1. Smooths the volatility curve using adjustable parameters
2. Builds a long-term mean to identify regime structure
3. Computes percentile zones over a rolling lookback window
4. Highlights high-risk and low-risk dominance conditions using color-coded backgrounds
This creates a clean, noise-reduced volatility representation of the dominance market.
Why it looks like this
The CDVI curve is intentionally smooth and cyclical because dominance volatility behaves differently from price volatility:
• Dominance tends to trend slowly, then spike violently during rotation phases
• Periods of prolonged compression often occur before large macro moves
• Volatility bursts cluster during transitions (e.g. BTC → Alts, cycle tops, market-wide repricing)
The percentile zones (90% / 10%) give structural thresholds for extreme conditions.
Background color reveals when dominance volatility enters these extremes, creating visually clear “regime blocks.”
How to interpret CDVI
High CDVI (above the 90th percentile):
• Dominance instability
• Capital rotation phases are active
• Market is repricing sector allocations
• Often appears near Altseason tops or bottoms
• Signals caution for trend traders and opportunity for rotation traders
Low CDVI (below the 10th percentile):
• Compression and calm dominance
• Accumulation and structural balance
• Often precedes major expansions in Bitcoin or Alt markets
• Useful for anticipating cycle transitions before they break out
Long-term mean:
• Helps identify when the market is in a high-vol or low-vol regime
• Crossings around the mean often coincide with early cycle shifts
How to use CDVI in practice
1. Cycle Timing
Use CDVI to detect when the market moves from calm → expansion or expansion → exhaustion.
Low CDVI usually precedes major moves. High CDVI often marks transition turbulence.
2. BTC vs Altcoins Rotation
Combine CDVI with BTC.D / TOTAL2 / TOTAL3 to detect rotation windows.
High CDVI = dominance is unstable → rotations happen.
Low CDVI = dominance is stable → trending environment.
3. Risk Management
High CDVI suggests elevated structural risk (dominance shifting).
Low CDVI supports directional conviction.
4. Confluence with Price
When both price volatility and dominance volatility expand together → macro transition.
When price is volatile but CDVI is flat → noise, not structural change.
Who this indicator is for
• Cycle analysts
• Macro crypto traders
• BTC vs Alts rotation traders
• Portfolio allocators
• Long-term investors looking at structural market phases
CDVI is designed as a clean, structural tool for understanding volatility not of price — but of market power distribution.

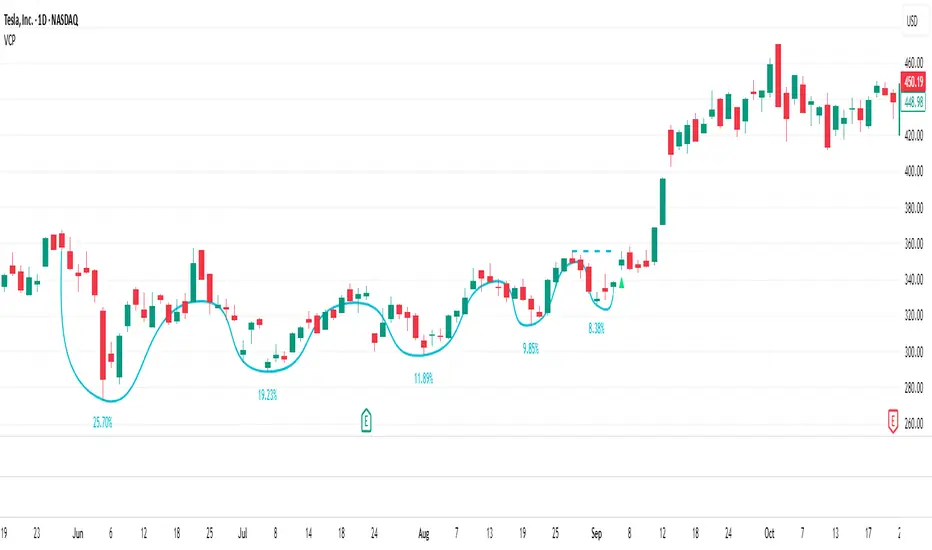
Volatility Contraction PatternThe Volatility Contraction Pattern (VCP), popularized by Mark Minervini, is a price-action formation that reflects supply drying up and institutional accumulation before a breakout. A proper VCP demonstrates a prior uptrend, constructive base development, sequential declines in downside volatility, and evidence of institutional accumulation.
This indicator identifies and tracks VCP behavior by mapping successive contraction legs (up to five), verifying that each pullback forms a higher low with diminishing depth, and highlighting when the final contraction tightens sufficiently relative to earlier legs. A dynamic pivot line highlights the key breakout level, and a confirmation trigger signals when price breaks above that pivot.
A classic VCP typically includes:
A strong prior uptrend into the base
2–5 tightening pullbacks (contractions) with higher lows
Decreasing volatility and often reduced volume
A clear pivot level (last swing high)
Breakout through the pivot as demand overwhelms supply
The psychology: early sellers are absorbed, weak holders exit, and stronger hands take control — setting up for a powerful upside move.
How This Indicator Identifies VCPs
This script automatically tracks price swings to detect VCP-style contraction sequences. It:
Anchors to an initial swing high and low
Identifies each subsequent contraction when price pulls back and then moves back up
Ensures each contraction is higher-low + shallower than the prior
Verifies a minimum contraction bar count to avoid noise
Tracks up to five contractions (C1 → C5)
Confirms a valid VCP when the final contraction tightens within a user-defined threshold
Marks the pivot (last contraction high)
Triggers a breakout signal when price exceeds that pivot
Indicator Settings & Features
Contraction Display
Plots each contraction leg and base structure
Supports curved or straight visual style
Optionally labels each contraction with its depth (% decline)
This helps quickly evaluate whether volatility is truly contracting.
Contraction Depth Controls
Maximum Depth — filters out patterns with overly deep first-leg pullbacks
Final Contraction Depth — requires the last pullback to be especially tight, as Minervini describes
This ensures the base tightens toward the right side — a key VCP principle.
Breakout Logic
Breakout confirms when price exceeds the pivot high
Triangle marker plots at breakout candle
Reset & Threshold Logic
A small threshold buffer prevents false pattern resets when price slightly exceeds highs
Auto-reset after excessive depth or extended time to avoid stale patterns
Alerts
VCP Forming when a qualifying contraction sequence completes
VCP Breakout when price clears the pivot
Volatility Squeeze IndicatorThis is All Star Charts' very own Volatility Squeeze Indicator. Popularized by Steve Strazza, it's really just a Bollinger Band Width Indicator with moving averages. Very easy...
Historical Volatility with HV Average & High/Low Trendlines
### 📊 **Indicator Title**: Historical Volatility with HV Average & High/Low Trendlines
**Version**: Pine Script v5
**Purpose**:
This script visualizes market volatility using **Historical Volatility (HV)** and enhances analysis by:
* Showing a **moving average** of HV to identify volatility trends.
* Marking **high and low trendlines** to highlight extremes in volatility over a selected period.
---
### 🔧 **Inputs**:
1. **HV Length (`length`)**:
Controls how many bars are used to calculate Historical Volatility.
*(Default: 10)*
2. **Average Length (`avgLength`)**:
Number of bars used for calculating the moving average of HV.
*(Default: 20)*
3. **Trendline Lookback Period (`trendLookback`)**:
Number of bars to look back for calculating the highest and lowest values of HV.
*(Default: 100)*
---
### 📈 **Core Calculations**:
1. **Historical Volatility (`hv`)**:
$$
HV = 100 \times \text{stdev}\left(\ln\left(\frac{\text{close}}{\text{close} }\right), \text{length}\right) \times \sqrt{\frac{365}{\text{period}}}
$$
* Measures how much the stock price fluctuates.
* Adjusts annualization factor depending on whether it's intraday or daily.
2. **HV Moving Average (`hvAvg`)**:
A simple moving average (SMA) of HV over the selected `avgLength`.
3. **HV High & Low Trendlines**:
* `hvHigh`: Highest HV value over the last `trendLookback` bars.
* `hvLow`: Lowest HV value over the last `trendLookback` bars.
---
### 🖍️ **Visual Plots**:
* 🔵 **HV**: Blue line showing raw Historical Volatility.
* 🔴 **HV Average**: Red line (thicker) indicating smoothed HV trend.
* 🟢 **HV High**: Green horizontal line marking volatility peaks.
* 🟠 **HV Low**: Orange horizontal line marking volatility lows.
---
### ✅ **Usage**:
* **High HV**: Indicates increased risk or potential breakout conditions.
* **Low HV**: Suggests consolidation or calm markets.
* **Cross of HV above Average**: May signal rising volatility (e.g., before breakout).
* **Touching High/Low Levels**: Helps identify volatility extremes and possible reversal zones.

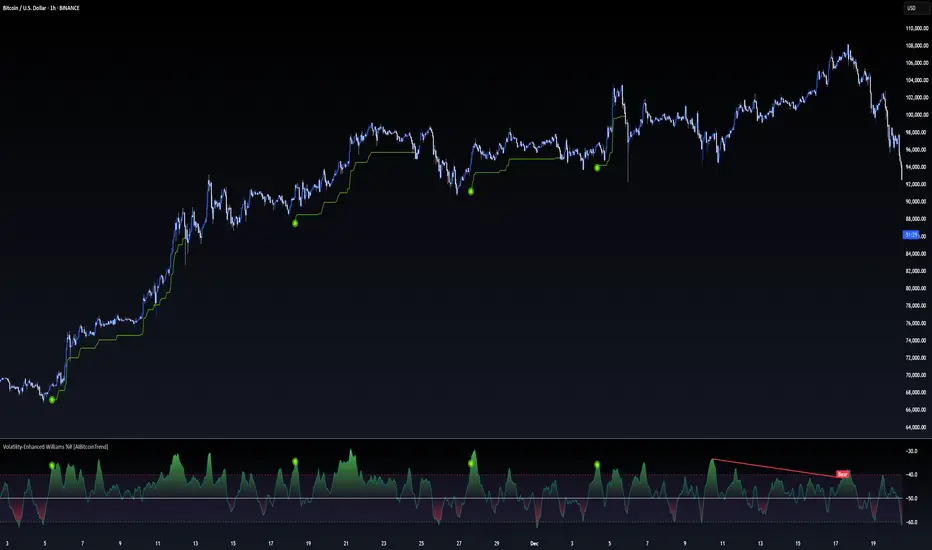
Volatility-Enhanced Williams %R [AIBitcoinTrend]👽 Volatility-Enhanced Williams %R (AIBitcoinTrend)
The Volatility-Enhanced Williams %R takes the classic Williams %R oscillator to the next level by incorporating volatility-adaptive smoothing, making it significantly more responsive to market dynamics. Unlike the traditional version, which uses a fixed calculation method, this indicator dynamically adjusts its smoothing factor based on market volatility, helping traders capture trends more effectively while filtering out noise.
Additionally, the indicator includes real-time divergence detection and an ATR-based trailing stop system, providing traders with enhanced risk management tools and early reversal signals.
👽 What Makes the Volatility-Enhanced Williams %R Unique?
Unlike the standard Williams %R, which applies a simple lookback-based formula, this version integrates adaptive smoothing and volatility-based filtering to refine its signals and reduce false breakouts.
✅ Volatility-Adaptive Smoothing – Adjusts dynamically based on standard deviation, enhancing signal accuracy.
✅ Real-Time Divergence Detection – Identifies bullish and bearish divergences for early trend reversal signals.
✅ Crossovers & Trailing Stops – Implements Williams %R crossovers with ATR-based trailing stops for intelligent trade management.
👽 The Math Behind the Indicator
👾 Volatility-Adaptive Smoothing
The indicator smooths the Williams %R calculation by applying an adaptive filtering mechanism, which adjusts its responsiveness based on market conditions. This helps to eliminate whipsaws and makes trend-following strategies more reliable.
The smoothing function is defined as:
clamp(x, lo, hi) => math.min(math.max(x, lo), hi)
adaptive(src, prev, len, divisor, minAlpha, maxAlpha) =>
vol = ta.stdev(src, len)
alpha = clamp(vol / divisor, minAlpha, maxAlpha)
prev + alpha * (src - prev)
Where:
Volatility Factor (vol) measures price dispersion using standard deviation.
Adaptive Alpha (alpha) dynamically adjusts smoothing strength.
Clamped Output ensures that the smoothing factor remains within a stable range.
👽 How Traders Can Use This Indicator
👾 Divergence Trading Strategy
Bullish Divergence Setup:
Price makes a lower low, while Williams %R forms a higher low.
Buy signal is confirmed when Williams %R reverses upward.
Bearish Divergence Setup:
Price makes a higher high, while Williams %R forms a lower high.
Sell signal is confirmed when Williams %R reverses downward.
👾 Trailing Stop & Signal-Based Trading
Bullish Setup:
✅ Williams %R crosses above trigger level → Buy signal.
✅ A bullish trailing stop is placed at Low - (ATR × Multiplier).
✅ Exit if price crosses below the stop.
Bearish Setup:
✅ Williams %R crosses below trigger level → Sell signal.
✅ A bearish trailing stop is placed at High + (ATR × Multiplier).
✅ Exit if price crosses above the stop.
👽 Why It’s Useful for Traders
Adaptive Filtering Mechanism – Avoids excessive noise while maintaining responsiveness.
Real-Time Divergence Alerts – Helps traders anticipate market reversals before they occur.
ATR-Based Risk Management – Stops dynamically adjust based on market volatility.
Multi-Market Compatibility – Works effectively across stocks, forex, crypto, and futures.
👽 Indicator Settings
Smoothing Factor – Controls how aggressively the indicator adapts to volatility.
Enable Divergence Analysis – Activates real-time divergence detection.
Lookback Period – Defines the number of bars for detecting pivot points.
Enable Crosses Signals – Turns on Williams %R crossover-based trade signals.
ATR Multiplier – Adjusts trailing stop sensitivity.
Disclaimer: This indicator is designed for educational purposes and does not constitute financial advice. Please consult a qualified financial advisor before making investment decisions.
Volatility-Driven Trend Reversal (VTR) IndicatorThe Volatility-Driven Trend Reversal (VTR) Indicator is a sophisticated Pine Script trading tool designed to provide clear, non-repainting buy and sell signals based on a combination of trend-following, volatility-based, and momentum analysis. It utilizes Exponential Moving Average (EMA) for trend direction, Average True Range (ATR) for dynamic volatility bands, and Relative Strength Index (RSI) for momentum filtering. The VTR Indicator is built to operate effectively on all market pairs, including cryptocurrency, stocks, and forex, providing traders with reliable, actionable signals for both trend continuation and reversal strategies.
This indicator is tailored to reduce noise and avoid over-signaling by filtering out minor fluctuations. With its unique volatility-based ATR bands, the VTR Indicator excels in volatile environments, such as cryptocurrency markets, and helps traders capture significant price movements while managing risk effectively.
Key Features
Trend Confirmation (EMA):
The indicator relies on the 50-period Exponential Moving Average (EMA) to define the market's primary trend direction. A rising EMA suggests an uptrend, while a falling EMA indicates a downtrend.
Volatility-Based ATR Bands:
ATR (Average True Range) is used to calculate dynamic support and resistance levels based on market volatility. The upper and lower bands represent potential overbought and oversold zones, ensuring that price action aligns with the overall market volatility.
These bands are adaptive to price fluctuations, making them a powerful tool for detecting volatility shifts in real-time.
Momentum Filter (RSI):
The 14-period Relative Strength Index (RSI) is applied to ensure that buy signals only appear when the market is showing upward momentum (RSI above 50) and sell signals when there is downward momentum (RSI below 50).
This filtering mechanism helps avoid false signals during periods of consolidation or ranging markets, improving the signal's overall accuracy.
Non-Repainting Logic:
The buy and sell signals generated by the VTR Indicator are persistent and will not repaint after the bar closes. Once a signal is confirmed, it stays active until an opposite condition triggers a new signal.
This is achieved using a persistent signalState variable, which tracks the current market trend and prevents premature or false signals.
Stop-Loss and Take-Profit Levels:
The indicator automatically generates Stop Loss (SL) and Take Profit (TP) levels based on the ATR multiplier to assist with trade risk management.
These levels are dynamically calculated as a multiple of the ATR value, helping traders manage potential volatility and exit at strategic points.
Multi-Market Compatibility:
The VTR Indicator is suitable for all market pairs (cryptocurrencies, stocks, forex, indices), allowing traders to apply it across various timeframes and asset classes without losing performance reliability.
Alert System:
Built-in alert conditions notify traders of Buy and Sell signals, ensuring they don’t miss any potential trading opportunities.
Signal Logic & Interpretation
Buy Signal (Long Entry):
Condition 1: The price closes above the upper ATR band, suggesting potential upward price movement.
Condition 2: The RSI is above 50, confirming bullish momentum.
Buy Signal Confirmation: The buy signal is generated when both conditions are met and there is no prior active buy signal.
Sell Signal (Short Entry):
Condition 1: The price closes below the lower ATR band, suggesting potential downward price movement.
Condition 2: The RSI is below 50, confirming bearish momentum.
Sell Signal Confirmation: The sell signal is generated when both conditions are met and there is no prior active sell signal.
No Repainting:
Once a buy or sell signal is confirmed, it will not be altered, erased, or replaced by future bars. This ensures that the trader can trust the signal once it appears, knowing it will not change as the market moves.
Exit Points:
Take Profit: When a long position is active, the TP level is calculated as a multiple of the ATR above the entry price.
Stop Loss: When a long position is active, the SL level is calculated as a multiple of the ATR below the entry price.
For short positions, these levels are reversed: TP is below the entry price, and SL is above the entry price.
Trading Strategy:
Entry:
Enter a long position when the buy signal is generated, confirmed by the price crossing the upper ATR band and the RSI being above 50.
Enter a short position when the sell signal is generated, confirmed by the price crossing the lower ATR band and the RSI being below 50.
Exit:
For long positions, exit when the price reaches the Take Profit (TP) level or hits the Stop Loss (SL) level.
For short positions, exit when the price reaches the Take Profit (TP) level or hits the Stop Loss (SL) level.
Risk Management:
Use the ATR-based Stop Loss (SL) and Take Profit (TP) levels to manage risk dynamically.
Always ensure your stop-loss levels are within your risk tolerance for each trade.
Unique Aspects:
Adaptability: The VTR Indicator adapts to changing market conditions, making it suitable for high volatility environments like cryptocurrency trading.
Non-Repainting: Once a signal is generated, it remains valid and doesn't change with new bars, ensuring a reliable trading strategy.
Built-in Risk Management: Automatic dynamic SL and TP levels allow for strategic trade exits, enhancing trade management.
Example Scenario
Scenario 1 (Bullish Trend):
The price is above the upper ATR band, and the RSI is above 50, signaling a strong bullish trend. The buy signal is triggered, and the price continues to rise, hitting the take-profit target based on ATR levels.
Exit: The price reaches the TP level or hits the SL level, and the position is closed.
Scenario 2 (Bearish Trend):
The price is below the lower ATR band, and the RSI is below 50, signaling a strong bearish trend. A sell signal is generated, and the price continues to decline, hitting the take-profit target.
Exit: The price reaches the TP level or hits the SL level, and the short position is closed.

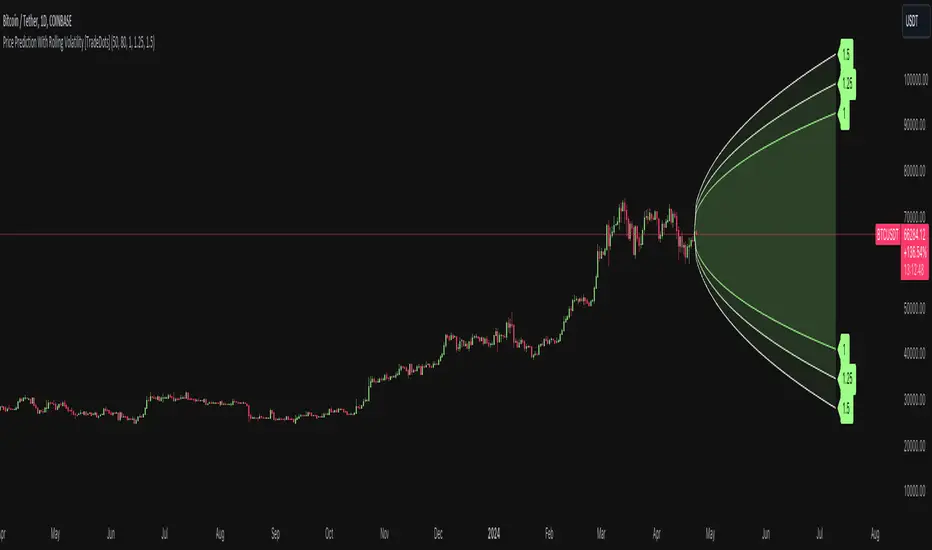
Price Prediction With Rolling Volatility [TradeDots]The "Price Prediction With Rolling Volatility" is a trading indicator that estimates future price ranges based on the volatility of price movements within a user-defined rolling window.
HOW DOES IT WORK
This indicator utilizes 3 types of user-provided data to conduct its calculations: the length of the rolling window, the number of bars projecting into the future, and a maximum of three sets of standard deviations.
Firstly, the rolling window. The algorithm amasses close prices from the number of bars determined by the value in the rolling window, aggregating them into an array. It then calculates their standard deviations in order to forecast the prospective minimum and maximum price values.
Subsequently, a loop is initiated running into the number of bars into the future, as dictated by the second parameter, to calculate the maximum price change in both the positive and negative direction.
The third parameter introduces a series of standard deviation values into the forecasting model, enabling users to dictate the volatility or confidence level of the results. A larger standard deviation correlates with a wider predicted range, thereby enhancing the probability factor.
APPLICATION
The purpose of the indicator is to provide traders with an understanding of the potential future movement of the price, demarcating maximum and minimum expected outcomes. For instance, if an asset demonstrates a substantial spike beyond the forecasted range, there's a significantly high probability of that price being rejected and reversed.
However, this indicator should not be the sole basis for your trading decisions. The range merely reflects the volatility within the rolling window and may overlook significant historical price movements. As with any trading strategies, synergize this with other indicators for a more comprehensive and reliable analysis.
Note: In instances where the number of predicted bars is exceedingly high, the lines may become scattered, presumably due to inherent limitations on the TradingView platform. Consequently, when applying three SD in your indicator, it is advised to limit the predicted bars to fewer than 80.
RISK DISCLAIMER
Trading entails substantial risk, and most day traders incur losses. All content, tools, scripts, articles, and education provided by TradeDots serve purely informational and educational purposes. Past performances are not definitive predictors of future results.
Volatility Trend Bands [Orderflowing]Volatility Trend Bands | Moving Averages | Adaptive Bands | Volatility | Smoothing (+)
Built using Pine Script V5.
Introduction
The Volatility Trend Bands indicator is a trading tool designed for trend analysis and market volatility visualization.
It integrates multiple moving average types, offering traders a customizable trend visual.
Inspiration and Originality
The Volatility Trend Bands indicator is inspired by the need for a comprehensive trend/volatility tool that can work with differing market conditions and trading styles.
Its use of multiple moving average types and more customizable settings sets it apart from other traditional technical analysis tools.
Core Features
Multiple Moving Average Types: Offers EMA, DEMA, T3, Laguerre, ZLEMA, TEMA, or HULL types for the calculation.
Band Width: Allows for the adjustment of band width, used to align it with different analytical styles and volatility levels.
Optional Smoothing: Implements smoothing techniques for a clearer view of the Trend Band, reducing market noise and take significant movements into account.
Calculations: Includes options like Laguerre Gamma and Volume Factor for T3, allowing depth for the Laguerre & T3 options.
Input Parameters
Lookback Period: Adjust the number of past data points considered, affecting sensitivity to market changes.
Moving Average Type: Select from the available options to determine the band's calculation method.
Band Width Multiplier: Modify the width of the bands to visualize market extremes and volatility more effectively.
Smoothing Techniques: Choose to apply smoothing for a trend visualization.
Calculation Settings: Fine-tune settings like Laguerre Gamma and Volume Factor.
Example of Disabled Smoothing (EMA type):
Example of Enabled Smoothing (EMA type):
Example of T3 Calculation:
Example of Multi-Timeframe (1D Calculation / 4H Chart):
Usage and Applications
Instrument Trend Analysis: The plotted trend can be used to analyze trends and potential reversal points, helping with strategic decision-making.
Volatility: Offers visual of market volatility, and furthermore in the identification of potential breakout points.
Risk Management: Utilize the bands for setting strategic stop-loss or take-profit levels, based on nuanced market movement analysis.
The Value
The Volatility Trend Bands indicator is a custom tool, offering advanced features and customization options that justify its value.
Conclusion
The Volatility Trend Bands indicator is a useful tool for market analysis, offering a mix of advanced calculation methods and customization options.
It adapts to market conditions and trader preferences, providing a flexible approach to trend analysis.
The Volatility Trend Bands indicator is to be used for confluence with other trading strategies and market analysis methods.
Only relying on this indicator for trading decisions is not advised.

EWMA Implied Volatility based on Historical VolatilityVolatility is the most common measure of risk.
Volatility in this sense can either be historical volatility (one observed from past data), or it could implied volatility (observed from market prices of financial instruments.)
The main objective of EWMA is to estimate the next-day (or period) volatility of a time series and closely track the volatility as it changes.
The EWMA model allows one to calculate a value for a given time on the basis of the previous day's value.
The EWMA model has an advantage in comparison with SMA, because the EWMA has a memory.
The EWMA remembers a fraction of its past by a factor A, that makes the EWMA a good indicator of the history of the price movement if a wise choice of the term is made.
Full details regarding the formula :
www.investopedia.com
In this scenario, we are looking at the historical volatility using the anual length of 252 trading days and a monthly length of 21.
Once we apply all of that we are going to get the yearly volatility.
After that we just have to divide that by the square root of number of days in a year, or weeks in a year or months in a year in order to get the daily/weekly/monthly expected volatility.
Once we have the expected volatility, we can estimate with a high chance where the market top and bottom is going to be and continue our analysis on that premise.
If you have any questions, please let me know !

Relative Normalized VolatilityThere are plenty of indicators that aim to measure the volatility (degree of variation) in the price of an instrument, the most well known being the average true range and the rolling standard deviation. Volatility indicators form the key components of most bands and trailing stops indicators, but can also be used to normalize oscillators, they are therefore extremely versatile.
Today proposed indicator aim to compare the estimated volatility of two instruments in order to provide various informations to the user, especially about risk and profitability.
CALCULATION
The relative normalized volatility (RNV) indicator is the ratio between the moving average of the absolute normalized price changes value of two securities, that is:
SMA(|Δ(a)/σ(a)|)
―――――――――――
SMA(|Δ(b)/σ(b)|)
Where a and b are two different securities (note that notation "Δ(x)" refer to the 1st difference of x, and the "||" notation is used to indicate absolute value, for example "|x|" means absolute value of x) .
INTERPRETATION
The indicator aim tell us which security is more volatile between a and b , with a value of the indicator greater than 1 indicating that a is on average more volatile than b over the last length period, while a value lower than 1 indicating that the security b is more on average volatile than a .
The indicator use the current symbol as a , while the second security b must be defined in the setting window (by default the S&P500). Risk and profitability are closely related to volatility, as larger price variations could potentially mean larger losses (but also larger gains), therefore a value of the indicator greater than 1 can indicate that it could be more risked (and profitable) to trade security a .
RNV using AMD (top) volatility against Intel (bottom) volatility.
RNV using EURUSD (top) volatility against USDJPY (bottom) volatility.
Larger values of length will make the indicator fluctuate less often around 1. You can also plot the logarithm of the ratio instead in order to have the indicator centered around 0, it will also help make values originally below 1 have more importance in the scale.
POSSIBLE ERRORS
If you compare different types of markets the indicator might return NaN values, this is because one market might be closed, for example if you compare AMD against BTCUSD with the indicator you will get NaN values. If you really need to compare two markets then increase your time frame, else use an histogram or area plot in order to have a cleaner plot.
CONCLUSION
An original indicator comparing the volatility between two securities has been presented. The choice of posting a volatility indicator has been made by my twitter followers, so if you want to decide which type of indicator i should do next make sure to check my twitter to see if there are polls available (i should do one after every posted indicator).