Auto AVWAP (Anchored-VWAP) with Breakout Screener_v2Updated indicator for AWAP breakout. The indicator identified the candle that breaks out of AVWAP
In den Scripts nach "VWAP" suchen

Volume Weighted Average Price - CoinruleVWAP with additional Anchor Periods as supported on Coinrule.

Anchored VWAP ClickIt calculates AVWAP set from a mouse click on a chart instead of having to edit a popup box, manually transferring date and time from the chart.
It's the Oct 2021 sample script from Tradingview to demonstrate their new chart interactive capabilities of Pine script.
www.tradingview.com
I take no credit for this, just noticed it wasn't in the Public Library.
This ability to accept OnMouse positional data from the chart, into an indicator has been needed in TV for a long time.
Glad to see they continue to grow the capabilities.

Auto Anchored Volume Weighted Average Price - Custom AVWAP
Based on Brian Shannon's AVWAP - This indicator anchors vwap to the highest high, lowest low and highest volume bar of a user defined lookback period.
In the chart example above on AVAX, the lookback period is set to 90 days
- The blue line depicts AVWAP from the highest bar in in the last 90 dats
- The purple Line is AVWAP from the lowest bar in the last 90 days
- The golden line is AVWAP from the highest volume bar in the last 90 Days
These levels act as a price magnet and strong levels of support and resistance. I use them to identify chart locations for where I want to do business and look for trade setups.
Unlike moving averages, AVWAP will maintain it's chart position no matter the chart resolution. One way to take advantage of this is to wait for price to get to one of these levels, go to lower timeframes and find low risk setups based on your trading strategy.
You can customise the look and feel and which anchors you want displayed. You can use multiple instances with varying lookback periods to display shorter and longer term levels simultaneously

VWAP Stoch Long Trailing Stop without wednesday and thursdaySimple trading strategy based on VWAP and Stochastic indicators and a 3% trailing stop.
After backtesting, wednesdays and thursdays seemed to be bad entry days so they are blacklisted.
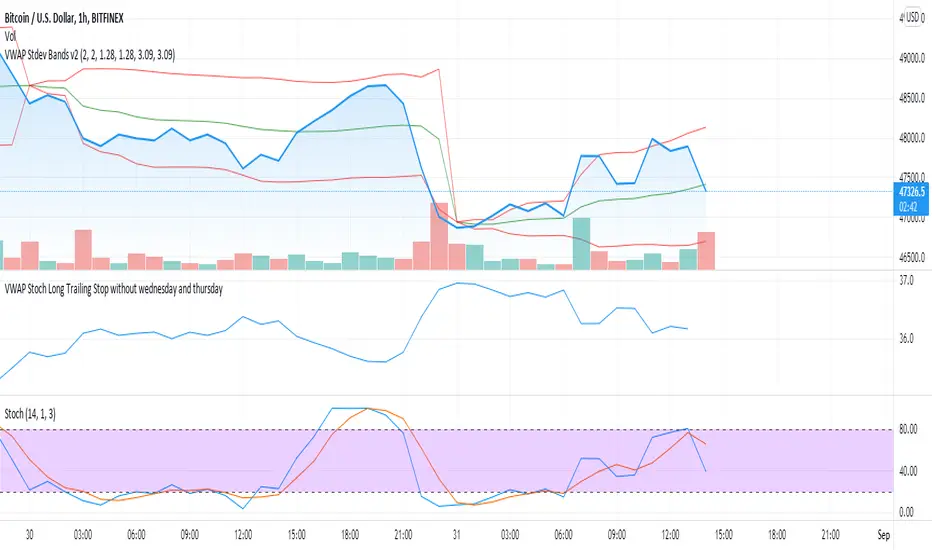
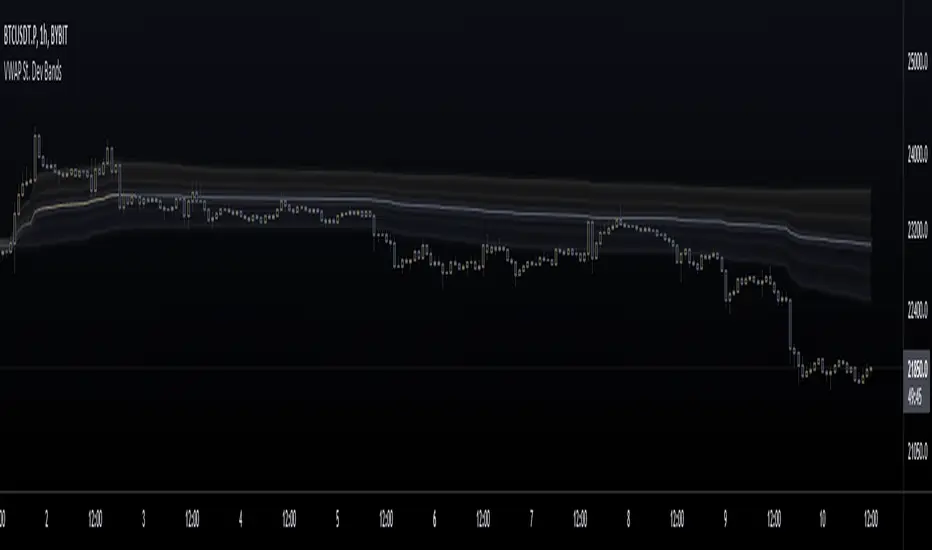
VWAP St. Dev BandsThis indicator allows you to add up to 3 volatility bands to VWAP based on its Standard Deviation.
Best use is for intraday but you can choose higher timeframes too.
For day trading a band of 3 standard deviations usually works well as an overbought/oversold region, allowing for mean reversion trading, but you are free to come up with your own strategies.
Enjoy!
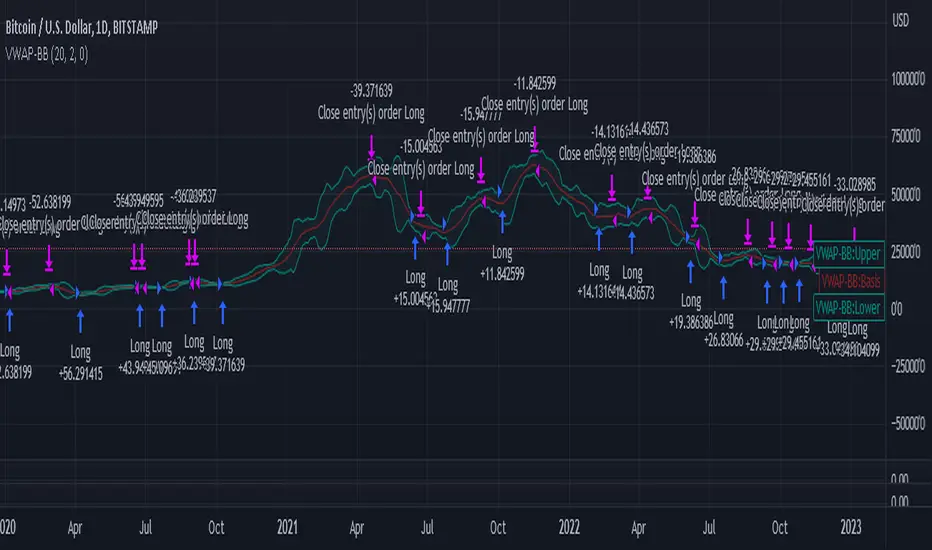
VWAP-Bollinger BandsThis script uses Bollinger bands but with a VWAP as the source, it uses the high crossing the upper band as a buy signal and a low crossing the lower band as a sell signal
Its default settings are for a day chart - Crypto 30 periods, forex 24 periods and stocks 20 periods, which basically line up with a month per asset class
ive seen good results in crypto and stocks, settings used between1% and 10% equity per trade with a 0.1% fee which lines up with Binance fee structure and $25 per trade which lines up with Commsec on the ASX
Vwap Ribbon - JDThis indicator displays a custom timeframe VWAP line
together with several multiples of this timeframe
After a large price move, the price often tends to return to one of these multiples
JD.
#nottradingadvice
#DYOR

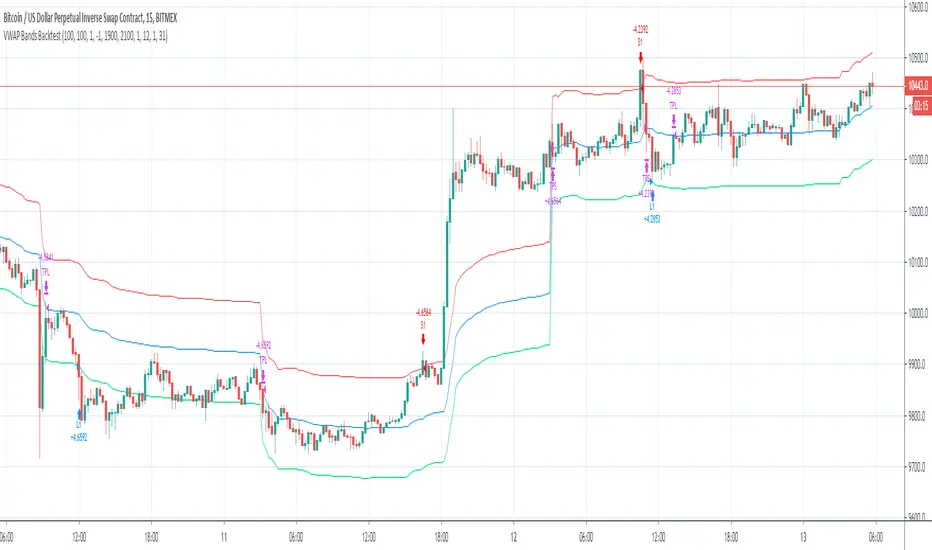
VWAP Bands BacktestThis is a backtest for evaluating the profitability of a vwap offsets strategy over time.
I took part of the code to create the script from Noro
So there is a link for its code

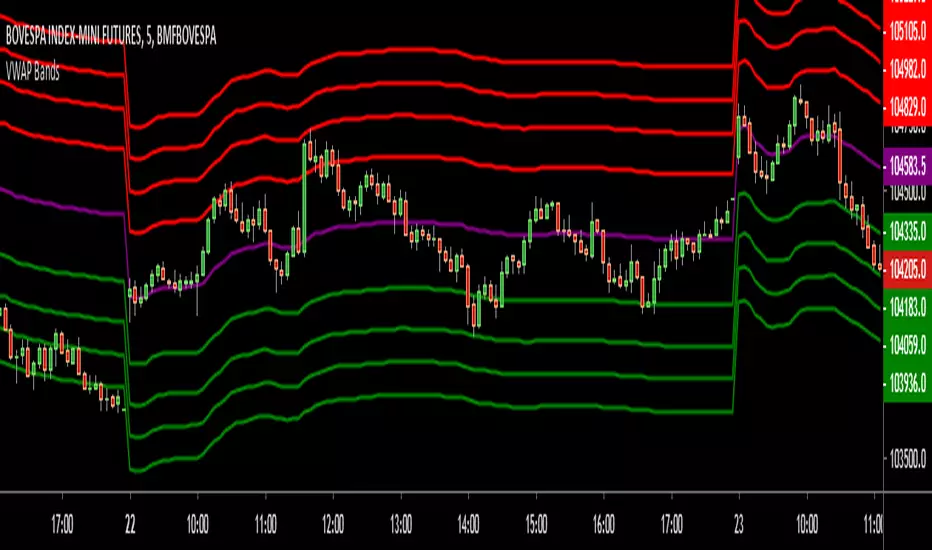
VWAP BandsThis indicator plots distant VWAP lines that serve as support and resistance. You can add more lines from the script.
Good trades!

VWAP Stdev Bands v3Adds timeframe option for Weekly and Monthly timeframes, changes default 2nd and 3rd bands to more common deviations

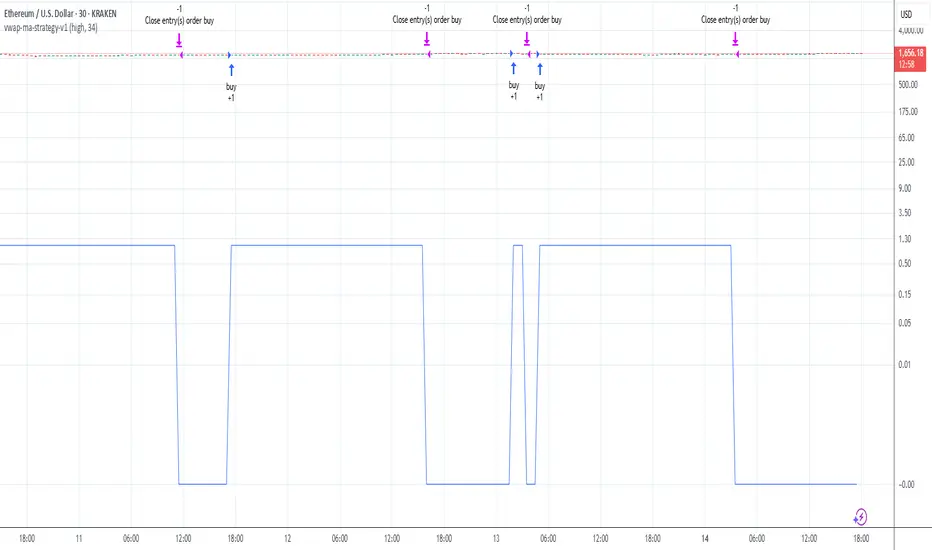
vwap-ma-strategy-v0.7This strategy was inspired by my Israeli fellow iAtiya.
I love it because it's my first pine v3 script that actually works.
Powerful with respect to it's simplicity.
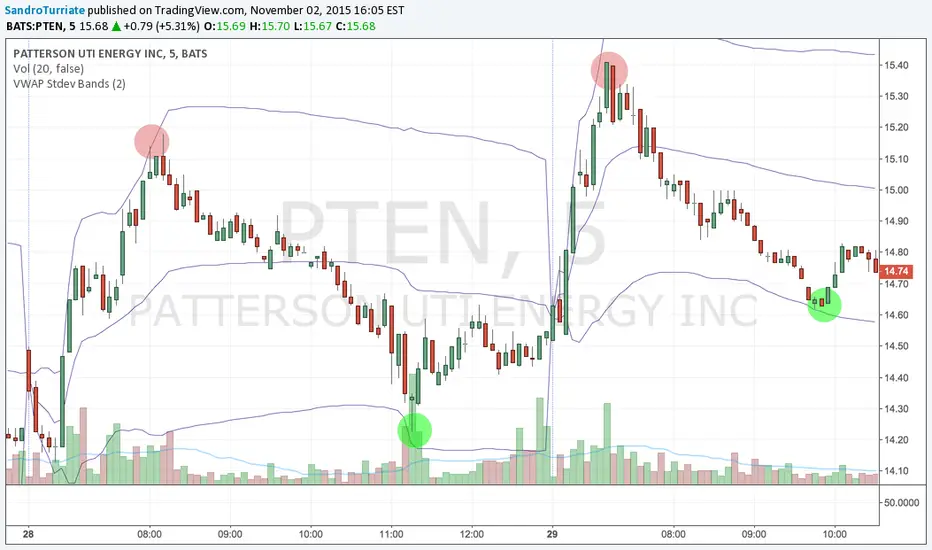
VWAP Stdev BandsThis indicator plots VWAP with 2x Standard Deviation bands. This could potentially be used to trade a mean reversion type strategy. Only works on intraday charts.
VWAP with FIB range JayyThis is sandbox experiment. The script creates bands around the VWAP based on the opening range on an intraday chart (adjustable in the format section) using fibonacci multipliers (mostly): .236, .382, .5, .618, .786, 1, 1.27 and 1.618. I have not built much flexibility into the script so this is very much an alpha script. Something new for Pippin and Kipp.

DEMA200 + EMA9/20/50 + VWAP (Paul Laurent Trading)This script is an all-in-one overlay indicator for TradingView that combines a **DEMA 200**, **EMA 9/20/50**, and TradingView’s **anchored VWAP** (the same VWAP logic as the default VWAP indicator). It’s designed to keep your chart clean while showing key trend and mean-reversion references in one place.
**How to use it**
* Add it to your chart like any indicator: open **Indicators**, search the script name, and click **Add to chart**.
* Use **EMA 9/20/50** for short-term trend and pullback structure (9 = fastest, 50 = slowest).
* Use **DEMA 200** as your long-term trend filter and major dynamic support/resistance.
* Use **VWAP (middle blue line)** as the intraday “fair value” reference. Price above VWAP generally shows stronger demand; below VWAP suggests weaker demand.
* Open the script **Settings** to customize:
* **Colors** and **Strength (line width)** for each line
* VWAP **Anchor Period** (Session, Week, Month, etc.)
* Optional VWAP **Bands** (off by default, can be enabled anytime)

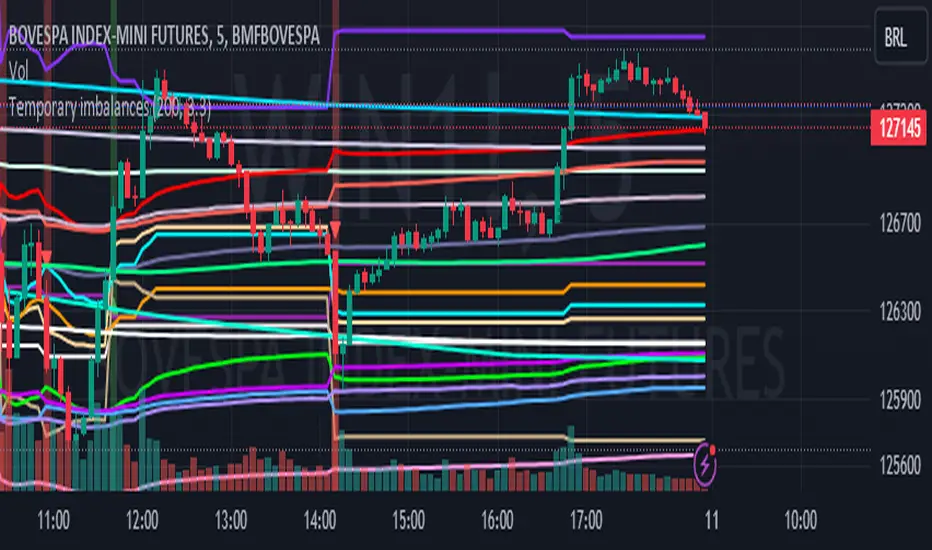
Temporary imbalances 2.0 This indicator attempts to calculate potential points of imbalance and equilibrium based on VWAPs and modified moving averages. The idea is to determine if there has been a change in volume and perform the calculation from that point It uses the standard deviation to determine the significant imbalance threshold. Candles with bullish imbalances are highlighted in green, while candles with bearish imbalances are highlighted in red.
"It also features a set of VWAPs and modified moving averages that you can enable or disable."
When you activate the 'Show Anchor VWAP' option, it will add five modified VWAPs.
Practical Significance:
The Anchored VWAP is a volume-weighted average price that serves as a dynamic reference to assess the average price during specific moments of market imbalance.
During a bullish imbalance, the anchor_vwap reflects the VWAP at that moment, emphasizing price behavior during that specific period.
Similarly, in a bearish imbalance, the anchor_vwap provides the associated VWAP for that condition, highlighting price movements during the imbalance phase.
How to Use:
The anchor_vwap can be employed to contextualize the volume-weighted average price during critical moments associated with significant changes in market imbalance.
By analyzing price behavior during and after periods of imbalance, the Anchored VWAP can help better understand market dynamics and identify potential areas of support or resistance.
Show VWAP Percent Imbalance"
Definition: Represents the Volume Weighted Average Price (VWAP) adjusted by the volume-weighted average of the price multiplied by volume, with a focus on conditions where the percentage volume variation surpasses a predefined threshold.
Calculation: Utilizes the simple moving average weighted of the product of the volume-weighted average price and volume only when the percentage volume variation exceeds a specific threshold.
Interpretation: Provides insight into the volume-weighted price trend during conditions where the percentage volume variation exceeds a predefined limit.
The "showDeltaVWAP" is a toggleable setting that you can turn on or off. When activated, it displays special lines on the chart. Let's understand what these lines represent:
Delta Anchor VWAP:
A green line (Delta Anchor VWAP) represents a measure of market volume imbalance.
Delta2 Anchor VWAP:
A red line (Delta2 Anchor VWAP) shows another perspective of volume imbalance.
VWAP Delta Volume:
A light blue line (VWAP Delta Volume) displays a volume-weighted average of price.
VWAP Delta Volume2:
An orange line (VWAP Delta Volume2) shows another view of the volume-weighted average of price.
Delta3 Anchor VWAP:
A light blue line (Delta3 Anchor VWAP) represents a combination of the previous measures.
Delta4 Anchor VWAP:
A purple line (Delta4 Anchor VWAP) is another combination, providing an overall view.
These lines are based on different conditions and calculations related to trading volume. When you activate "showDeltaVWAP," these lines appear on the chart, aiding in better understanding market behavior.
"Show Faster Volatility" is an option that you can enable or disable. When activated (set to true), it displays special lines on the chart called "Faster Volatility VWAP," "Faster Volatility VWAP2," and "Faster Volatility VWAP3." Let's understand what these lines represent:
Faster Volatility VWAP:
A purple line (Faster Volatility VWAP) is a Volume Weighted Average Price (VWAP) that is calculated more quickly based on short-term price reversal patterns.
Faster Volatility VWAP2:
A light gray line (Faster Volatility VWAP2) is another Volume Weighted Average Price (VWAP) that is calculated even more quickly based on even shorter-term price reversal patterns.
Faster Volatility VWAP3:
A purple line (Faster Volatility VWAP3) is another Volume Weighted Average Price (VWAP) calculated rapidly based on even shorter-term price reversal patterns.
These lines are designed to indicate moments of possible exhaustion of volatility in the market, suggesting that there may be a subsequent increase in volatility. When you activate "Show Faster Volatility," these lines are displayed on the chart.
"Show Average VWAPs Imbalance" displays weighted averages of different Volume Weighted Average Prices (VWAPs) in relation to specific market conditions. Here's an explanation of each component:
Standard VWAP:
The blue line represents the standard VWAP, a volume-weighted average of asset prices over a specific period.
VWAP with Added Imbalance (avg_vwap2):
The pink line is a weighted average that adds an imbalance value to the standard VWAP. This component highlights periods of market imbalance.
VWAP with Balance (avg_vwap3):
The lilac line is a weighted average that adds balance based on the imbalance between uptrend and downtrend, reflecting changes in volume. This provides insights into supply and demand dynamics.
Overall Average of VWAPs (avg_vwaptl):
The violet line is a weighted average that incorporates both standard and adjusted VWAPs, offering an overview of market behavior under different considered conditions.
Visual Customization (Show Average VWAPs Imbalance):
Users have the option to show or hide these average lines on the chart, allowing for a clear visualization of market trends.
"Show Min Variation VWAP" is associated with the calculation and display of a smoothed version of the Volume Weighted Average Price (VWAP), taking into account the minimum price variation over a specific period.
"How Imbalance Anchor VWAP Calculated as the smoothed relationship between liquidity difference and maximum VWAP equilibrium" is associated with the calculation and display of a smoothed version of the Imbalance Anchor VWAP. Here is a detailed explanation:
Calculations and Smoothing:
The variable "smoothed_difference" represents the exponential moving average (EMA) of the difference between two variables related to liquidity.
"smoothed_difference2" is the division of "smoothed_difference" by the maximum variation of the VWAP Equilibrium.
"smoothed_difference3" involves additional manipulation of "smoothed_difference" and "vwap_delta3."
"smoothed_difference4" incorporates the previous results, adjusted by the value of the VWAP.
Visual Customization:
The user has the option to enable or disable the display on the chart.
The line is colored in a shade of green.
It provides a smoothed representation of the Imbalance Anchor VWAP.
The line is colored in a shade of blue, and the calculation involves the summation of moving averages (20, 50, 200). Afterward, there is division by 3. Additionally, there is the summation of moving averages (766, 866, 966), divided by 3. The final step is to add these results together and divide by 2. media name is Imbalance Value2
Show VWAP Equilibrium (Max Variation) Calculated as the difference between two VWAPs derived from the highest and lowest price changes
Show Equilibrium VWAP Calculated as the sum of VWAP and (sma200 - sma20)
calculate the difference between the media of 200 to 20
Show Equilibrium VWAP Calculated as the sum of VWAP and (766+866+966)/3 - (sma200 - sma20)
Show Equilibrium VWAP Standard Deviation Calculated as the Exponential Moving Average (EMA) of the Standard Deviation of SMA (sma200 + sma20 + sma8)/3
Show Equilibrium VWAP Delta Calculated as the ratio of the smoothed VWAP Delta Result componentes
Show Standard Deviation Equilibrium VWAP Delta: Calculated as the Standard Deviation between the Average of VWAP Delta Result Components and Their Smoothed Versions
This average attempts to calculate the equilibrium."
vwap_equilibrium:
Definition: Represents the Volume Weighted Average Price (VWAP) adjusted by the volume-weighted average of the price (hl2) multiplied by volume, focusing on periods of volume equilibrium.
Calculation: Utilizes the simple moving average weighted (sma) of the product of the volume-weighted average price and volume only when there is no volume imbalance.
Interpretation: This indicator provides a view of the volume-weighted price trend during moments when the market is in equilibrium, meaning there is no noticeable imbalance in volume conditions. The calculation of VWAP is adjusted to reflect market characteristics during periods of stability.
vwap_percent_condition:
Definition: Represents the Volume Weighted Average Price (VWAP) adjusted by the volume-weighted average of the price multiplied by volume, with a focus on conditions where the percentage volume variation surpasses a predefined threshold.
Calculation: Utilizes the simple moving average weighted of the product of the volume-weighted average price and volume only when the percentage volume variation exceeds a specific threshold.
Interpretation: Provides insight into the volume-weighted price trend during conditions where the percentage volume variation exceeds a predefined limit.
The objective of these two VWAPs is to calculate possible equilibrium points between buyers and sellers.
The indicator works for all timeframes This indicator can be adjusted according to the preferences and characteristics of the specific asset or market. It provides clear visual information and can be used as a complementary tool for technical analysis in trading strategies.
Interesting
Interesting
lookback period 7 , 12, 20,70,200, 500,766,866,966
imbalance threshold 2.4, 3.3 ,4.2
The objective of this indicator is to identify and highlight various points of imbalance and equilibrium.
COIN/BTC Volume-Weighted DivergenceThe COIN/BTC Volume-Weighted Divergence indicator identifies buy and sell signals by analyzing deviations between Coinbase and Bitcoin prices relative to their respective VWAPs (Volume-Weighted Average Price). This method isolates points of potential trend reversals, overextensions, or relative mispricing based on volume-adjusted price benchmarks.
The indicator leverages Coinbase’s high beta relative to Bitcoin in bull markets. A buy signal occurs when Coinbase is below VWAP (indicating undervaluation) while Bitcoin is above VWAP (signaling strong broader momentum). A sell signal is generated when Coinbase trades above VWAP (indicating overvaluation) while Bitcoin moves below VWAP (indicating weakening momentum).
This divergence logic enables traders to identify misalignment between Bitcoin-driven market trends and Coinbase’s price behavior. The indicator effectively identifies undervalued entry points and signals exits before speculative extensions are correct. It provides a systematic approach to trading during trending conditions, aligning decisions with volume-weighted price dynamics and inter-asset relationships.
How It Works
1. VWAP:
“fair value” benchmark combining price and volume.
• Above VWAP: Bullish momentum.
• Below VWAP: Bearish momentum.
2. Divergence:
• Coinbase Divergence: close - coin_vwap (distance from COIN’s VWAP).
• Bitcoin Divergence: btc_price - btc_vwap (distance from BTC’s VWAP).
3. Signals:
• Buy: Coinbase is below VWAP (potentially oversold), and Bitcoin is above VWAP (broader bullish trend).
• Sell: Coinbase is above VWAP (potentially overbought), and Bitcoin is below VWAP (broader bearish trend).
4. Visualization:
• Green triangle: Buy signal.
• Red triangle: Sell signal.
Strengths
• Combines price and volume for reliable insights.
• Highlights potential trend reversals or overextensions.
• Exploits correlations between Coinbase and Bitcoin.
Limitations
• Struggles in sideways markets.
• Sensitive to volume spikes, which may distort VWAP.
• Ineffective in strong trends where divergence persists.
Improvements
1. Z-Scores: Use statistical thresholds (e.g., ±2 std dev) for stronger signals.
2. Volume Filter: Generate signals only during high-volume periods.
3. Momentum Confirmation: Combine with RSI or MACD for better reliability.
4. Multi-Timeframe VWAP: Use intraday, daily, and weekly VWAPs for deeper analysis.
Complementary Tools
• Momentum Indicators: RSI, MACD for trend validation.
• Volume-Based Metrics: OBV, cumulative delta volume.
• Support/Resistance Levels: Enhance reversal accuracy.

Foresight Cone (HoltxF1xVWAP) [KedArc Quant]Description:
This is a time-series forecasting indicator that estimates the next bar (F1) and projects a path a few bars ahead. It also draws a confidence cone based on how accurate the recent forecasts have been. You can optionally color the projection only when price agrees with VWAP.
Why it’s different
* One clear model: Everything comes from Holt’s trend-aware forecasting method—no mix of unrelated indicators.
* Transparent visuals: You see the next-bar estimate (F1), the forward projection, and a cone that widens or narrows based on recent forecast error.
* Context, not signals: The VWAP option only changes colors. It doesn’t add trade rules.
* No look-ahead: Accuracy is measured using the forecast made on the previous bar versus the current bar.
Inputs (what they mean)
* Source: Price series to forecast (default: Close).
* Preset: Quick profiles for fast, smooth, or momentum markets (see below).
* Alpha (Level): How fast the model reacts to new prices. Higher = faster, twitchier.
* Beta (Trend): How fast the model updates the slope. Higher = faster pivots, more flips in chop.
* Horizon: How many bars ahead to project. Bigger = wider cone.
* Residual Window: How many bars to judge recent accuracy. Bigger = steadier cone.
* Confidence Z: How wide the cone should be (typical setting ≈ “95% style” width).
* Show Bands / Draw Forward Path: Turn the cone and forward lines on/off.
* Color only when aligned with VWAP: Highlights projections only when price agrees with the trend side of VWAP.
* Colors / Show Panel: Styling plus a small panel with RMSE, MAPE, and trend slope.
Presets (when to pick which)
* Scalp / Fast (1-min): Very responsive; best for quick moves. More twitch in chop.
* Smooth Intraday (1–5 min): Calmer and steadier; a good default most days.
* Momentum / Breakout: Quicker slope tracking during strong pushes; may over-react in ranges.
* Custom: Set your own values if you know exactly what you want.
What is F1 here?
F1 is the model’s next-bar fair value. Crosses of price versus F1 can hint at short-term momentum shifts or mean-reversion, especially when viewed with VWAP or the cone.
How this helps
* Gives a baseline path of where price may drift and a cone that shows normal wiggle room.
* Helps you tell routine noise (inside cone) from information (edges or breaks outside the cone).
* Keeps you aware of short-term bias via the trend slope and F1.
How to use (step by step)
1. Add to chart → choose a Preset (start with Smooth Intraday).
2. Set Horizon around 8–15 bars for intraday.
3. (Optional) Turn on VWAP alignment to color only when price agrees with the trend side of VWAP.
4. Watch where price sits relative to the cone and F1:
* Inside = normal noise.
* At edges = stretched.
* Outside = possible regime change.
5. Check the panel: if RMSE/MAPE spike, expect a wider cone; consider a smoother preset or a higher timeframe.
6. Tweak Alpha/Beta only if needed: faster for momentum, slower for chop.
7. Combine with your own plan for entries, exits, and risk.
Accuracy Panel — what it tells you
Preset & Horizon: Shows which preset you’re using and how many bars ahead the projection goes. Longer horizons mean more uncertainty.
RMSE (error in price units): A “typical miss” measured in the chart’s currency (e.g., ₹).
Lower = tighter fit and a usually narrower cone. Rising = conditions getting noisier; the cone will widen.
MAPE (error in %): The same idea as RMSE but in percent.
Good for comparing different symbols or timeframes. Sudden spikes often hint at a regime change.
Slope T: The model’s short-term trend reading.
Positive = gentle up-bias; negative = gentle down-bias; near zero = mostly flat/drifty.
How to read it at a glance
Calm & directional: RMSE/MAPE steady or falling + Slope T positive (or negative) → trends tend to respect the cone’s mid/upper (or mid/lower) area.
Choppy/uncertain: RMSE/MAPE climbing or jumping → expect more whipsaw; rely more on the cone edges and higher-TF context.
Flat tape: Slope T near zero → mean-revert behavior is common; treat cone edges as stretch zones rather than breakout zones.
Warm-up & tweaks
Warm-up: Right after adding the indicator, the panel may be blank for a short time while it gathers enough bars.
Too twitchy? Switch to Smooth Intraday or increase the Residual Window.
Too slow? Use Scalp/Fast or Momentum/Breakout to react quicker.
Timeframe tips
* 1–3 min: Scalp/Fast or Momentum/Breakout; horizon \~8–12.
* 5–15 min: Smooth Intraday; horizon \~12–15.
* 30–60 min+: Consider a larger residual window for a steadier cone.
FAQ
Q: Is this a strategy or an indicator?
A: It’s an indicator only. It does not place orders, TP/SL, or run backtests.
Q: Does it repaint?
A: The next-bar estimate (F1) and the cone are calculated using only information available at that time. The forward path is a projection drawn on the last bar and will naturally update as new bars arrive. Historical bars aren’t revised with future data.
Q: What is F1?
A: F1 is the indicator’s best guess for the next bar.
Price crossing above/below F1 can hint at short-term momentum shifts or mean-reversion.
Q: What do “Alpha” and “Beta” do?
A: Alpha controls how fast the indicator reacts to new prices
(higher = faster, twitchier). Beta controls how fast the slope updates (higher = quicker pivots, more flips in chop).
Q: Why does the cone width change?
A: It reflects recent forecast accuracy. When the market gets noisy, the cone widens. When the tape is calm, it narrows.
Q: What does the Accuracy Panel tell me?
A:
* Preset & Horizon you’re using.
* RMSE: typical forecast miss in price units.
* MAPE: typical forecast miss in percent.
* Slope T: short-term trend reading (up, down, or flat).
If RMSE/MAPE rise, expect a wider cone and more whipsaw.
Q: The panel shows “…” or looks empty. Why?
A: It needs a short warm-up to gather enough bars. This is normal after you add the indicator or change settings/timeframes.
Q: Which timeframe is best?
A:
* 1–3 min: Scalp/Fast or Momentum/Breakout, horizon \~8–12.
* 5–15 min: Smooth Intraday, horizon \~12–15.
Higher timeframes work too; consider a larger residual window for steadier cones.
Q: Which preset should I start with?
A: Start with Smooth Intraday. If the market is trending hard, try Momentum/Breakout.
For very quick tapes, use Scalp/Fast. Switch back if things get choppy.
Q: What does the VWAP option do?
A: It only changes colors (highlights when price agrees with the trend side of VWAP).
It does not add or remove signals.
Q: Are there alerts?
A: Yes—alerts for price crossing F1 (up/down). Use “Once per bar close” to reduce noise on fast charts.
Q: Can I use this on stocks, futures, crypto, or FX?
A: Yes. It works on any symbol/timeframe. You may want to adjust Horizon and the Residual Window based on volatility.
Q: Can I use it with Heikin Ashi or other non-standard bars?
A: You can, but remember you’re forecasting the synthetic series of those bars. For pure price behavior, use regular candles.
Q: The cone feels too wide/too narrow. What do I change?
A:
* Too wide: lower Alpha/Beta a bit or increase the Residual Window.
* Too narrow (misses moves): raise Alpha/Beta slightly or try Momentum/Breakout.
Q: Why do results change when I switch timeframe or symbol?
A: Different noise levels and trends. The accuracy stats reset per chart, so the cone adapts to each context.
Q: Any limits or gotchas?
A: Extremely large Horizon may hit TradingView’s line-object limits; reduce Horizon or turn
off extra visuals if needed. Big gaps or news spikes will widen errors—expect the cone to react.
Q: Can this predict exact future prices?
A: No. It provides a baseline path and context. Always combine with your own rules and risk management.
Glossary
* TS (Time Series): Data over time (prices).
* Holt’s Method: A forecasting approach that tracks a current level and a trend to predict the next bars.
* F1: The indicator’s best guess for the next bar.
* F(h): The projected value h bars ahead.
* VWAP: Volume-Weighted Average Price—used here for optional color alignment.
* RMSE: Typical forecast miss in price units (how far off, on average).
* MAPE: Typical forecast miss in percent (scale-free, easy to compare).
Notes & limitations
* The panel needs a short warm-up; stats may be blank at first.
* The cone reflects recent conditions; sudden volatility changes will widen it.
* This is a tool for context. It does not place trades and does not promise results.
⚠️ Disclaimer
This script is provided for educational purposes only.
Past performance does not guarantee future results.
Trading involves risk, and users should exercise caution and use proper risk management when applying this strategy.

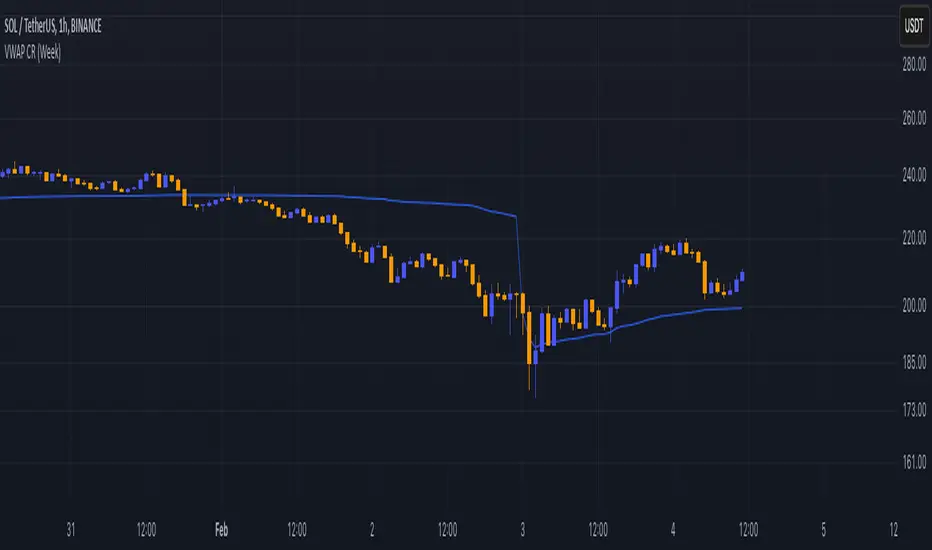
MRG VWAP CompleteMRG VWAP Complete - Indicator Description
📊 Overview
MRG VWAP Complete is a professional all-in-one VWAP indicator that combines two powerful volume-weighted average price tools into a single, highly customizable solution. This indicator provides traders with both anchored VWAP with deviation bands and a weekly VWAP that resets every Sunday, offering comprehensive price analysis across multiple timeframes.
🎯 Key Features
Dual VWAP System
Standard VWAP: Highly configurable with multiple anchor periods and deviation bands
Weekly VWAP: Automatically resets every Sunday for swing trading strategies
Option to display both simultaneously or independently
Standard VWAP Capabilities
Multiple Anchor Periods:
Session (Daily)
Week / Month / Quarter / Year
Decade / Century
Corporate Events: Earnings / Dividends / Splits
Customizable Parameters:
Source selection (HLC3, Close, Open, etc.)
Hide on 1D timeframes and above
Offset adjustment
Custom color and line thickness (1-5)
Advanced Deviation Bands System
Three Independent Band Levels:
Each band can be enabled/disabled individually
Customizable multipliers for each level
Independent color selection for each band
Optional fill toggle for each band
Two Calculation Modes:
Standard Deviation: Traditional statistical approach
Percentage: Distance calculated as percentage of VWAP value
Visual Customization:
✅ Enable/disable band fills independently
🎨 Choose any color for each band
📏 Transparent fills (95% opacity) for clear price action visibility
🎯 Clean chart display with only desired elements
Weekly VWAP Features
Resets automatically every Sunday
Customizable source input
Independent color and line width settings
Perfect for identifying weekly trends and key levels
⚙️ Complete Parameter List
Display Options
Show/Hide Standard VWAP
Show/Hide Weekly VWAP
Standard VWAP Settings
Anchor Period selection
Source selection
Hide on 1D or above option
Offset value
VWAP color
VWAP line width (1-5)
Bands Settings
Calculation mode (Standard Deviation / Percentage)
Band #1: Enable, Multiplier, Color, Fill toggle
Band #2: Enable, Multiplier, Color, Fill toggle
Band #3: Enable, Multiplier, Color, Fill toggle
Weekly VWAP Settings
Weekly VWAP color
Weekly VWAP line width (1-5)
Source selection
📈 Strategic Applications
Mean Reversion Trading
Use deviation bands to identify overbought/oversold conditions
Enter trades when price reaches outer bands
Target VWAP for exits
Trend Confirmation
Price above VWAP = Bullish bias
Price below VWAP = Bearish bias
Weekly VWAP confirms longer-term trend direction
Support & Resistance
VWAP acts as dynamic support/resistance
Deviation bands provide multiple levels for entries/exits
Weekly VWAP identifies major swing levels
Multi-Timeframe Analysis
Combine Standard VWAP (intraday) with Weekly VWAP (swing)
Identify confluence zones where both VWAPs align
Spot divergences between short-term and weekly trends
Breakout Trading
Monitor price action around VWAP levels
Trade breakouts through deviation bands
Weekly VWAP breaks signal strong momentum
💡 Advantages
✨ All-in-One Solution: No need for multiple VWAP indicators
⏱️ Time-Saving: Pre-configured with professional settings
🎯 Precision: Multiple anchor periods for different trading styles
🎨 Fully Customizable: Every visual element can be adjusted
📊 Clean Charts: Toggle fills on/off for optimal visualization
🔄 Automatic Updates: Both VWAPs update in real-time
📱 Universal: Works on all timeframes and instruments
🎓 Ideal For
Trading Styles
Day Trading (M1, M5, M15)
Swing Trading (H1, H4, D1)
Scalping strategies
Position trading
Markets
Forex (XAUUSD, EUR/USD, GBP/USD, etc.)
Indices (US30, NAS100, SPX500)
Cryptocurrencies
Commodities
Stocks
Strategies
VWAP mean reversion
Trend following
Breakout trading
Volume-weighted support/resistance
Institutional order flow analysis
🔧 Recommended Settings
For Day Trading (M5-M15)
Standard VWAP: Anchor = Session
Band #1: Multiplier 1.0, Fill ON
Band #2: Multiplier 2.0, Fill OFF
Weekly VWAP: Enabled for major levels
For Swing Trading (H1-H4)
Standard VWAP: Anchor = Week
Band #1: Multiplier 1.5, Fill ON
Band #2: Multiplier 2.5, Fill ON
Weekly VWAP: Primary level for trend confirmation
For Scalping (M1-M5)
Standard VWAP: Anchor = Session
Band #1: Multiplier 0.5, Fill ON
Band #2: Multiplier 1.0, Fill OFF
Weekly VWAP: Disabled for cleaner chart
📊 Understanding the Bands
Band Multiplier = 1.0
Contains ~68% of price action (1 standard deviation)
Primary mean reversion zone
Band Multiplier = 2.0
Contains ~95% of price action (2 standard deviations)
Strong overbought/oversold signal
Band Multiplier = 3.0
Contains ~99.7% of price action (3 standard deviations)
Extreme reversal zones
🎯 Trading Tips
Confluence Trading: Enter when price touches a deviation band AND Weekly VWAP
Trend Confirmation: Only take long trades above both VWAPs, shorts below both
Band Rejection: Watch for candle rejections at outer bands for reversal signals
Volume Confirmation: Strong moves should break bands with high volume
Time of Day: VWAP is most reliable during high-volume sessions
📌 Important Notes
VWAP resets based on anchor period selection
Weekly VWAP uses Sunday as the start of the week
Deviation bands require sufficient volume data
Best used in combination with other technical analysis tools
Not a standalone trading system - use proper risk management
🚀 Why Choose MRG VWAP Complete?
✅ Professional Grade: Used by institutional traders
✅ Maximum Flexibility: Adapt to any trading style
✅ Visual Clarity: Customizable colors and fills
✅ Dual Perspective: Intraday + weekly analysis combined
✅ Easy to Use: Intuitive parameter organization
✅ Performance Optimized: Efficient code for smooth charting
Master volume-weighted price analysis with the most complete VWAP indicator available! 📊🚀
💼 Perfect For Professional Traders
Whether you're a retail trader or institutional analyst, MRG VWAP Complete provides the tools you need to:
Identify fair value zones
Spot institutional order flow
Time entries with precision
Manage risk effectively
Trade with the smart money
Elevate your VWAP trading to the next level! 💎

Granular Candle-by-Candle VWAPGranular Candle-by-Candle VWAP is a customizable Volume Weighted Average Price (VWAP) indicator designed for TradingView. Unlike traditional VWAP indicators that operate on the chart's primary timeframe, this script enhances precision by incorporating lower timeframe (e.g., 1-minute) data into VWAP calculations. This granular approach provides traders with a more detailed and accurate representation of the average price, accounting for intra-bar price and volume movements. The indicator dynamically adjusts to the chart's current timeframe and offers a range of customization options, including price type selection, visual styling, and alert configurations.
Customizable Features
Users have extensive control over various aspects of the Granular Candle-by-Candle VWAP indicator. Below are the key features that can be customized to align with individual trading preferences:
🎛️ Customizable Features
Users have extensive control over various aspects of the Granular Candle-by-Candle VWAP indicator. Below are the key features that can be customized to align with individual trading preferences:
🔢 Lookback Period
Description: Defines the number of lower timeframe bars used in the VWAP calculation.
Customization:
Input: VWAP Lookback Period (Number of Lower Timeframe Bars)
Default Value: 20 bars
Range: Minimum of 1 bar
Purpose: Allows traders to adjust the sensitivity of the VWAP. A smaller lookback period makes the VWAP more responsive to recent price changes, while a larger period smoothens out fluctuations.
📈 Price Type Selection
Description: Determines which price metric is used in the VWAP calculation.
Customization:
Input: Price Type for VWAP Calculation
Options:
Open: Uses the opening price of each lower timeframe bar.
High: Uses the highest price of each lower timeframe bar.
Low: Uses the lowest price of each lower timeframe bar.
Close: Uses the closing price of each lower timeframe bar.
OHLC/4: Averages the Open, High, Low, and Close prices.
HL/2: Averages the High and Low prices.
Typical Price: (High + Low + Close) / 3
Weighted Close: (High + Low + 2 × Close) / 4
Default Value: Close
Purpose: Offers flexibility in how the average price is calculated, allowing traders to choose the price metric that best fits their analysis style.
🕒 Lower Timeframe Selection
Description: Specifies the lower timeframe from which data is fetched for granular VWAP calculations.
Customization:
Input: Lower Timeframe for Granular Data
Default Value: 1 minute ("1")
Options: Any valid TradingView timeframe (e.g., "1", "3", "5", "15", etc.)
Purpose: Enables traders to select the granularity of data used in the VWAP calculation, enhancing the indicator's precision on higher timeframe charts.
🎨 VWAP Line Customization
Description: Adjusts the visual appearance of the VWAP line based on price position relative to the VWAP.
Customizations:
Color When Price is Above VWAP:
Input: VWAP Color (Price Above)
Default Value: Green
Color When Price is Below VWAP:
Input: VWAP Color (Price Below)
Default Value: Red
Line Thickness:
Input: VWAP Line Thickness
Default Value: 2
Range: Minimum of 1
Line Style:
Input: VWAP Line Style
Options: Solid, Dashed, Dotted
Default Value: Solid
Purpose: Enhances visual clarity, allowing traders to quickly assess price positions relative to the VWAP through color coding and line styling.
🔔 Alerts and Notifications
Description: Provides real-time notifications when the price crosses the VWAP.
Customizations:
Enable/Disable Alerts:
Input: Enable Alerts for Price Crossing VWAP
Default Value: Enabled (true)
Alert Conditions:
Price Crossing Above VWAP:
Trigger: When the closing price crosses from below to above the VWAP.
Alert Message: "Price has crossed above the Granular VWAP."
Price Crossing Below VWAP:
Trigger: When the closing price crosses from above to below the VWAP.
Alert Message: "Price has crossed below the Granular VWAP."
Purpose: Keeps traders informed of significant price movements relative to the VWAP, facilitating timely trading decisions.
📊 Plotting and Visualization
Description: Displays the calculated Granular VWAP on the chart with user-defined styling.
Customization Options:
Color, Thickness, and Style: As defined in the VWAP Line Customization section.
Track Price Feature:
Parameter: trackprice=true
Function: Ensures that the VWAP line remains visible even when the price moves far from the VWAP.
Purpose: Provides a clear and persistent visual reference of the VWAP on the chart, aiding in trend analysis and support/resistance identification.
⚙️ Performance Optimizations
Description: Ensures the indicator runs efficiently, especially on higher timeframes with large datasets.
Strategies Implemented:
Minimized Security Calls: Utilizes two separate request.security calls to fetch necessary data, balancing functionality and performance.
Efficient Calculations: Employs built-in functions like ta.sum for rolling calculations to reduce computational load.
Conditional Processing: Alerts are processed only when enabled, preventing unnecessary computations.
Purpose: Maintains smooth chart performance and responsiveness, even when using lower timeframe data for granular calculations.
