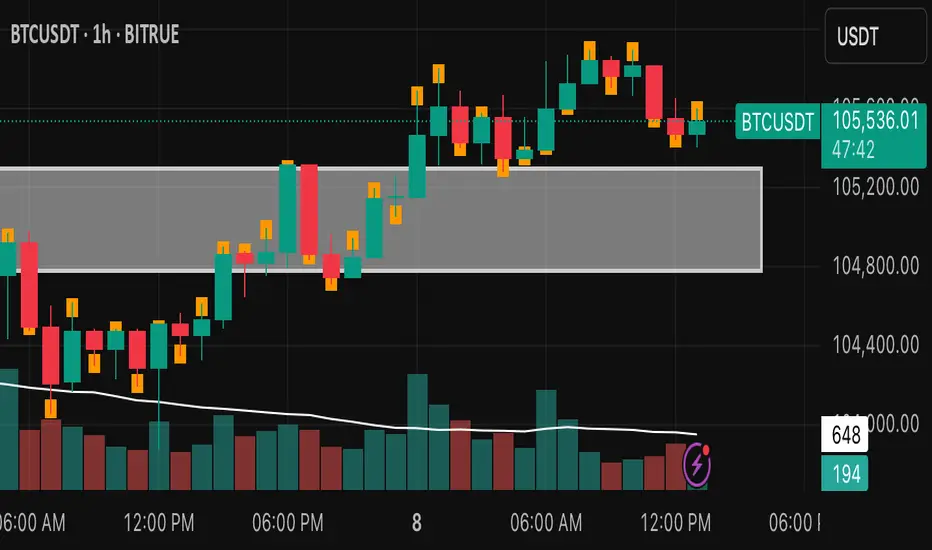
Candle Close Location MarkerThis script customizes the appearance of candlesticks by highlighting whether the candle closed in the upper, middle, or lower part of its range — using a small orange marker inside each candle.
It also includes a traditional volume histogram with two simple moving averages (SMA 20 and SMA 50), helping traders detect volume trends and potential reversals.
📌 Useful for identifying strength of momentum and visualizing market sentiment clearly.
Features:
• ✅ Colored candles: green for bullish, black for bearish
• ✅ Orange square shows the position of the close (top, middle, or bottom of the candle)
• ✅ Volume bars with SMA 20 (orange) and SMA 50 (blue)
• ✅ Works on all timeframes
Developed by:
Version: 1.0
Language: Pine Script v5
In den Scripts nach "VOLUME BAR" suchen
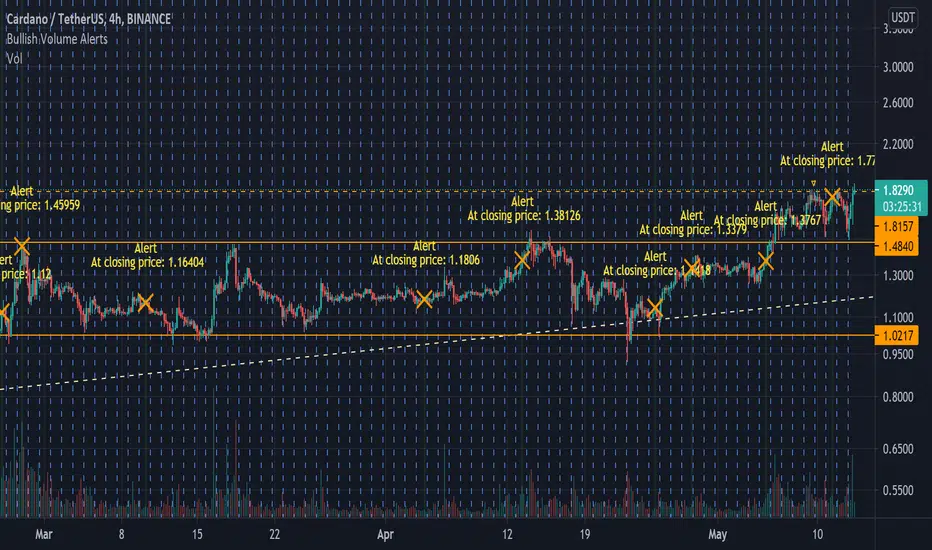
Bullish Volume [Alerts]A really simple script I made for someone, but also noticed I couldn't find anything like it that's as quick or simple (I may just be dumb)
Simply labels out and alerts you when three consequently higher volume bars appear, pretty useless on its own but for crypto, it works great to quickly notice if some important fundamentals suddenly cause the price to rocket. It works best with hour timeframes. Personally I'd use it with 4h.
I find it useful to know if something in a market is stirring attention and hope others can find it useful.
Volume Moving AveragesVolume Moving Averages that I find more useful than volume bars, personally.
Default settings:
* Fast line = 3 day lookback
* Slow line = 10 day lookback
Enjoy.

AlAlawi ~ Volume Confidence BreakoutThis is a Volume statistical mean and Lognormal deviation
This indicator shows X amount of Volume bars Lognormal Mean and Standard Deviation, then applies your confidence level.
Just hit like to keep getting free indicators!

Relative Volume Bars / Moving AverageThis indicator is highly experimental and settings are meant to be adapted to your time frame and asset of choice.
This indicator is a moving average that focuses on relative volume instead of all volume. It only factors in prices of candles that are meeting your relative volume input.
The multipliers can be used to smooth your average towards buy side or sell side or keep them the same.
I have also added in averages for buy side only and sell side only, these are highly experimental and turned off by default. Feel free to play with them.
This indicator is free to all Oasis Trading Group Members.
For Access or Questions Please Private Message Us, Thank you.

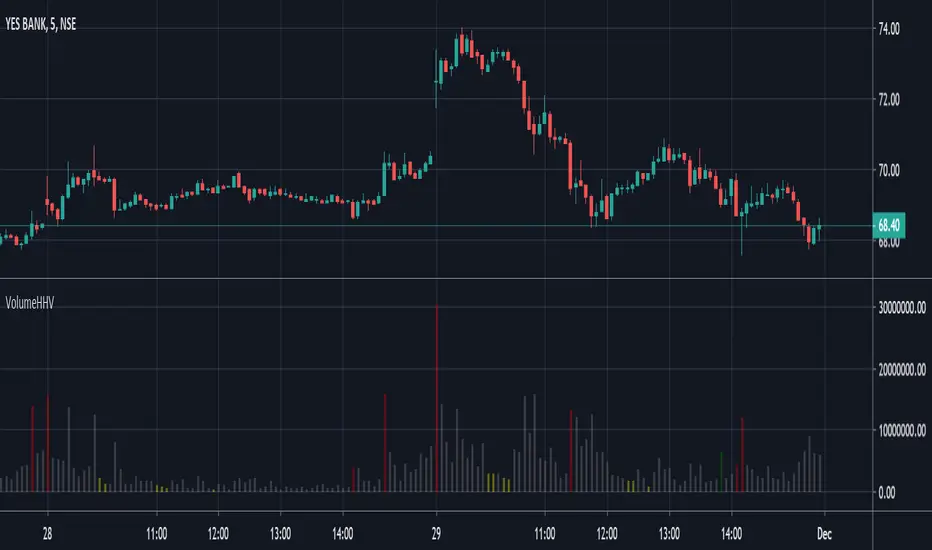
Volume_HHVVolume variation comparison : to detect High and Low of highest volume or lowest volume Bar in a Range
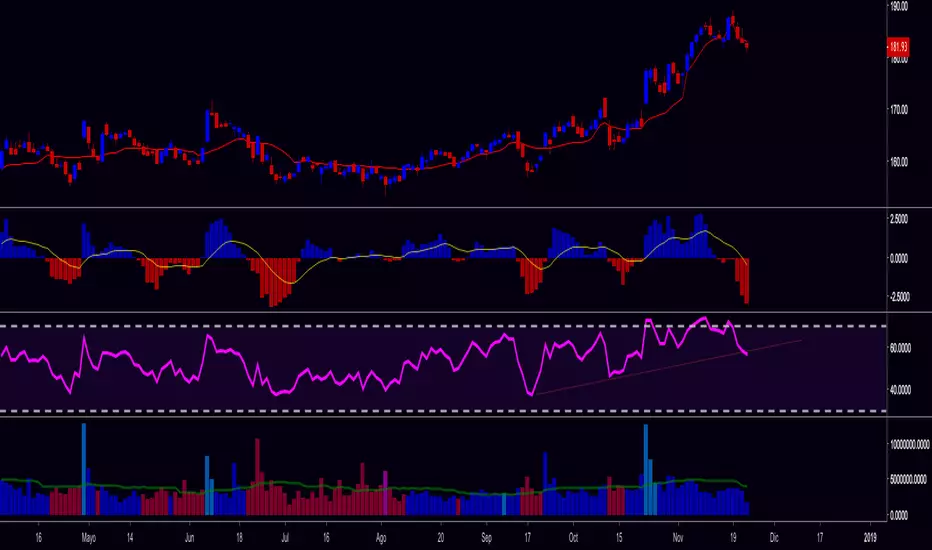
Volume Zone OscillatorCopy Pasta from Investopedia
Interpretation
The VZO points to a positive trend when it rises above and maintains the 5% level, and a negative trend when it falls below the 5% level and fails to turn higher. Oscillations between the 5% and 40% levels mark a bullish trend zone, while oscillations between -40% and 5% mark a bearish trend zone. Meanwhile, readings above 40% signal an overbought condition, while readings above 60% signal an extremely overbought condition. Alternatively, readings below -40% indicate an oversold condition, which becomes extremely oversold below -60%.
The indicator panel shows horizontal lines that correspond with relative percentage levels that trigger buy and sell signals when crossed:
BUY OR COVER SIGNAL - cross from below to above the -40% line.
SELL OR SELL SHORT SIGNAL - cross from above to below the 40% line.
LESSER BUY OR COVER SIGNAL – cross from below to above the 5% line, but any subsequent violation adds a 7.5% buffer zone before the next buy signal.
A 14-period average directional index (ADX) can be used with the VZO, with values greater than 18 pointing to a trending market. A 60-period exponential moving average (EMA) is examined when ADX signals a trend, with price crossing above the moving average denoting a positive trend, while a downward crossover points to a bearish trend. These values should be tweaked and optimized by backtesting specific securities.
Price pattern and other indicators can be examined to confirm VZO buy or sell signals. Volume bars common on most price charts provides useful information in this regard, adding to signal reliability when bullish and bearish crosses align with two times or greater average volume. In addition, look for OBV to tick higher when the VZO has pushed above 50% and lower when it falls below that level. (For more, see: How to Use Volume to Improve Your Trading.)
And there are better uses for this Indicator than the above description ;)
happy trading

Tommy Buy and Sell Pressure v1.0Cheers everyone. I've decided to share my Buy and Sell Pressure volume indicator with you all. It has issues with scaling the volume chart onto your graph so you will have to manually scale it. There is also an issue that bugs me with the volume bars not being scaled to the very bottom of the Price Data Window. If you know ways to fix this or ways upon improving my indicator please let me know. At the moment Pine has very limited functionalities so I have no way around it at the time.
Also make sure to follow me on TradingView for updates. :) And click that like button if this indicator is useful!


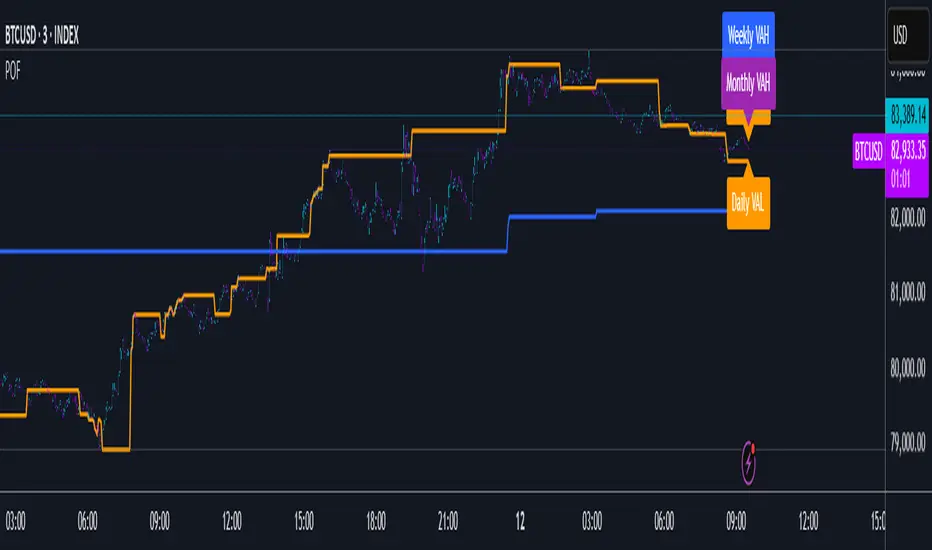
POF🔶 Smoothed POF Profile – Multi-Session Market Structure Tool 🔶
The Smoothed POF Profile is a precision-engineered market structure indicator that identifies the Point of Focus (POF) — the price level where market participation was most active — across Daily, Weekly, and Monthly sessions and plots them with smoothed over form to avoid whipsaws.
🔍 Powered by a custom-built algorithm for session profiling, this tool highlights:
🔶 POF: The most frequently traded or accepted price during a session
🟩 VAH / VAL: Dynamic Value Area High and Low markers (no cluttered lines — clean label-only display)
📐 The core logic utilizes a proprietary data refinement method that adapts to session volatility and filters out insignificant noise to avoid false shifts in structure. This results in smoothed POF readings that remain stable and meaningful — even during high-volatility periods.
🧠 Designed for traders who want to track evolving value, this tool provides a high-level view of where the market is finding agreement — and where price is likely to revert or expand from.
✅ Key Features:
Fully automated: Tracks Daily, Weekly, and Monthly sessions in real-time
Session-aware calculation of key structure levels
Elegant, non-obtrusive chart visuals (no histogram or volume bars)
Fully configurable Value Area % and display toggles
Multi-session color-coding (🟧 Daily, 🔵 Weekly, 🟣 Monthly)
🧭 Trading Applications:
POF Bias: Use POF as an evolving balance point. Price above = bullish lean, price below = bearish tilt
VAH/VAL Zones: Anticipate rejection or consolidation when price re-enters the value area. Use breakouts for continuation bias
Session Stack Confluence: When Daily, Weekly, and Monthly POFs cluster, it often signals strong interest zones and potential turning points
🧩 Use alongside your preferred price action, volume, or trend confirmation tools. This is not a signal-based system — it’s a contextual framework to help you align with market intent and structure.
⚠️ Disclaimer: This tool is intended for educational and informational purposes only. It is not financial advice. Use with proper risk management and your own due diligence.
[BUBBLENUKE] BOB The Reversal Trader Indicator=============================================================: BOB The Reversal Trader :=============================================================
COMPONENTS:
- VWAP Anchored at Friday CME close
- Bitcoin CME close
- Volume bars
DESCRIPTION:
BOB is a mean-reversion trading system focused in BTCUSDT asset in the 30M time frame. The system is divided into 2 types of entries:
WEEKENDS:
BOB will trigger his entry when the price of Bitcoin is at one of the two deviations from the VWAP anchored at Friday CME close
INTRA-WEEK:
BOB will trigger its entry when the price of Bitcoin is at one of the two deviations from the VWAP anchored at the Friday CME close or when a volume candle indicates a reversal

[BUBBLENUKE] BOB The Reversal Trader=============================================================: BOB The Reversal Trader :=============================================================
COMPONENTS:
- VWAP Anchored at Friday CME close
- Bitcoin CME close
- Volume bars
SETTINGS:
- Asset: BTCUSDTPERP
- Time frame: 30M
- Hard TP %: 1.5
- Hard SL %: 40
- Trading Session Start (UTC): 4
- Trading Session End (UTC): 17
DESCRIPTION:
BOB is a mean-reversion trading system focused in BTCUSDT asset in the 30M time frame. The system is divided into 2 types of entries:
WEEKENDS:
BOB will trigger his entry when the price of Bitcoin is at one of the two deviations from the VWAP anchored at Friday CME close and BOB will take your profits when the price returns to the VWAP. When BOB hits Sunday and the CME reopens, BOB will close all your open positions.
INTRA-WEEK:
BOB will trigger its entry when the price of Bitcoin is at one of the two deviations from the VWAP anchored at the Friday CME close or when a volume candle indicates a reversal. BOB will take your profits when the price returns to the VWAP or when the HARD TP % is reached (1.5% by default). When BOB hits Friday and the CME closes, BOB will close all your open positions.

Tick ChartHello All,
Tick Chart is created using ticks and each candlestick in Tick Chart shows the price variation of X consecutive ticks ( X : Number of Ticks Per Candle ). for example if you set Number of Ticks Per Candle = 100 then each candlestick is created using 100 ticks. so, Tick Charts are NOT time-based charts (like Renko or Point & Figure Charts). Tick is the price change in minimum time interval defined in the platform. There are several advantages of Tick Charts. You can find many articles about Tick Charts on the net.
Tick Chart only works on realtime bars.
You can set " Number of Ticks Per Candle " and " Number of Candles" using options. You can change color of body, wicks abd volume bars as well.
The script shows current, minimum, maximum and average volumes. it also shows OHLC values on the last candle.
Tick Chart using different number of ticks
Volume info:
Enjoy!

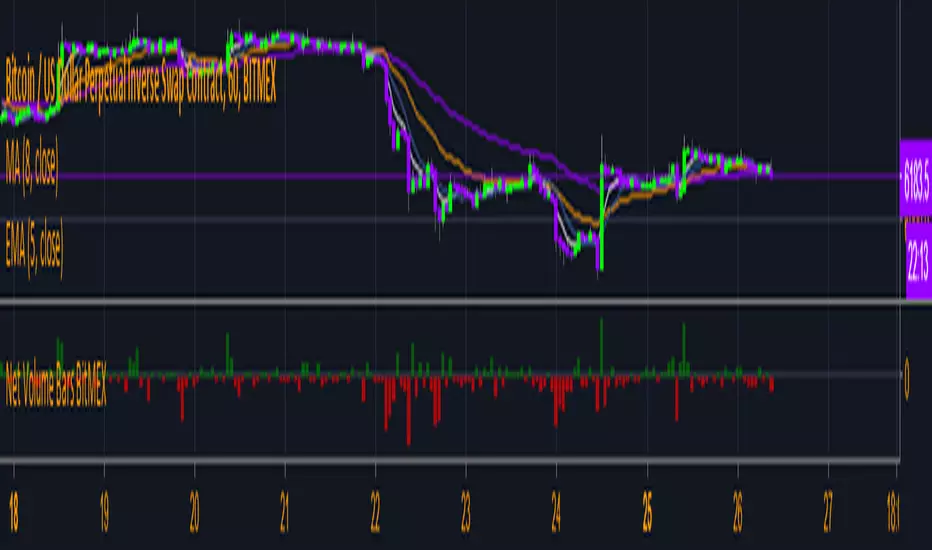
Volume BalanceThe indicator colors the volume bars in two colors to display the Bullish and Bearish power.
There is two option of the indicator view. The first is the classic one. And the second is to show the Bullish and Bearish power separately.

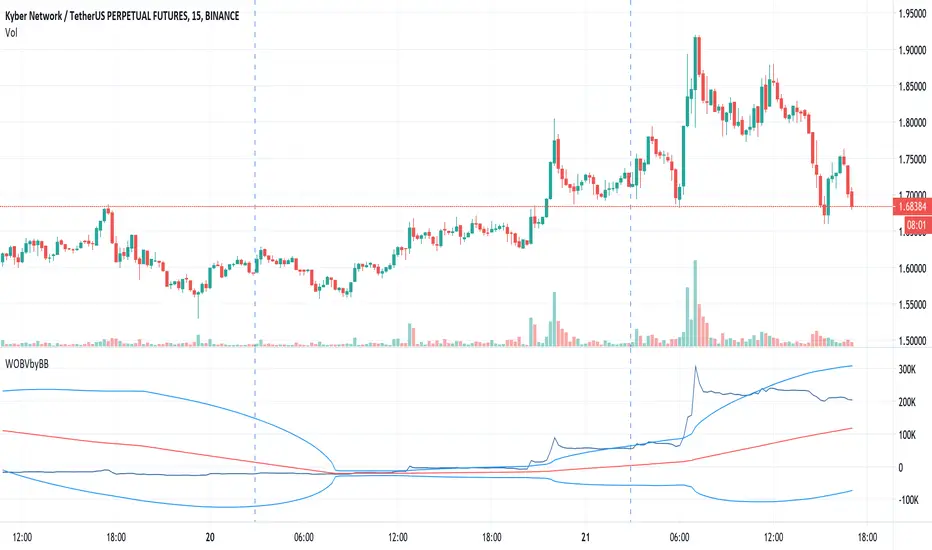
Weighted OBV by BB Original from www.tradingview.com I just added BB
Cumulative Force Indicator. Can also be seen as an OBV indicator that takes the price differences into account. In a regular OBV, a high volume bar can make a huge difference, even if the price went up only 0.01, and it it goes down 0.01 instead, that volume makes the OBV go down big time, even though in both cases hardly anything really happened. cForce is a more realistic view on where the money is flowing.
Volume Moving Average - evoThis script shows regular volume bars with two separate moving averages using only bullish and only bearish candles. The moving average uses the last known value of its calculation.
Using the Heikin Ashi function will smooth the colors and moving averages (good for trends):
The crossovers are a good way to see what the dominant direction of a trend is, if you test them on your time frame and instrument they might be good to trade on their own, I have not tested this and the default settings are not tuned for that.
As always, let me know if you like it or found a good way to use it :)

[nv]BB Volume Colored v2This indicator only change the volume bars colors based in custom Bolling Band Indicator
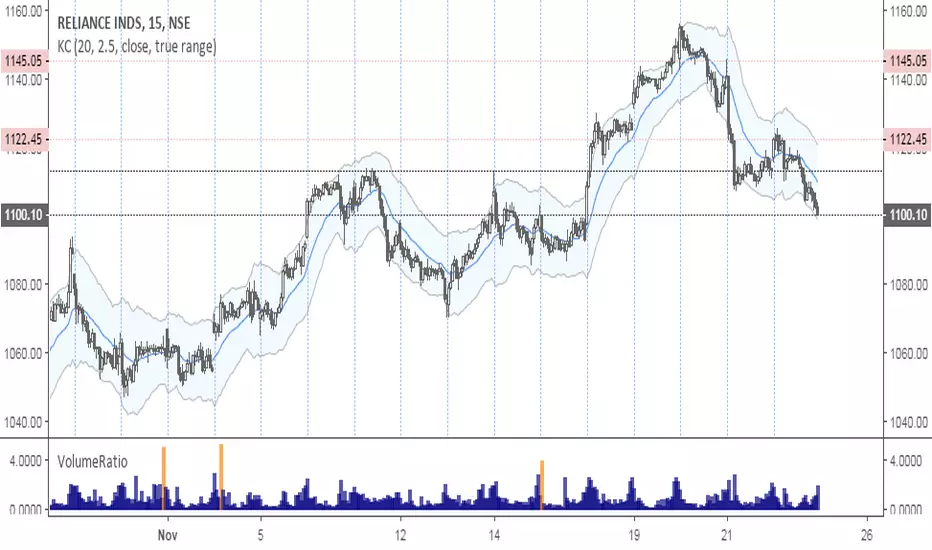
VolumeRatioVolumeRatio plots the high volume bar when volume is 3 times greater than average 36 day volume.
VolumeBars in FiatSimple volume bars indicator for cryptocurrencies that shows their respective volume in fiat.


Cumulative Force, Weighted OBVCumulative Force Indicator. Can also be seen as an OBV indicator that takes the price differences into account. In a regular OBV, a high volume bar can make a huge difference, even if the price went up only 0.01, and it it goes down 0.01 instead, that volume makes the OBV go down big time, even though in both cases hardly anything really happened. cForce is a more realistic view on where the money is flowing.
This is my first published script, so feel free to let me know if you see room for improvements.

CODEX OB + BBMA V1CODEX OB + BBMA is a multi-purpose Smart Money Concepts (SMC) indicator that automatically detects and visualizes key institutional trading elements such as Order Blocks, Fair Value Gaps, Rejection Blocks, Break of Structure, Pivots, High Volume Bars, and several qualitative SMC signals.
In addition to SMC tools, this indicator also incorporates multi-timeframe BBMA logic, allowing traders to view higher-timeframe momentum, trend direction, and volatility envelopes directly from the current chart. This makes it easier to align SMC setups—like OB, FVG, and BOS—with BBMA structure such as MA touches, re-entry zones, extreme candles, and volatility expansions.
This combination helps traders identify institutional footprints, multi-timeframe confluence, and displacement-based setups with high clarity.
