[GM PRO] Better VolumeKnowing when to trade vs when not to trade is one of the most valuable skills you will acquire as a trader. This Script displays the volume bars as an Oscillator, with a "dynamic" center-line rather than a static line.
When the volume bars are above the dynamic center line, consider taking entries. When below, market tends to be flat or slow moving and choppy.
Volume EXTREMES are highlighted with glowing "Orbs" along the dynamic center line.
In den Scripts nach "VOLUME BAR" suchen

TGFA Flexible Alerts Multi-MA CrossoversTGFA Flexible Alerts, Multi-MA Crossovers
Description
Flexible MA crossovers with BUY/SELL alerts, customizable candle colors, and an info box for ATR/volatility insights. Supports EMA/SMA/HMA/VWAP on any chart.
Overview
TGFA Flexible Alerts is a versatile Pine Script indicator for traders seeking customizable moving average (MA) crossovers, visual signals, and quick-reference metrics. It overlays crossover lines (e.g., fast EMA over slow SMA), generates BUY/SELL labels and alerts, colors candles based on themes, and includes an optional info box with ATR bands, support/resistance, and trend projections. Built for any symbol and timeframe (optimized for 1H intraday), it auto-detects Heikin Ashi charts and handles mixed MA types like responsive HMA with lagging EMAs. All logic uses built-in TA functions for reliability—no repainting on confirmed bars.
Key Features
MA Crossover Engine: Configurable lines (EMA, SMA, HMA, VWAP) with dynamic colors (HMA tints green/red based on slope). Enable/disable via inputs.
Invert Signals Toggle: Flips BUY/SELL logic for mixed MA setups (e.g., HMA as fast line over EMA).
Reasoning: Traditional crossovers assume a fast line (low lag) crossing above a slow line (high lag) for buys. HMA's hull design makes it ultra-responsive, so it may "lead" too aggressively—causing premature signals. Inverting aligns it with user intuition (e.g., HMA dipping below then recovering signals strength), reducing false positives in trending markets. Test on your pairs!
Visual Alerts: BUY/SELL labels at crossover price (with optional price display and offset adjustment).
Single MA Overlays: Independent plots for EMA/SMA/HMA/VWAP (length 0 to hide).
Info Box: Real-time table with current price, ±1/2 ATR bands, median price (over lookback), trend (SMA50 slope), volatility % (ATR normalized), support/resistance (recent highs/lows), and reversal projections (tied to SMA50 pivot for up/down bias).
Candle Coloring: 20+ themes (dark/light canvases) for bull/bear/reversal/low-volume bars—e.g., Emerald Blaze greens uptrends, dims on low vol. Toggle off for no changes.
Chart Source Flexibility: Auto-switches to Heikin Ashi if detected; manual override for Regular/HA.
Alerts fire on crossovers/crossunders (custom messages with ticker/interval). Open-source for forking.
How to Use
Add to Chart: Search in TradingView's public library, apply to any symbol (e.g., stocks, forex). Best on 1H for intraday, but works on daily/weekly too.
Setup Crossovers: Choose Line 1/2 types/lengths (e.g., HMA 9 over SMA 20). Enable "Invert Signals" if using HMA—prevents lag mismatches in volatile assets.
Alerts & Labels: Toggle labels for visuals; set TradingView alerts on "Buy"/"Sell" conditions. Use offset for crowded charts.
Info Box Insights: Enable for quick scans—e.g., enter long near support if trend is bullish and price > median. Adjust ATR length (default 14) for sensitivity.
Candle Themes: Pick a scheme (e.g., Neon Pulse for dark mode); it overrides bar colors without altering data.
Customization Tip: For HMA-heavy setups, invert + short lengths (5-9) catch turns early; pair with volume filter in alerts.
Limitations & Disclaimers - Designed for overlay on price charts; may overlap in tight ranges—adjust transparency via styles.
HMA can repaint intra-bar; signals confirm on close. Not back tested for all assets—validate with strategy tester.
Info box projections use SMA(50) as a trend pivot (same for up/down as reference); customize via code for advanced calcs. Candle colors are cosmetic only.
This is an analysis tool, not advice. Trading involves risk; combine with fundamentals/news. Past performance isn't indicative of future results. No liability for losses.
I'm still a newbie, so feedback encouraged!
Thank you!!
ThisGirl

buy sell ultra systemWhat it is
EMA-POC Momentum System Ultra combines a proven trend stack (EMA 20/50/238), a price-of-control layer (POC via Bar-POC or VWAP alternative), and a momentum trigger (RSI) to surface higher-quality entries only when multiple, independent conditions align. This is not a cosmetic mashup; each component gates the others.
How components work together
Trend (EMA 20/50/238): Defines short/medium/long bias and filters counter-trend signals.
POC (Bar-POC or Alt-POC/VWAP): Locates the most-traded/weighted price area; a neutral band around POC helps avoid chop.
Control background: Above POC → buyers likely in control; below → sellers.
Momentum (RSI): Entry arrows print only when RSI confirms with trend and price location vs POC; optional “cross 50” requirement reduces noise.
Optional HTF trend: Confluence with a higher-timeframe EMA stack for stricter filtering.
Why it’s original/useful
Signals require confluence of (1) EMA trend stack, (2) POC location and neutral-zone filtering, (3) momentum confirmation, (4) optional slope and distance-to-POC checks, and (5) optional HTF trend. This reduces false positives compared with using any layer in isolation.
How to use
Markets/TFs: Built for XAUUSD (Gold) and US30. Works 1m–1h for intraday; 2h–4h for swing.
Entries:
Long: EMA stack bullish, price above POC, not in neutral band, RSI condition true → “Buy” arrow.
Short: Opposite conditions → “Sell” arrow.
Stops/Targets (suggested):
Initial stop beyond POC/neutral band or recent swing.
First target around 1R; trail with EMA20/50 or structure breaks.
Settings to tune:
POC Mode: Bar-POC (highest-volume bar’s close over lookback) or Alt-POC (VWAP).
Neutral Band %: 0.10–0.35 typical intraday.
Min distance from POC: 0.10–0.50% helps avoid low-RR entries right at POC.
RSI: Choose “cross 50” for stricter triggers or simple >/< 50 for more signals.
HTF trend: Turn on for extra confluence.
Alerts:
Buy Signal and Sell Signal (separate), or one Combined Buy/Sell alert.
Set to “Once per bar close” if you want only confirmed arrows.
Repainting / limitations
Shapes can move until bar close (standard Pine behavior) when using intrabar conditions; final confirmation at close. No system guarantees profitability—forward test and adapt to your market/instrument.
Clean chart
The published chart contains only this script so outputs are easy to identify.
Versions / updates
Use Publish → Update for minor changes; do not create new publications for small tweaks. If you fork to preserve older behavior, explain why and how your fork differs.
Changelog
v1.1 – Tuning for Gold/US30, neutral-band & distance filters, optional HTF trend, combined alert.
v1.0 – Initial public release (EMA stack + POC modes + RSI + alerts).
License & credits
Open-source for learning and improvement. Please credit on forks and explain modifications in your description.

Volume Candle Color (Continuous)Volume-Based Candle Color Indicator (Continuous Gradient)
Overview
Transform your charts with this advanced volume visualization tool that colors candles based on relative volume intensity using a smooth, continuous gradient . Unlike traditional step-based volume indicators, this script provides nuanced color transitions that make volume anomalies instantly visible.
Key Features
Continuous Color Gradient
Smooth transitions - No more discrete color steps
High volume = Bright, opaque colors that demand attention
Low volume = Faded, transparent colors that blend into background
Real-time adaptation to market conditions
Full Customization Control
Volume Range Settings: Define min/max volume ratios for optimal sensitivity
Transparency Control: Adjust brightness levels from 0-95%
Custom Colors: Choose your preferred bullish/bearish base colors
Moving Average Period: Customize the volume comparison timeframe (default: 30)
Enhanced Visualization
Optional Info Panel: Real-time display of volume metrics
Volume Ratio Plot: Additional pane showing volume ratio trends
Clean Interface: Non-intrusive overlay that enhances price action
How It Works
The indicator calculates relative volume by comparing current volume to a Simple Moving Average (SMA) of volume over your chosen period. This ratio is then mapped to a continuous color scale:
Volume Ratio > 2.0: Maximum intensity (brightest colors)
Volume Ratio 1.0: Average volume (medium intensity)
Volume Ratio < 0.5: Below average (most transparent)
Bullish Candles (Close > Open): Green gradient
Bearish Candles (Close < Open): Red gradient
Trading Applications
Volume Spread Analysis (VSA)
Perfect companion for VSA traders who need to quickly identify:
Climactic volume at key support/resistance levels
No demand situations with low volume
Professional money accumulation/distribution patterns
Breakout Confirmation
High volume breakouts: Immediately visible with bright colors
False breakouts: Revealed by low volume (faded colors)
Volume divergences: Spotted instantly through color intensity changes
Market Structure Analysis
Support/Resistance tests: Volume validation through color brightness
Trend strength: Continuous color feedback on volume participation
Market phases: Easy identification of accumulation vs distribution
Why Choose This Indicator?
Advantages Over Traditional Volume Indicators:
Instant Visual Feedback: No need to look at separate volume bars
Continuous Scale: More precise than discrete level systems
Customizable Sensitivity: Adapt to any market or timeframe
Clean Charts: Maintains focus on price action while adding volume context
Universal Application: Works on all instruments and timeframes
Settings Guide
Essential Settings:
Volume MA Period (30): Longer periods = smoother baseline, shorter = more sensitive
Min Volume Ratio (0.2): Lower values = more sensitivity to low volume
Max Volume Ratio (3.0): Higher values = accommodate extreme volume spikes
Transparency Range (10-85%): Adjust visual contrast to your preference
Pro Tips:
Day Trading: Use 10-20 period MA for quick volume changes
Swing Trading: Use 30-50 period MA for broader volume context
Lower transparency range (0-70%) for subtle effects
Higher transparency range (20-90%) for dramatic contrasts
Best Practices
Combine with Price Action: Use volume colors to confirm price patterns
Multiple Timeframes: Apply on different timeframes for comprehensive analysis
Market Context: Adjust sensitivity based on market volatility periods
Backtesting: Test settings on historical data before live trading
Perfect For:
Volume Spread Analysis practitioners
Breakout traders seeking confirmation
Market structure analysts
Anyone wanting cleaner, more intuitive volume visualization
Technical Specifications
Pine Script v6 - Latest version compatibility
Overlay Indicator - Works directly on price charts
Minimal Performance Impact - Optimized calculations
All Market Types - Stocks, Forex, Crypto, Futures
Transform your volume analysis today! Experience the difference continuous color gradients make in identifying high-probability trading opportunities.
Like and follow for more innovative trading tools!
Volume Crisis Created by Alphaomega18
🎯 What is the Crisis Detector Pro?
The Crisis Detector Pro is an advanced multi-component indicator that detects market crisis situations by simultaneously analyzing:
Volume: Anomalies and volume spikes
VIX: Volatility Index (S&P 500)
ATR: True volatility (all assets)
Open Interest: Estimated open interest (futures contracts)
The indicator calculates a Composite Crisis Score (0-100) that combines these elements to alert you to critical market moments.
📊 Indicator Components
1️⃣ Volume Analysis
Anomaly detection: Compares current volume to its moving average
Classification:
🟡 Moderate: 1.5x - 2x average
🟠 High: 2x - 3x average
🔴 Extreme: > 3x average
Bollinger Bands: Detects volume breakouts
Clusters: Identifies 3+ consecutive days of anomalies
2️⃣ VIX (Fear Index)
S&P 500 only
Default thresholds:
🟡 Moderate: VIX > 20
🟠 High: VIX > 30
🔴 Extreme: VIX > 40
3️⃣ ATR (Average True Range)
Measures true volatility
Compatible with all assets (stocks, futures, forex, crypto)
Compares current ATR to its average
4️⃣ Open Interest (OI)
Estimation based on Volume / 2
Detects changes > 25%
Inverted colors:
🔴 Red: OI increase (new positions)
🟢 Green: OI decrease (position closing)
⚙️ Main Parameters
Calculations:
Moving Average Period: 20 (default)
Standard Deviation Period: 20
ATR Period: 14
Volume Thresholds:
Moderate: 1.5x
High: 2.0x
Extreme: 3.0x
Composite Score (Weights):
Volume: 35%
VIX: 25%
ATR: 20%
Open Interest: 20%
📈 Visual Signals
Top of Chart:
🟡 Yellow triangle: Moderate alert (Score 50-70)
🟠 Orange triangle: High alert (Score 70-85)
🔴 Red triangle: EXTREME CRISIS (Score 85-100)
⚠️ Purple cross: Reinforced signal (Volume + Volatility simultaneous)
Bottom of Chart:
💎 Purple diamond: 50-day volume record
⬛ Fuchsia square: Cluster (3+ abnormal days)
Volume Bars:
Gray: Normal volume
🟡 Yellow: Moderate volume
🟠 Orange: High volume
🔴 Red: Extreme volume
Open Interest Curve:
🔵 Blue: Normal variation
🔴 Red: Increase > 25%
🟢 Green: Decrease > 25%
🎯 How to Use the Indicator
1. Initial Setup
For S&P 500 / US Indices:
Enable VIX ✅
Enable ATR ✅
Enable OI ✅
Composite Score ✅
For Other Assets (Forex, Crypto, Stocks):
Disable VIX ❌
Enable ATR ✅
Enable OI (optional)
Composite Score ✅
2. Crisis Score Interpretation
ScoreLevelMeaningAction0-50Normal ✅Calm marketNormal trading50-70Vigilance 🟡Volatility risingIncreased monitoring70-85Danger 🟠Critical situationReduce exposure85-100Crisis 🔴MAXIMUM ALERTCapital protection
3. Trading Strategies
Directional Trading:
Reinforced signal ⚠️ = Powerful move in progress
Enter in direction of movement with confirmation
Tight stops, quick targets
Risk Management:
Score > 70 → Reduce position size by 50%
Score > 85 → Stop trading or ultra-short positions
Cluster detected → Avoid new trades
Scalping/Day Trading:
Extreme volume 🔴 = Scalping opportunities
Wait for confirmation before entering
Exit quickly on spikes
Swing Trading:
Avoid opening swings during crises
Protect existing positions (trailing stops)
Wait for return to normal (Score < 50)
4. Open Interest (Futures):
OI Increase (🔴 Red):
New positions opened
Strong market conviction
Movement may intensify
OI Decrease (🟢 Green):
Position closing
Profit-taking or stop losses
Possible reversal
🔔 Configurable Alerts
The indicator includes 8 types of alerts:
🟡 Moderate Crisis Alert: Score 50-70
🟠 HIGH Crisis ALERT: Score 70-85
🔴 MAJOR CRISIS: Score 85-100
⚠️ REINFORCED SIGNAL: Extreme Volume + Volatility simultaneous
💎 RECORD Volume: Highest volume over 50 days
📊 Cluster DETECTED: 3+ consecutive abnormal days
📈 OI SPIKE >25%: Sharp Open Interest increase
📉 OI DECLINE >25%: Sharp Open Interest decrease
Setup: Right-click on chart → "Add Alert" → Select alert
💡 Optimization Tips
Scalping (1-5min):
MA Period: 10-15
Moderate Threshold: 1.3x
High Threshold: 1.8x
Volume Weight: 50%
Day Trading (15min-1H):
MA Period: 20 (default)
Thresholds: Default
Composite Score: Enabled
Swing Trading (4H-Daily):
MA Period: 30-50
StdDev Multiplier: 2.5
ATR Period: 20
Volatile Markets (Crypto):
Moderate Threshold: 1.8x
High Threshold: 2.5x
Extreme Threshold: 4.0x
ATR Weight: 30%
📊 Statistics Table
The real-time table displays:
Crisis Score: 0-100 with color coding
Current volume: Value and ratio
Volume Score: Contribution to total score
Open Interest: Estimated value and % change
VIX: Current value (if enabled)
ATR: Ratio to average
Global STATUS: Normal ✅ / Vigilance 🟡 / Danger 🟠 / Crisis 🔴
⚠️ Warnings and Limitations
❌ Limitations:
Open Interest is estimated (Volume / 2), not real value
VIX only works for S&P 500
False signals possible in very volatile markets
✅ Best Practices:
Always combine with classic technical analysis
Never trade solely on alerts
Adapt thresholds to your asset and timeframe
Backtest before using live
Respect your risk management plan
🎓 Real Use Cases
Example 1: Flash Crash
Extreme volume 🔴 + Extreme ATR 🔴 + Reinforced signal ⚠️
Composite score > 90
Action: No new trades, protect existing positions
Example 2: Fed Announcement
VIX > 35 + Moderate volume 🟡 + OI rising 🔴
Composite score: 65
Action: Reduce position size, widen stops
Example 3: Volatility Squeeze
Cluster detected + Volume record 💎 + OI declining 🟢
Action: Scalping opportunity in breakout direction
📈 Performance
Real-time detection (0 lag)
Compatible all markets and timeframes
Low resource consumption
Complete history preserved

9 EMA Retracement Buy/Sell + Volume FilterFor all you scalpers out there this is a 9 ema scalp Indicator coupled with volume bars, the Indicator plots buy and sell when the conditions are met
Price mist be above or below the 9 ema it must retrace and the volume bar must match the direction of the candle and then a signal will be printed with a red or green triangle, do not blindly take all trades on the signals make sure the is a trend works on any asset and remember it is for scalping only

Volume Bubbles 📊 Volume Bubbles Pro — Visualize Candle Volumes as Elegant Bubbles
Tired of squinting at volume bars below your chart?
Introducing Volume Bubbles Pro — a sleek, intuitive indicator that displays each candle’s trading volume as transparent colored bubbles directly on your price chart. No more switching tabs — critical volume data is now right where you need it!
✨ Key Features:
🔹 Smart Volume Classification:
Each bubble’s size reflects the strength of volume:
→ Tiny — Below average
→ Normal — Above average
→ Large — Exceptionally high (fully customizable)
🔹 Flexible Bubble Placement:
Choose to display bubbles under, over, or centered on candles — tailor it to your workflow.
🔹 Two Color Schemes:
→ Single Color — Minimalist, clean look for distraction-free charts
→ Volume-Based Gradient — Tiny = Blue, Normal = Orange, Large = Red
🔹 Optional Info Panel:
Displays real-time thresholds for “medium” and “large” volume levels directly on your chart.
🔹 Interactive Tooltips:
Hover over any bubble to see exact volume value, average volume, and volume-to-average ratio.
🔹 Built-in Alerts:
Get notified instantly when a candle registers abnormally high volume — perfect for catching breakouts or reversals.
⚙️ Fully Customizable Settings:
Average Volume Period — baseline for comparison (default: 50)
Medium Volume Multiplier — threshold to classify volume as “medium”
Large Volume Multiplier — threshold to classify volume as “strong”
Transparency — adjust opacity so bubbles enhance, not clutter
Bubble Position — under, over, or centered on candles
Color Scheme — match your chart style or strategy needs
💡 How to Use It?
Spot Key Moments: Large red bubbles often signal breakout starts, reversals, or liquidity tests.
Confirm Signals: Strong volume under a candle validates signals from other indicators.
Filter Noise: Ignore tiny bubbles — low activity means low conviction.
Scan History: Instantly identify past high-volume events across any timeframe or asset.
✅ Why Traders Love It:
✔️ Clean, uncluttered visuals — only what matters
✔️ Works on all assets & timeframes — stocks, crypto, forex, futures
✔️ Fully customizable — make it yours
✔️ Perfect for scalpers, day traders, and swing traders alike
📌 Created by:
“Volume is money voting. Let it speak to you through bubbles.”
📌 Add this tool to your arsenal — and never miss a significant volume pulse again!
💡 Pro Tip: Enable alerts to get notified about unusual volume spikes — even when you’re away from your charts.

Heatmap Volume# Heatmap Volume (HeatVol) Indicator
A sophisticated volume analysis tool that visualizes trading volume intensity through a dynamic heatmap system. This indicator helps traders identify significant volume patterns and potential market turning points by comparing current volume to historical averages.
## Key Features
1. **Dynamic Volume Analysis**
- Moving average based volume comparison
- Standard deviation based threshold calculation
- Multiple volume intensity levels (Extra High, High, Medium, Normal, Low)
- Customizable lookback periods for both MA and Standard Deviation
2. **Visual Representation**
- Heatmap color coding for volume intensity
- Optional colored volume bars
- Multiple display modes (Lines, Backgrounds, Both, None)
- Two color schemes (Heatmap or Up/Down)
3. **Flexible Configuration**
- Adjustable threshold multipliers for each intensity level
- Customizable colors for all volume levels
- Separate color settings for bullish and bearish volumes
- Transparent overlays for clear price action visibility
4. **Alert System**
- Volume threshold breach notifications
- Direction-specific alerts (Up/Down)
- Multiple alert conditions for different volume levels
## Trading Applications
1. **Volume Analysis**
- Identify unusual volume spikes
- Detect volume divergences
- Monitor volume trend changes
- Spot potential accumulation/distribution
2. **Market Psychology**
- Gauge market participation levels
- Identify potential exhaustion points
- Confirm price movements with volume
3. **Trade Validation**
- Confirm breakouts with volume
- Validate trend strength
- Identify potential false moves
## Setup Guide
1. **Period Settings**
- Adjust MA length (default: 610) based on your timeframe
- Set Standard Deviation period for volatility sensitivity
- Fine-tune threshold multipliers for market conditions
2. **Visual Configuration**
- Choose between Heatmap or Up/Down color modes
- Select display style (Lines, Backgrounds, Both)
- Customize colors for different volume levels
## Best Practices
1. Use longer periods for trend analysis, shorter for day trading
2. Combine with price action for better trade decisions
3. Pay attention to color transitions for volume trend changes
4. Use alerts to catch significant volume events
## Notes
1. Higher threshold multipliers mean more selective volume signals
2. Color intensity reflects volume significance
3. Background mode provides better overall volume trend visibility
4. Line mode helps identify specific volume thresholds
This indicator is particularly useful for traders who rely on volume analysis for their trading decisions. It provides a clear visual representation of volume intensity and helps identify potentially significant market moves through volume analysis.
Volume v3 by Koenigsegg🔹 Overview
The Custom Volume Indicator is designed for traders who prefer to view volume in a dedicated sub-window below the price chart, similar to RSI or MACD. Unlike TradingView’s built-in volume indicator, which overlays directly on the main chart, this version provides a cleaner layout by displaying volume in a separate panel.
🔹 Why Use This Indicator?
While TradingView provides a default volume indicator, this version is built for traders who prefer a separate volume panel for improved clarity and focus. Key differences:
✅ Dedicated Lower Panel Display – Unlike the default volume indicator, this version is displayed in a standalone sub-window, keeping the price chart clear.
✅ Better Chart Visibility – Helps traders separate volume analysis from price action, making trend confirmation easier.
🔹 Features
✅ Displays volume in a separate panel below the price chart for a clearer trading view.
✅ Custom color-coded volume bars for bullish volume and bearish volume.
✅ Optional Volume Moving Average (MA) for tracking volume trends.
✅ Optional Smoothed Volume Moving Average (MA) for tracking volume trends
✅ Sound Alerts on Volume Spikes, Drops and more – Get notified of significant changes in volume.
✅ Built-in Alert Sound Options – Choose from different TradingView notification sounds.
✅ Customizable settings:
- Toggle the MA on/off as needed.
- Adjust the MA length (default: 20).
- Set alert thresholds for high or low volume warnings.
📊 How to Use
- Identify high-volume breakouts and low-volume consolidations.
- Use the Volume Moving Average to confirm trends and market participation.
- Spot bullish/bearish volume surges to strengthen trade decisions.
⚠️ Disclaimer
This indicator is for educational and informational purposes only. It does not provide financial advice or trade signals. Always conduct your own research before making any trading decisions.

Volume v2 by Koenigsegg📌 Custom Volume Indicator (Separate Panel with original Alerts & Built-in Sounds)
🔹 Overview
The Custom Volume Indicator is designed for traders who prefer to view volume in a dedicated sub-window below the price chart, similar to RSI or MACD. Unlike TradingView’s built-in volume indicator, which overlays directly on the main chart, this version provides a cleaner layout by displaying volume in a separate panel.
🔹 Why Use This Indicator?
While TradingView provides a default volume indicator, this version is built for traders who prefer a separate volume panel for improved clarity and focus. Key differences:
✅ Dedicated Lower Panel Display – Unlike the default volume indicator, this version is displayed in a standalone sub-window, keeping the price chart clear.
✅ Better Chart Visibility – Helps traders separate volume analysis from price action, making trend confirmation easier.
🔹 Features
✅ Displays volume in a separate panel below the price chart for a clearer trading view.
✅ Custom color-coded volume bars for bullish volume and bearish volume.
✅ Optional Volume Moving Average (MA) for tracking volume trends.
✅ Sound Alerts on Volume Spikes, Drops and more – Get notified of significant changes in volume.
✅ Built-in Alert Sound Options – Choose from different TradingView notification sounds.
✅ Customizable settings:
- Toggle the MA on/off as needed.
- Adjust the MA length (default: 20).
- Set alert thresholds for high or low volume warnings.
📊 How to Use
- Identify high-volume breakouts and low-volume consolidations.
- Use the Volume Moving Average to confirm trends and market participation.
- Spot bullish/bearish volume surges to strengthen trade decisions.
⚠️ Disclaimer
This indicator is for educational and informational purposes only. It does not provide financial advice or trade signals. Always conduct your own research before making any trading decisions.

RunRox - Signals MasterSignals Master - meticulously crafted by RunRox, is a versatile tool engineered to accommodate traders of all experience levels. This indicator does not merely suggest potential entry and exit signals; it can seamlessly integrate into your existing trade strategy, enhancing decision-making with its comprehensive features.
With an array of functionalities, Signals Master stands out as a robust standalone product. It is designed to cater to diverse trading approaches, offering real-time signal detection that allows traders to respond swiftly to market fluctuations.
The true power of Signals Master lies in its ability to simplify complex market data into actionable insights. Whether used as a primary indicator or as a complement to your strategy, it helps clarify the trading path ahead, empowering you with confidence in every trade you make.
Core Features of Signals Master
Real-time buy and sell signal alerts
Adjustable sensitivity for tailored signal precision
Customizable alert settings for efficient strategy execution
Advanced backtesting system for strategy optimization
Multiple take profit and stop loss options
Detailed dashboard display for strategy monitoring and adjustments
Support and resistance level identification
Trend lines and color-coded volume bars for easy trend following
Candlestick pattern recognition to anticipate market moves
In the image below, you can see our indicator at work and the explanations.
On the chart, you see buy and sell signals, as well as potential trade exits. The "X" mark can also be interpreted as a trend reversal and a potential signal for a trend change. But always stick to your own exit strategy!
Autopilot \ Optimization
One of the standout features of our Signals Master indicator is its auto-optimization and autopilot capabilities. This function automatically identifies the best settings for specific charts and timeframes, ideal for novice traders.
The autopilot feature simplifies the trading process by continuously adjusting settings to optimize your strategy under varying market conditions. This allows for a more efficient trading experience, focusing on strategy effectiveness rather than constant configuration adjustments.
Signal Mode
The Signal Mode functionality of our Signals Master indicator optimizes signals specifically for either buying or selling, tailoring the best settings to enhance one-directional trading. This feature is particularly useful for traders who prefer to focus exclusively on asset purchases. By optimizing for a single direction, Signal Mode ensures that traders can maximize their strategic approach and efficiency in the markets where they feel most confident. This targeted optimization helps to streamline decision-making processes and improve overall trading precision.
Additional Features
Reversal Zones: This feature identifies potential reversal points in the market, helping traders to spot opportunities where trends might change direction. By marking these zones, traders can anticipate market turns with greater accuracy.
Trend Assistant: Streamline your trend analysis with the Trend Assistant, which highlights ongoing trends and their strength. This tool aids in confirming the trend’s stability, making it easier to decide on entry or exit points.
Neo Cloud: Enhance your market analysis with Neo Cloud, which provides a dynamic visualization of support and resistance levels. This feature helps traders understand the current market state, indicating bullish or bearish conditions.
Candlestick Patterns Detection: Quickly identify key candlestick patterns that signal potential market moves. This detection tool simplifies the complexity of candlestick analysis, allowing for swift, informed trading decisions based on traditional charting techniques.
Volume Candlestick
Enhance your market reading with RunRox’s color-coded volume bars that gauge the strength of buying or selling within each bar. This intuitive feature adds a layer of depth to your analysis, allowing for quick recognition of vital market movements and informed trading decisions.
RISK DISCLAIMER
It is crucial for traders to recognize that while indicators are powerful tools, they should serve as aids rather than definitive solutions. No indicator, including those provided by RunRox, can offer a 100% win rate or replace the need for personal judgment and comprehensive analysis. Our goal is to equip traders with sophisticated instruments that can enhance their understanding and evaluation of market conditions.
We encourage all users of RunRox indicators to utilize them as supplements to their own trading strategies and analyses. The ultimate responsibility for trade decisions lies with the trader, informed by their own knowledge, risk assessment, and market research. Our indicators are designed to support this decision-making process, not to dictate it.

High Volume AlertThe High Volume Alert Script is developed for all traders focusing on volume analysis in their trading strategies, providing alerts for unusually high trading volumes during specified trading sessions.
Functionality:
Volume Moving Average Calculation:
Average Volume = Moving Average(Volume) = Sum of last the x last candles Volume
Where n is the user-defined period for the moving average calculation (denoted as movingaverageinput in the script. This moving average serves as the baseline to compare current volume levels against historical averages.
High Volume Detection:
HighVolume = CurrentVolume >= (MA(Volume) x HighVolumeRatio)
Here, HighVolumeRatio is a user-defined multiplier that sets the threshold for what is considered high volume. If the current volume exceeds this threshold (the product of the moving average of volume and the HighVolumeRatio ), the script identifies this as a high-volume event.
Session Filtering:
The script further refines these alerts by ensuring they only trigger during the specified trading session, enhancing relevance for traders interested in specific market hours. This session is defined by the sess and timezone parameters.
Visualisation and Alerts:
If high volume is detected (HighVolume = True), the script colors the volume bar with the highVolumeColor . If the option is selected, it also changes the color of the candlestick to either highVolumeCandleColorUp (for bullish candles) or highVolumeCandleColorDown (for bearish candles), depending on the price movement within the high-volume period. An alert is generated through the alertcondition function when high volume is detected during the specified session, notifying the trader of potentially significant market activity.
Application in Trading:
This indicator serves traders who prioritize volume as a leading indicator of potential price movement. High trading volumes may indicate the presence of significant market activity, often associated with events like news releases, market openings, or large trades, which can precede price movements.
Originality and Practicality:
This script is self-developed, aiming to fill the gap in automatic ratio adjusted volume alerts within the TradingView environment.
Conclusion:
The High Volume Alert Script is an essential tool for traders who integrate volume analysis into their strategy, offering tailored alerts and visual cues for high volume periods.
Compliance and Limitations:
The script complies with TradingView scripting standards, ensuring no lookahead bias and maintaining real-time data integrity. However, its utility depends on the availability on volume data, and please be aware that forex pairs never offer real volume data, this tool is best used with a exchange traded symbol.
Traders Reality PVSRA Volume SuitePVSRA volume bars color coded to PVSRA vector candles and with override option and configurable moving average.
Indicator displays volume bars color coded to PVRSA price action and allows the user to override the chart symbol.
Developed for TradersReality by infernixx with library conversion by peshocore.
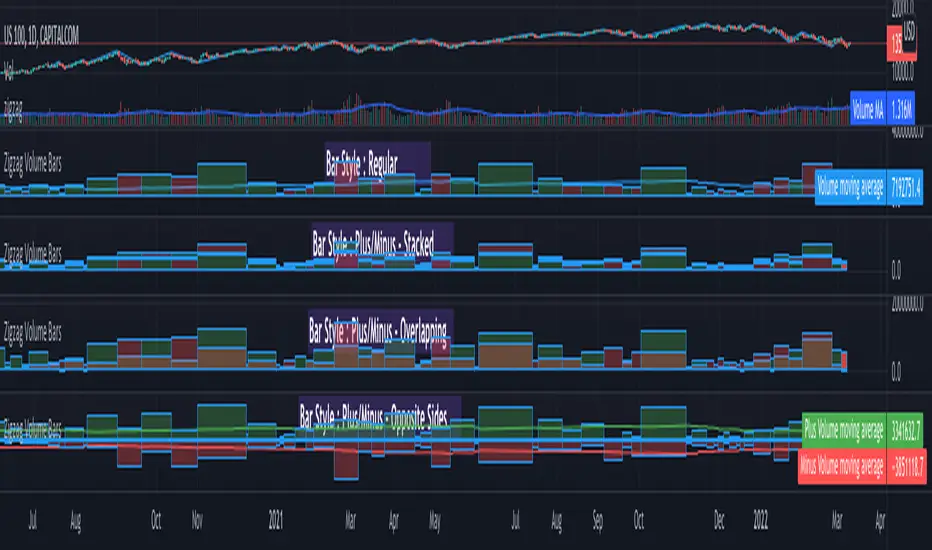
Zigzag Volume BarsBack to my favourite topic - Zigzags.
Here is an indicator which can help you visualise volume data on Zigzag swing highs and lows.
Settings are pretty simple and provides variety of display options
Display options are as demonstrated in the chart has following main types.
Regular
Plus/Minus - Stacked
Plus/Minus - Overlapping
Plus/Minus - Opposite Sides
Apart from the main display types, stacked display has several sub-types which determine whether to place green bar below red or the other way around.
Snapshot below shows example of each type.
Ranged Volume - evoA simple script that shows mirrored regular volume bars with the purpose to show break-outs and low volume ranges, using highest and lowest of a few bars back.
Use Heikin Ashi function to smooth the colors with the trend.

Support and Resistance [Jamshid]📌 Support & Resistance
This indicator automatically identifies high-quality Support and Resistance zones using volume-weighted pivot levels. It visualizes price structure with adaptive volume boxes, breakout & retest signals, higher timeframe confirmation, and optional volume profile.
✅ Core Features
🔹 1. Smart Support & Resistance Zones (Volume-Based)
Detects pivot highs/lows with strong volume.
Boxes expand dynamically using ATR.
Zones display actual volume value.
Color intensity reflects volume strength.
🔹 2. Breakouts & Retests
“Break Sup / Break Res” labels on structure breaks.
Detects when old resistance becomes support (R→S).
Detects when old support becomes resistance (S→R).
Retest labels and diamond markers for holds.
🔹 3. Volume Profile (Optional)
Shows mini horizontal volume bars at each zone.
Separate bullish/bearish volume distribution.
Adjustable rows and lookback.
🔹 4. Higher Timeframe Confluence (Optional)
Check if current S/R aligns with HTF levels:
5m, 15m, 30m, 1H, 4H, Daily
Modes:
✅ Show All + HTF Labels
✅ Filter Only HTF Confirmed Levels
HTF confirmations shown directly on zone labels.
Tolerance setting for price matching.
🔹 5. Breaker Blocks (Failed S/R Reversal Zones)
Identifies bullish/bearish breaker zones.
Highlights breaker blocks on chart.
Optional labels and zone coloring.
🎯 Visual Alerts & Signals
✅ Breakouts (Support & Resistance)
✅ Retests (Hold without breakout)
✅ Role Reversal (R→S and S→R)
✅ Potential Bullish / Bearish Breakers
✅ Diamonds for hold/retest structure
✅ Labels with volume + timeframe confirmations
Every signal also has a built-in alertcondition so you can automate notifications.
⚙️ Customizable Settings
🟢 Main
Lookback period
Volume filter length
Box width multiplier
🎨 Visual
Show or hide labels, diamonds, retest labels
Label size
🟦 Breaker Blocks
Enable/disable breaker blocks
Show zones & labels
Custom colors
📊 Volume Profile
Enable/disable
Rows, lookback length
Bull/Bear color
⏳ Higher Timeframe Filtering
Turn HTF logic on/off
Select which timeframes to compare
Filter mode or label mode
Price matching tolerance (%)
✅ Why this indicator is unique
✔ Combines price structure + volume + HTF confluence
✔ Automatically adapts S/R strength using volume data
✔ Shows role reversal and breaker logic
✔ Smart visual alerts & automation support
✔ Highly customizable for any strategy or timeframe
💡 How to Use
Add the indicator to any chart or timeframe.
Look for high-volume S/R zones (darker colors = stronger).
Watch for:
Breakouts (trend continuation or reversal)
Retests (strong confirmations)
HTF confluence (higher probability)
Breaker blocks (failed level reversal)
Optionally enable alerts for automation or notifications.
******************************************************************
⚠️ Dangers of Trading
1️⃣ You can lose money very fast
Markets move quickly, and leverage makes losses even faster. Even experienced traders go through drawdowns.
2️⃣ Emotional decisions ruin accounts
Fear (selling too early) and greed (holding too long or overtrading) cause most losses. Trading is more psychological than technical.
3️⃣ Overconfidence after small wins
Many traders win at the beginning and believe they “mastered” the market, then take big risks and blow the account.
4️⃣ No system = gambling
If you trade without clear rules and risk management, you’re not trading—you’re gambling.
5️⃣ Market is not fair
Smart money, institutions, HFT algorithms, and stop-hunts exist. Retail traders are often the liquidity for bigger players.
6️⃣ News/Unexpected events
Unpredictable events (CPI, FOMC, war, tweets, etc.) can instantly move the market against your position.
✅ Advice for Safer & Smarter Trading
✅ 1. Protect your capital first
Your number one job is to survive.
Never risk more than 1–2% per trade.
✅ 2. Have a written trading plan
Define:
When to enter
When to exit
How much to risk
What conditions must be present
If your plan is not written, you don’t have a plan.
✅ 3. Use Stop Loss always
No stop loss = account suicide.
Even professional traders are wrong sometimes.
✅ 4. Focus on one strategy (mastery > trying everything)
Jumping from one strategy to another causes confusion. One good strategy with discipline beats five strategies with no consistency.
✅ 5. Trade with the trend and higher timeframe direction
Trading against HTF structure is fighting the market.
✅ 6. Control emotions like a machine
Biggest trader enemies:
Overtrading
Revenge trading
Fear of missing out (FOMO)
When emotions are strong → stop trading.
✅ 7. Be patient (best skill of a trader)
Sometimes the best trade is no trade.
Professional traders wait for high-probability setups.
✅ 8. Backtest and demo before using real money
If it doesn’t make money in backtesting or demo, it won’t magically work live.
✅ 9. Accept losses (they are part of the game)
Even the best traders lose. The key is small losses, big wins.
✅ 10. Keep learning forever
Market changes. What works today may not work tomorrow. Study price action, volume, psychology, risk management.
🧠 Final Truths:
✅ Trading is a business, not easy money
✅ Winning rate doesn’t matter—risk/reward matters
✅ Consistency > luck
✅ Discipline > knowledge
✅ Survival > profit

Breakout Volume
指标名称:Breakout Volume (BrkVol)
功能:本指标用于识别成交量异常放大,同时结合价格新高,帮助交易者发现潜在突破机会。
主要特性:
可调成交量均线周期(MA Length)
可调放量倍数(Volume Multiplier)
可调价格新高周期(Lookback High Length)
成交量柱颜色区分:绿色=阳线放量,红色=阴线放量,灰色=无信号
蓝色均量阈值线,可直观比较放量情况
出现成交量突破 + 新高时,图表上显示绿色三角形标记
支持提醒功能,可在条件触发时收到通知
使用建议:
调整参数以适应不同品种和时间周期
可结合趋势、支撑阻力位使用,避免假信号
适合快速发现短线或中长线突破机会
English Description
Name: Breakout Volume (BrkVol)
Function: This indicator detects unusual volume spikes combined with new highs in price, helping traders identify potential breakout opportunities.
Key Features:
Adjustable moving average period (MA Length) for volume
Adjustable volume multiplier (Volume Multiplier)
Adjustable lookback period for price highs (Lookback High Length)
Color-coded volume bars: Green = bullish candle with volume breakout, Red = bearish candle with volume breakout, Gray = normal volume
Blue threshold line (volume MA × multiplier) for easy comparison
Green triangle marker appears when both volume breakout and new high conditions are met
Supports alerts for real-time notifications
Usage Tips:
Adjust parameters to suit different symbols and timeframes
Combine with trend or support/resistance levels to reduce false signals
Useful for spotting short-term or medium/long-term breakout opportunities

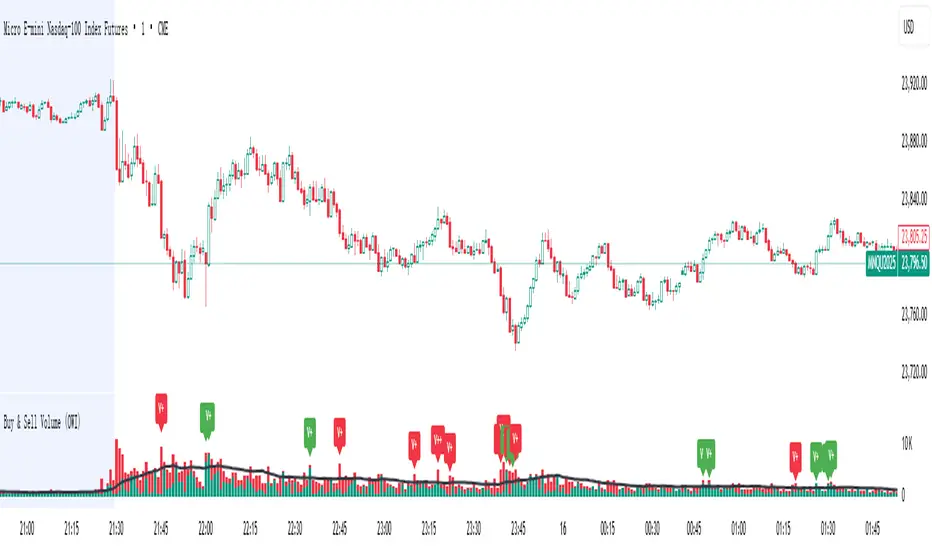
Buy & Sell Volume (OWI)📊 Buy & Sell Volume (OWI) Indicator Guide
The Buy & Sell Volume (OWI) indicator is designed to provide a visual breakdown of buying and selling pressure in each candle, helping traders identify volume surges and potential market moves. It also includes a time filter to focus analysis during key trading hours.
⚙️ Setup & Inputs
When adding the indicator to your chart, you'll see several configurable inputs:
SMA Length : Sets the period for the Simple Moving Average (SMA) of total volume.
Enable Time Filter : Toggles whether to restrict analysis to US market hours (Eastern Time). |
Start Hour/Minute : Defines the beginning of the time filter window (default: 9:45 ET). |
End Hour/Minute : Defines the end of the time filter window (default: 16:15 ET). |
📈 How It Works
🔍 Volume Breakdown
Buy Volume: Estimated volume attributed to buyers, calculated based on candle position.
Sell Volume: Estimated volume attributed to sellers.
Total Volume SMA: A moving average of total volume to benchmark current activity.
⏰ Time Filter (Optional)
When enabled, the indicator only highlights volume spikes during the specified US market hours. This helps filter out noise from pre-market or after-hours trading.
🚨 Highlight Conditions
The indicator flags significant volume spikes with labels above the volume bars:
| Label | Condition |
| V+ | Volume is between 1.5× and 2× the SMA, during market hours (if enabled). |
| V++ | Volume exceeds 2× the SMA, during market hours (if enabled). |
💡 Tips
- Use shorter SMA lengths for more reactive volume analysis.
- Change the time filter if you're trading outside US market hours.
- Combine with candlestick patttern to confirm breakout or reversal signals.
Volume Intelligence Suite (VIS) v2📊 Volume Intelligence Suite – Smart Volume, Smart Trading
The Volume Intelligence Suite is a powerful, all-in-one TradingView indicator designed to give traders deeper insight into market activity by visualizing volume behavior with price action context. Whether you're a scalper, day trader, or swing trader, this tool helps uncover hidden momentum, institutional activity, and potential reversals with precision.
🔍 Key Features:
Dynamic Volume Zones – Highlights high and low volume areas to spot accumulation/distribution ranges.
Volume Spikes Detector – Automatically marks abnormal volume bars signaling potential breakout or trap setups.
Smart Delta Highlighting – Compares bullish vs bearish volume in real time to reveal buyer/seller strength shifts.
Session-Based Volume Profiling – Breaks volume into key trading sessions (e.g., London, New York) for clearer context.
Volume Heatmap Overlay – Optional heatmap to show intensity and velocity of volume flow per candle.
Custom Alerts – Built-in alerts for volume surges, divergences, and exhaustion signals.
Optimized for Kill Zone Analysis – Pairs perfectly with ICT-style session strategies and Waqar Asim’s trading methods.
🧠 Why Use Volume Intelligence?
Most traders overlook the story behind each candle. Volume Intelligence Suite helps you "see the why behind the move" — exposing key areas of interest where smart money may be active. Instead of reacting late, this tool puts you in position to anticipate.
Use it to:
Validate breakouts
Detect fakeouts and liquidity grabs
Confirm bias during kill zones
Analyze volume divergence with price swings
⚙️ Fully Customizable:
From volume thresholds to visual styles and session timings, everything is user-adjustable to fit your market, timeframe, and strategy.
✅ Best For:
ICT/Smart Money Concepts (SMC) traders
Breakout & reversal traders
Kill zone session scalpers
Institutional footprint followers

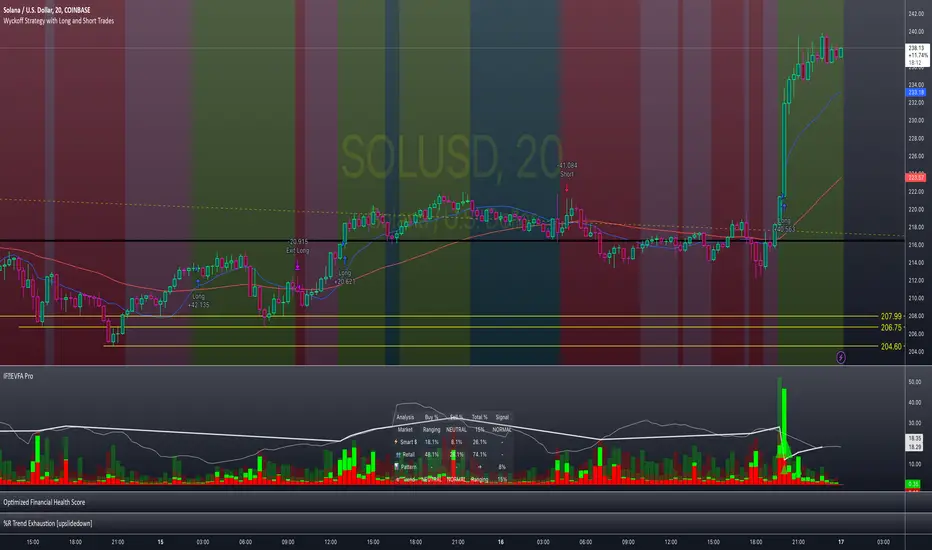
Enhanced Volume Flow Analysis Pro ♾️ IFEnhanced Volume Flow Analysis Pro (EVFA Pro)
A Comprehensive Guide to Understanding and Using Volume Flow Analysis
Introduction
The Enhanced Volume Flow Analysis Pro (EVFA Pro) represents a sophisticated approach to understanding market dynamics through the lens of volume analysis. This advanced technical indicator has been designed to peel back the layers of market activity, revealing the intricate dance between institutional and retail traders. By combining volume analysis, participant behavior patterns, and market condition recognition, EVFA Pro provides traders with a deeper understanding of market movements and potential opportunities.
Understanding the Core Framework
At its heart, EVFA Pro works by analyzing and categorizing trading volume based on several key characteristics. The indicator examines not just the raw volume, but also the context in which that volume occurs. It considers factors such as price movement, historical patterns, and market conditions to classify trading activity as either institutional or retail in nature.
The framework adapts dynamically to different market environments. Whether you're trading stocks, ETFs, cryptocurrencies, or commodities, the indicator automatically adjusts its parameters to match the typical behavior patterns of each asset class. This adaptability extends to different trading styles as well, with optimizations for everything from quick-paced scalping to longer-term position trading.
Market Participant Analysis
One of the most powerful aspects of EVFA Pro is its ability to distinguish between institutional and retail trading activity. The indicator accomplishes this through a sophisticated analysis of volume patterns, order flow, and price action. Institutional trading typically leaves distinct footprints in the market - large, well-organized volume patterns that often occur at strategic price levels. EVFA Pro identifies these patterns and separates them from the more scattered, emotion-driven patterns typical of retail trading.
The indicator maintains a constant watch on participation rates from both groups. When institutional participation rises above normal levels, it could signal the beginning of a significant move. Similarly, spikes in retail activity, especially when combined with certain price patterns, might indicate potential market turning points.
Reading Market Conditions
Market conditions are not static, and EVFA Pro recognizes this fundamental truth. The indicator continuously evaluates market conditions, classifying them into four main categories: normal, volatile, ranging, and trending. This classification isn't merely descriptive - it directly influences how the indicator interprets various patterns and signals.
In volatile markets, the indicator becomes more conservative in its pattern recognition, requiring stronger confirmation before signaling potential opportunities. During ranging periods, it adjusts to look for shorter-term movements and potential breakout scenarios. In trending markets, the focus shifts to finding continuation patterns and potential exhaustion points.
Pattern Recognition and Signal Generation
Pattern recognition in EVFA Pro goes beyond simple technical patterns. The indicator looks for complex interactions between volume, price, and participant behavior. It identifies accumulation patterns - periods where institutional buyers are actively building positions, often while keeping price movements relatively subtle to avoid drawing attention. Similarly, it recognizes distribution patterns, where larger players are gradually reducing positions.
Signal generation involves a sophisticated weighing of multiple factors. Volume strength, institutional participation, trend alignment, and price momentum all play roles in determining signal strength. This multi-factor approach helps reduce false signals and provides a more reliable indication of potential market moves.
Visual Analysis Tools
The visual components of EVFA Pro have been carefully designed to present complex information in an intuitive format. The main chart overlay uses color-coded volume bars to show the relative participation of institutional and retail traders. The intensity of these colors varies with volume significance, helping traders quickly identify potentially important market activity.
The information table provides a real-time summary of market conditions, participant activity, and detected patterns. This dashboard-style display allows traders to quickly assess market conditions and potential opportunities without needing to analyze multiple indicators.
Practical Application in Trading
To use EVFA Pro effectively, traders should integrate it into a comprehensive trading strategy. The indicator works best when its signals are considered alongside other forms of analysis and risk management tools. Strong signals from EVFA Pro might suggest potential opportunities, but traders should always consider the broader market context, their own risk tolerance, and their overall trading plan.
The indicator's alerts system can help traders stay informed of potentially significant market developments. However, these alerts should be viewed as starting points for analysis rather than automatic trading signals. Each alert provides specific information about the type of pattern or condition detected, allowing traders to quickly assess whether further investigation is warranted.
Advanced Features and Customization
EVFA Pro offers extensive customization options to suit different trading styles and preferences. Traders can adjust sensitivity levels, color schemes, and display options to match their needs. The indicator also includes special considerations for different trading sessions, allowing for more accurate analysis during pre-market, regular trading hours, and after-hours periods.
Market Application and Interpretation
Success with EVFA Pro comes from understanding not just what it shows, but why it shows what it does. The indicator's patterns and signals reflect real market dynamics - the actions and reactions of different types of traders. By understanding these underlying dynamics, traders can make more informed decisions about market opportunities and risks.
Disclaimer
This indicator and documentation are provided for educational and informational purposes only. Trading in financial markets involves substantial risk of loss and is not suitable for every investor. The analysis provided by the Enhanced Volume Flow Analysis Pro indicator should not be considered as financial advice or a recommendation to make any specific trade or investment. Users of this indicator should understand that:
1. Past performance is not indicative of future results
2. All trading decisions and their outcomes are the responsibility of the individual trader
3. This tool should be used as part of a comprehensive trading strategy that includes proper risk management and due diligence
4. Markets can be highly unpredictable, and no technical analysis tool can guarantee success
Users should carefully consider their investment objectives, level of experience, and risk appetite before using this indicator. It is strongly recommended to consult with a qualified financial advisor before making any investment decisions.
M.Right_Relative Volume and PVT (cc)Hello Traders,
I hope you're all doing well and enjoying your holiday!
Today I am releasing a Relative Volume and Price Volume Trend indicator that will help traders assess current price action based on its volume and trend.
Volume is one of the most important aspects of trading that is often overlooked by new traders. Generally, when the volume is higher than normal, something is happening with said equity. Whether that's selling or buying volume it shows importance.
The higher the volume the higher the interest of traders in the equity, so a sudden increase in volume relative to its average volume (relative volume) can cause an increased probability that the price will move.
Relative volume is very self-explanatory , it’s the volume relative to its average. In this indicator, I use several different average calculations to give the trader a clear picture of where the volume stands and added a few different trends using these averages. One is a modified Price Volume Trend.
PVT or Price Volume Trend is a momentum-based indicator that measures money flow in relation to volume. It is usually used to confirm trends, but can be used as a trading signal; as I’ve created some in here. I didn’t added divergences, but using divergences in PVT is another strong way to use it. PVT tends to mirror the market price movements; hence, confirm trends.
You will find this indicator to be jam packed full of features.
-Fully customizable: colors, shapes, lines, on/off toggles for everything.
-Includes:
---Relative Volume Wave.
---Shadow Waves that can help with trend confirmation.
---Vibrant Relative Price Spike in the forefront.
---Additional Volume Trend on bottom of volume bars
---Stat box: showing the Current, Average, and Relative volume on the current user selected timeframe.
---Signals.
---Alerts: prefilled.
Enjoy!
Please add a thumbs up if you like this and follow the instructions for access.
Leave any other questions in the comments section.
Cheers,
Mike

Auto Price Action - Volume Price and Spread [Mehrok]Auto Price Action - Volume Price and Spread script generates important support and resistance levels basis activity happening in price, volume and candle spread. The basic idea has been taken from concepts of VSA which underlies that weakness appears in uptrend and strength in downtrend. Script will try to find candles which have volume higher then average and candle spread.
Underlying logic:
Script generates significant high's as resistance and lows as support basis activity happened on volume, price and candle spread. Once criteria set in script is met it would then mark that candle with resistance or support line which would act as important price action level later in time.
Usage:
As it records and maintain important high and lows happening on candles till the time new levels are generated therefore generated price levels act as significant support or resistance. Higher the activity in volume, price and spread stronger that price level would act as support or resistance in future.
Settings:
AvgLen- It would allow you to set the SMA settings for volume bars. By default set at 20 means that SMA of 20D volume would be considered in script.
Volume Start Threshold - Default 1.3 - You can change this setting basis stock volatility. This would set the starting point in script to trigger support or resistance levels if volume is equal or higher then the multiplier you have chosen.
Bearish Volume Mult 1, 2 and 3: Set the the levels which can be adjusted to generate x1, x2 or x3 resistance levels which would appear on top of candles.
Bullish Volume Mult 1, 2 and 3: Set the levels which can be adjusted to generate x1, x2, or x3 support levels which would appear at bottom of candles.
Use of bearish and bullish volume mult is to let user define the multiplier value against which current volume bar would be checked. Higher the value means rare it would be.
x1 - Starting level of resistance/support. It would be considered as level 1 of support or resistance which can be broken easily. Happen too often.
x2 - Medium level of resistance/support. It would be considered as level 2 of support or resistance which can give tough fight as price would reach this level. If set as more then 50% of stock volatility of instrument then price would react for sure.
x3 - Strongest level of resistance/support. If set 3 or higher it would be rare to be generated and price may not visit level too often.
Bullish Candle Matrix %: Keep it above 50 to let script check how strong bullish candle is. Strength of candle increase as value increase from 50 towards 100. Keep it at 52 to track maximum bullish candles.
Bearish Candle Matrix %: Keep it below 50 to let script check how strong bearish candle is. Strength of candle increase as value increase from 50 towards 0. Keep it at 47to track maximum bearish candles.
Optional Lines
Optional lines usage no volume activity therefore can generate important price levels basis volume and price only.
Script work on all time frame where volume information is available. In absence of volume information script would only generate optional levels and that too if activated.

Volume–Phase Analyzer ProVolume–Phase Analyzer Pro – Trend & Institutional Volume Phases
This indicator analyzes how volume behaves relative to price movement to detect whether the market is in Accumulation, Markup, Distribution, or Markdown — the same phases institutions track in professional trading.
Unlike regular volume/MA mashups, this tool combines:
• Institutional volume classification (HighVol Up/Down, LowVol, Confused Vol)
• Price–volume efficiency and wick dominance
• Multi-Timeframe directional filters
• Volatility compression signals using Bollinger Width
• Volume mapped directly into the price chart as candles
• Smart signal engine with cooldown (prevents repeated signal spam)
This helps reveal w hen Smart Money is accumulating, pushing trends, unloading positions, or flushing liquidity.
────────────────────────────────────
How It Works
1️⃣ Volume Strength vs Average Volume
Identifies whether a move is backed by genuine buying/selling power.
2️⃣ Wick & Body Analysis
Confirms whether volume produced meaningful directional pressure — not just noise.
3️⃣ Trend Alignment
Fast EMA vs Slow EMA ensures signals align with active trend.
4️⃣ Higher-Timeframe Confirmation
Confirms if current movement agrees with a larger directional bias.
5️⃣ Compression Detection
When price volatility contracts while high-volume bars appear → phase shift often ahead.
────────────────────────────────────
Signals
BUY → Confirmed bullish demand with trend backing
SELL → Confirmed bearish supply taking control
TRAP → Likely stop-hunt or absorption — often before reversal
Signals only appear when multiple institutional conditions align.
A cooldown prevents repetitive signals like BUY-BUY-BUY.
────────────────────────────────────
Background shading helps visually locate these phases.
Markup phase:
• Meaning: Buyers are in control and the market is trending up
• Background color: Light green
Markdown phase:
• Meaning: Sellers are in control and the market is trending down
• Background color: Light red
Accumulation phase:
• Meaning: Smart Money quietly buying near the bottom before an uptrend
• Background color: Teal (blue-green)
Distribution phase:
• Meaning: Smart Money quietly selling near the top before a downtrend
• Background color: Light orange/yellow
Consolidation phase:
• Meaning: Sideways movement with low conviction
• Background color: Very light grey
Transition phase:
• Meaning: Market has not picked a direction yet
• Background color: No shading (clear background)
⸻
Quick Usage Notes
• Best trades are Buy signals during Markup and Sell signals during Markdown
• Accumulation and Distribution often come before reversals
• Consolidation is a low-quality trading zone
────────────────────────────────────
How to Trade It
• Take BUY signals during Markup
• Take SELL signals during Markdown
• Expect reversals near Trap signals, especially when phase is changing
• Avoid over-trading Consolidation zones
• Volume candles below price reveal when momentum is increasing or fading
Best applied on 5m–1H for intraday and swing confirmation.
────────────────────────────────────
Why This Indicator Is Unique
• It uses p rice-volume efficiency , not standard lagging signals
• It detects S mart Money intent , not retail reactions
• It avoids spam signals using an internal cooldown logic
• It gives context, not just entries — via live market-phase analysis
This makes it a multi-purpose tool for trend trading, breakout trading, and reversal anticipation.
────────────────────────────────────
Alerts Included
• Buy/Sell/Trap Signals
• Phase Change Alerts
────────────────────────────────────
This is a free tool and meant for educational use only.
Always use proper risk management.
────────────────────────────────────
