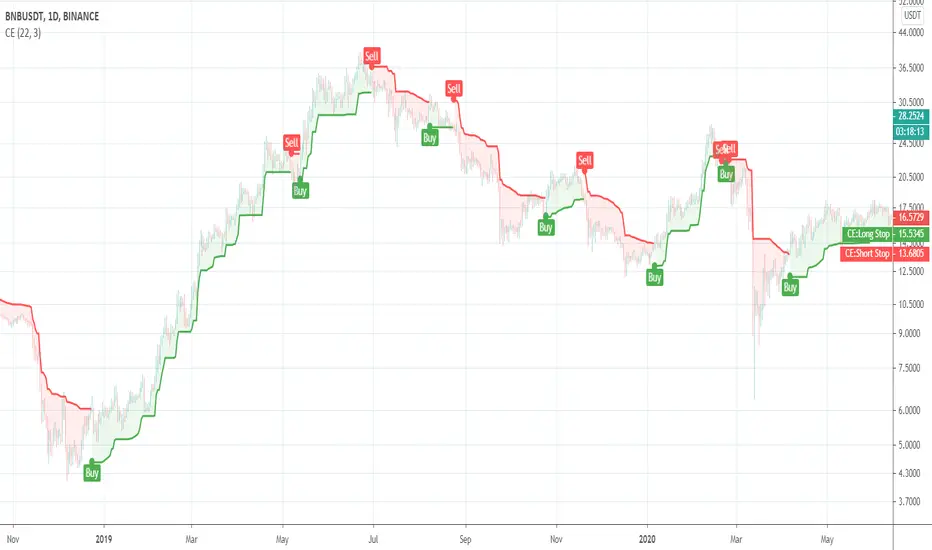
Chandelier ExitThis is a redesign of the Chandelier Exit indicator. It removes stupid transitions between Chandelier Exit' states and highlights initial points for both lines.
This indicator was originally developed by Charles Le Beau and popularized by Dr. Alexander Elder in his book "Come Into My Trading Room: A Complete Guide to Trading" (2002).
In short, this is a trailing stop-loss based on the Average True Range (ATR).
In den Scripts nach "Trailing stop" suchen
Fisher Transform Multi-Timeframe Backtest (No Trailing)This is the Backtester without Trailing Stops
Credits to mortdiggiddy

Chandelier Exit V2 by fr3762 KIVANÇChandelier Exit Version 2 with two lines Long Stop and Short Stop
There is a Chandelier exit for long positions and one for short positions. The Chandelier Exit (long) hangs three ATR values below the 22-period high. This means it rises and falls as the period high and the ATR value changes. The Chandelier Exit for short positions is placed three ATR values above the 22-period low. The spreadsheet examples show sample calculations for both.
According to the theory, traders should exit long positions at either the highest high since entry minus 3 ATRs .
Similarly traders should exit short positions at either the lowest low since entry plus 3 ATRs .
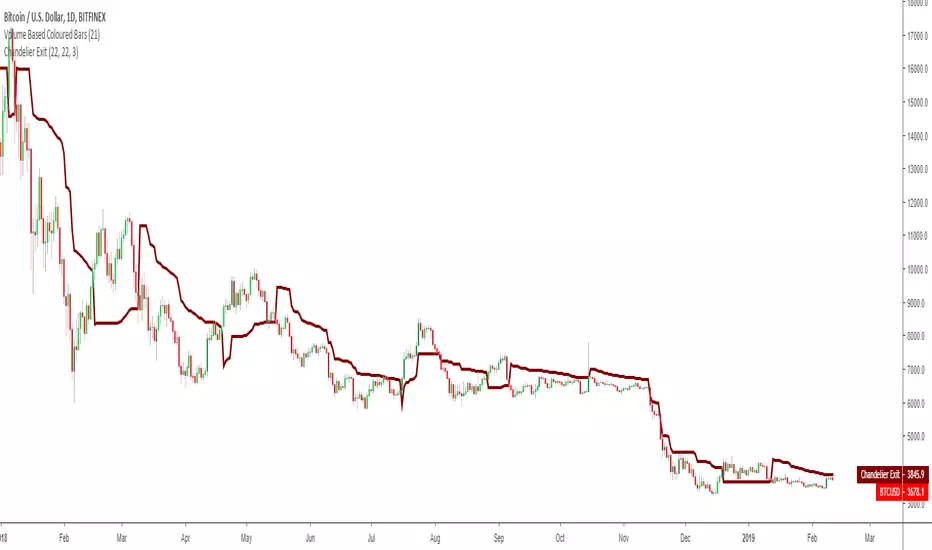
Developed by Charles Le Beau and featured in Alexander Elder's books, the Chandelier Exit sets a trailing stop-loss based on the Average True Range (ATR). The indicator is designed to keep traders in a trend and prevent an early exit as long as the trend extends. Typically, the Chandelier Exit will be above prices during a downtrend and below prices during an uptrend.
The author, Chuck LeBeau explains: It lets "... profits run in the direction of a trend while still offering some protection against any reversal in trend."
The exit stop is placed at a multiple of average true ranges from the highest high or highest close since the entry of the trade.
Chandelier Exit will rise instantly whenever new highs are reached. As the highs get higher the stop moves up but it never moves downward.
The Chandelier Exit is mostly used to set a trailing stop-loss during a trend. Trends sometimes extend further than we anticipate and the Chandelier Exit can help traders ride the trend a little longer. Even though it is mostly used for stop-losses, the Chandelier Exit can also be used as a trend tool. A break above the Chandelier Exit (long) signals strength, while a break below the Chandelier Exit (short) signals weakness. Once a new trend begins, chartists can then use the corresponding Chandelier Exit to help define this trend.
Developer: Charles Le Beau
Here's the link to a complete list of all my indicators:
tr.tradingview.com
Şimdiye kadar paylaştığım indikatörlerin tam listesi için: tr.tradingview.com

Chandelier Exit by fr3762 KIVANÇChandelier Exit
Developed by Charles Le Beau and featured in Alexander Elder's books, the Chandelier Exit sets a trailing stop-loss based on the Average True Range (ATR). The indicator is designed to keep traders in a trend and prevent an early exit as long as the trend extends. Typically, the Chandelier Exit will be above prices during a downtrend and below prices during an uptrend.
The author, Chuck LeBeau explains: It lets "... profits run in the direction of a trend while still offering some protection against any reversal in trend."
According to the theory, traders should exit long positions at either the highest high since entry minus 3 ATRs .
Similarly traders should exit short positions at either the lowest low since entry plus 3 ATRs .
The exit stop is placed at a multiple of average true ranges from the highest high or highest close since the entry of the trade.
Chandelier Exit will rise instantly whenever new highs are reached. As the highs get higher the stop moves up but it never moves downward.
The Chandelier Exit is mostly used to set a trailing stop-loss during a trend. Trends sometimes extend further than we anticipate and the Chandelier Exit can help traders ride the trend a little longer. Even though it is mostly used for stop-losses, the Chandelier Exit can also be used as a trend tool. A break above the Chandelier Exit (long) signals strength, while a break below the Chandelier Exit (short) signals weakness. Once a new trend begins, chartists can then use the corresponding Chandelier Exit to help define this trend.
Developer: Charles Le Beau

Average True Range Trailing Stops
Choices of Alerts supported (mainly for free members with only one alert):
Long crossover : to inform when a long position is available
Short crossover: to inform when a long position is available
Long/Short crossover : to inform when any position is available

Binque's Stop Loss IndicatorBinque's Stop Loss Indicator is a great way to visualize a trailing stop loss based on a percent from the high. i.e. If the high was $10 of a trading day and your stop loss was set at 5% (percent) then your chart would show a small dot 5% below the high of the day. This is a great way to quickly see a trailing stock idea. Change the color to match your back ground. Adjust your trailing stop loss to fit your trading style.
Note: This indicator is calculated off of the daily high.

DayLow - Chart the Moving Average of the DAILY LOW PriceThis is a moving average of the Daily LOW Price over a short period of time (i.e. 3 day low moving average, etc...) Great for tracking trailing stops for a stock on an up swing.

Moving Average Cross and/or Bbands botHello TradingView and world!
This is one of our latest concepts for an actual bot builder. This script comes with a bunch of features that we're hoping will alleviate a lot of the stress and confusion around using and building strategies here on TV. Especially if the end-goal is to automate the strategies using Autoview.
This is a combination of 2 strategies, and gives you full control of each component within the script.
The 2 strategies are:
2 Moving Averages == if close is greater than moving average and moving average 1 is greater than moving average 2
Bolling Bands == if close is less than lower or greater than upper
Features / Settings included :
- Ability to change settings from a commodity market (default) to an altcoin or forex market.
- Backtest time period selector component
- Heiken Ashi Candles on/off
- Moving Average Strategy on/off
- Bollinger Bands Strategy on/off
- Both Moving Average settings can be adjusted
- Bollinger Bands length and multiplier can be adjusted.
- Pyramiding Greater Than, Equal To, or Less Than
- Trailing Stop with the ability to set a price in which the Trailing Stop activate
- Take Profit on/off and editable
- Stop Loss on/off and editable
- Margin Call on/off dependent on Leverage which is editable
- If pyramiding is used, the strategy will calculate and display your average on the chart
- Profit and Loss visuals added to the chart
You can watch a video here on how all the settings can be used and work together.
www.youtube.com
You can learn more about Autoview here:
autoview.with.pink
Get your invite and join us in slack here:
slack.with.pink

Average True Range Reversed Strategy Average True Range Trailing Stops Strategy, by Sylvain Vervoort
The related article is copyrighted material from Stocks & Commodities Jun 2009
Please, use it only for learning or paper trading. Do not for real trading.

JC_MacD_RSI_Candle_Strat_public//
// Author : Jacques CRETINON
// Last Version : V1.0 11-22-2016
//
// Risk disclaimer : Do not use this script in production environment. We assume no liability or responsibility for any damage to you, your computer, or your other property, due to the use of this script.
//
// Purpose of this script :
// 1- use same pine code for strategy or study script (with simple modifications)
// 2- be able to send alerts : enterlong, entershort, exitlong, exitshort, stoplosslong, stoplossshort, takeprofitlong, takeprofitshort in a study script like a strategy script should do
// 3- do not repaint (I HOPE)
//
// RoadMap :
// 1- manage : Trailing Stop Loss and Trailing Stop Loss offset
//
// I use this script :
// 1- with default value for XAUUSD, current chart resolution : 1mn, large timeframe : 15mn.
// 2- That's why I hard code MACD5 (5mn average), MACD15 (15mn average), MACD60 (1h average) ...
// 3- MACD, RSI (1mn and 15mn) and Candles info are my inputs to take any decisions
//
// I do not publish my enterLong, enterShort, exitLong and exitShort conditions (lines 204 to 207 are sample !) as they are not as perfect as I'd like. Fell free to use your own conditions :)
//
// Please, report me any bug, fell free to discuss and share. English is not my natural language, so be clement ;) Happy safe trading :)

Strategy Code Example - Risk Management*** THIS IS JUST AN EXAMPLE OF STRATEGY RISK MANAGEMENT CODE IMPLEMENTATION ***
For my own future reference, and for anyone else who needs it.
Pine script strategy code can be confusing and awkward, so I finally sat down and had a little think about it and put something together that actually works (i think...)
Code is commented where I felt might be necessary (pretty much everything..) and covers:
Take Profit
Stop Loss
Trailing Stop
Trailing Stop Offset
...and details how to handle the input values for these in a way that allows them to be disabled if set to 0, without breaking the strategy.exit functionality or requiring a silly amount of statement nesting.
Also shows how to use functions (or variables/series) to execute trade entries and exits.
Cheers!

CapnsSurferThis is a simple RMA Trend that may help you decide for SL or TP. Similar to CapnsBands this uses Donchian Channels.. but remember. Your Trade Your Money
Howto Read Capns Surfer - I will write more later
First of all this is NOT a BUY or SELL indicator. However with this you can define sweet spots for ENTRIES, or TRAILING STOPS and recognize the trend.
Sweetspots

Ichimoku-Hausky Trading systemThis is a indicator with some parts of the ichimoku and EMA. It's my first script so i have used other peoples script (Chris Moody and DavidR) as reference cause I really have no idea myself on how to script with pinescript.
Hope that is okay!
I use 20M timeframe but it should work with any timeframe! I have not tested this system much so I would really appreciate feedback and tips for better entries, settings etc..
Tenken-sen: green line
Kijun-sen: blue line
EMA: Purple
Rules:
Buy:
IF price crosses or bounce above Kijun-sen
THEN see if market has closed above EMA
IF Market has closed above EMA
THEN see if EMA is above Kijun-sen
IF EMA is above Kijun-sen
THEN buy and set trailing stop 5 pips below EMA
Sell:
IF price crosses or bounce below Kijun-sen
THEN see if market has closed below EMA
IF Market has closed below EMA
THEN see if EMA is below Kijun-sen
IF EMA is below Kijun-sen
THEN sell and set trailing stop 5 pips above EMA

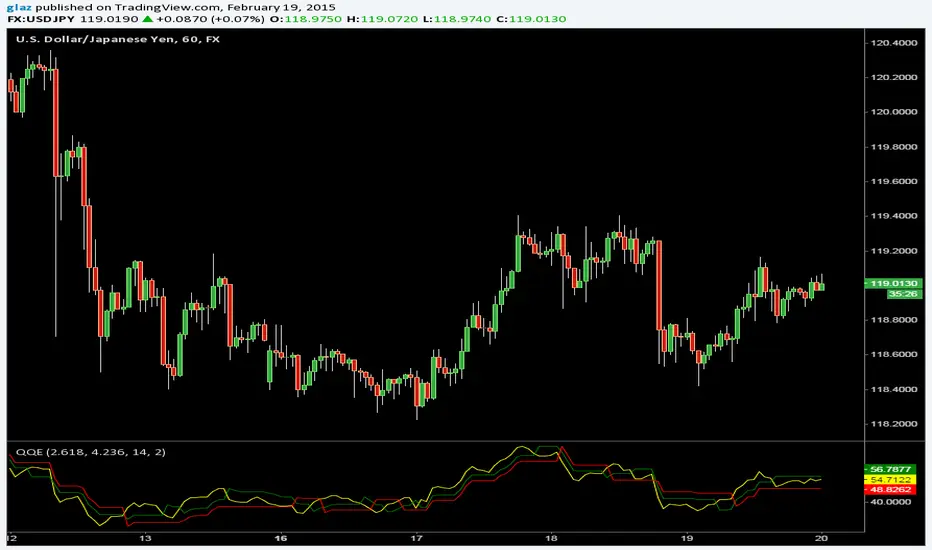
QQEThe Metastock version of Quantative Qualitative Estimation with two trailing stop lines and more options
Yellow line can be hidden if its too many signals and expirement with the Slow/Fast Trailing stop lines.
SuperTrend BFThe SuperTrend overlay by Olivier Seban provides an excellent 'trailing stop' that can be used with any bar length for bullish or bearish moves. My preferred timeframe is weekly for capturing huge (Super) moves. For instance applying it to AAPL, this baby would have us reeling in a fivebagger over the course of three years. Patience and holding your nerve are key to trend following and I like to think of SuperTrend as a great big visual 'crutch' right there on the chart.
Essentially this is an average true range trailing stop, of which there are several versions available (eg see the Sylvain Vervoort version programmed by H Potter). SuperTrend differs by referring the stop back from the middle of the bar (High+Low)/2. This is similar to using the Vervoort with a tweak to the number of ATR's considered. At the end of the day its a matter of preference and what works best for you.

CM_Parabolic SAREnhanced Parabolic Sar
Simply Enhances Default Parabolic SAR by creating Two Color Options, One for UpTrend, Other for DownTrend
Ability To Turn On/Off The Up Trending Parabolic SAR, And The Down Trending Parabolic SAR
Great Indicator For Trailing Stops.

KCP ATR + EMA Bands [Dr. K. C. Prakash]📊 KCP ATR + EMA Bands
KCP ATR + EMA Bands is a trend-responsive volatility channel indicator that combines the Exponential Moving Average (EMA) with Average True Range (ATR) to identify trend direction, dynamic support & resistance, trade zones, and extreme price conditions.
It is designed for intraday, swing, and positional trading, especially in indices, futures, and high-liquidity stocks.
🔧 How the Indicator Works
1️⃣ EMA – Trend Anchor
The EMA (default: 21) acts as the core trend line:
Price above EMA → bullish bias
Price below EMA → bearish bias
2️⃣ ATR – Volatility Engine
The ATR measures real-time volatility and expands or contracts the bands automatically:
High volatility → wider bands
Low volatility → tighter bands
This makes the indicator adaptive, unlike fixed-width channels.
3️⃣ Inner Bands – Trade Zones
Constructed using ATR × 1.0
Represent high-probability pullback and continuation zones
Useful for:
Pullback entries
Trend continuation trades
Mean-reversion setups within trend
4️⃣ Outer Bands – Extreme Zones
Constructed using ATR × 2.0
Represent price extremes
Ideal for:
Profit booking
Reversal watch zones
Stop-loss reference levels
🎨 Visual Design (Professional)
🟢 Green bands → bullish zones & support
🔴 Red bands → bearish zones & resistance
⚪ Gray EMA → neutral trend reference
Clean fills help identify bullish and bearish pressure zones without clutter.
📈 Trading Applications
✔ Trend Trading
Buy on pullbacks near lower inner band when price is above EMA
Sell on pullbacks near upper inner band when price is below EMA
✔ Breakout Trading
Strong closes beyond inner bands indicate momentum expansion
Breaks beyond outer bands signal exhaustion or strong continuation
✔ Risk Management
Inner bands → trailing stop reference
Outer bands → hard stop or target zones
⏱️ Best Timeframes
5m / 15m → Intraday trading
30m / 1H → Swing trading
Daily → Positional trading
🏆 Why This Indicator Stands Out
✔ Combines trend + volatility in one tool
✔ Adaptive to market conditions
✔ Reduces noise compared to fixed bands
✔ Clear visual guidance for entries, exits & risk
✔ Works across asset classes
⚠️ Important Note
This indicator performs best in trending or expanding volatility markets.
Always confirm trades with price action, volume, or higher-timeframe bias.

Step Channel█ OVERVIEW
"Step Channel" is a technical analysis indicator that builds a dynamic price channel based on market volatility (ATR) and a step-like logic for updating levels. It is ideal for traders using market structure analysis, price action, as well as trend-following, range-bound, and breakout strategies.
Thanks to the adjustable channel width, the indicator can be easily adapted to various instruments, timeframes, and trading styles – from scalping to swing trading.
█ CONCEPTS
The indicator is a universal trading tool that supports trend detection, trading in consolidation, and breakout-based strategies.
The key feature is the step-like update of the baseline (MID). Unlike classic moving averages:
- the MID line does not react to every candle
- it updates only after breaking a volatility-based level
- each breakout creates a new "step" in the market structure
This keeps the market structure clear, with regime changes being distinct and objective.
█ FEATURES
ATR-based dynamic channel
The channel width automatically adjusts to current volatility – widening during high-activity periods and narrowing in consolidations, ensuring constant adaptation to market conditions.
Structural MID line
Central, adaptive trend line updated in steps after a breakout.
Inner levels (IN)
The zone of typical price movement within the structure. These levels change only after a sustained breakout confirmed by candle close – this exact breakout generates the structural signals (Step UP/DOWN).
Outer levels (OUT)
An orientational zone indicating the potential reach of a strong, single price move beyond the current structure. Price never stays in this zone (levels shift immediately after breaking IN). Primarily used as:
- main take-profit levels
- dynamic SL in aggressive strategies
Structural signals
Generated exclusively at the moment of a real structure change:
- Step UP – upside breakout
- Step DOWN – downside breakout
Signals appear only on the breakout candle.
Built-in alerts
Instant notifications for:
- Step UP
- Step DOWN
█ HOW TO USE
Adding to the chart
Search in the TradingView indicators library: "Step Channel" or paste the code in Pine Editor.
Key parameter configuration:
- ATR Length – longer value = more stable structure (fewer signals)
- Inner Multiplier – sensitivity of inner levels (lower = narrower operational channel)
- Outer Multiplier – reach of outer extremes (higher = further TP)
- Price position interpretation:
- near MID → market equilibrium, potential consolidation
- in IN zone → healthy, controlled trend move
- in OUT zone → only an orientational target for extreme move (price does not stay in this zone)
█ APPLICATIONS
- Trend strategies – entries after Step UP/DOWN signal in the direction of the new trend, re-entry at MID, trailing stop along MID; generally positions only in line with the current structure direction
- Range trading – buying at lower IN/OUT and selling at upper IN/OUT in the absence of structure change
- Breakout strategies – entries on breakout candle close with volume or HTF confirmation
- Position management – SL behind MID or opposite IN, TP at OUT (full) or IN (partial)
- Scalping on low timeframes – quick trades inside the IN channel with tight SL
- Swing trading – trend filtering on HTF and precise entries on LTF after structural signal
█ NOTES
- works on all markets and timeframes
- requires individual adjustment of multipliers to the instrument and trading style
- recommended to use with additional indicators, e.g. RSI, Fibonacci, pivots

Purra Buy Sell Signalsindicator.lk's purra buy sell is a precision-tuned indicator designed specifically for XAU/USD (Gold) 5-minute scalping. It combines a smoothed trend-filter (based on a multi-stage EMA cascade with adaptive smoothing) and an ATR-based trailing stop logic to generate high-confidence Buy and Sell signals directly on the price chart.
Ideal for short-term traders seeking clean, responsive entries with minimal lag, this tool helps you:
Catch early trend reversals
Avoid choppy false signals
Execute fast scalps during active gold sessions (London & Asian overlap)
Built with risk-aware logic and visual clarity in mind—green labels = long opportunities, red labels = short setups. Fully compatible with alerts for automated trade execution.
Optimized for XAUUSD on the 5-minute timeframe. Works best during high-liquidity hours.
🛠️ How to Use (for Gold 5-Minute Scalping)
Apply to Chart: Add the indicator to XAU/USD (Gold) on the 5-minute timeframe.
Signal Interpretation:
Green "Buy" label below bar: Strong bullish momentum—consider long entry.
Red "Sell" label above bar: Strong bearish momentum—consider short entry.
Confirmation Tips:
Trade only when the background ribbon or trend line (if enabled) aligns with the signal direction (green = uptrend, red = downtrend).
Avoid signals during major news events or low volatility (e.g., late NY session).
For higher accuracy, combine with price action (e.g., rejection candles, break of micro structure).
Risk Management:
Use tight stop-losses just beyond recent swing points.
Target 1:1 or 1:2 risk-reward; gold moves fast on 5M!
Alerts: Enable TradingView alerts on “Purra Long” / “Purra Short” conditions for real-time notifications.

BULL Whale Finder + BTC 1hBULL Whale Finder + BTC 1h is a long-only strategy designed to capture strong impulsive moves in Bitcoin.
It trades expansion (Whale) bars that appear in the direction of the trend, confirmed by the 200-period moving average on both 1H and 4H, with price holding above the 20-period moving average.
Entries focus on impulsive moves that originate from structural zones, not late breakouts.
Risk management is fully automated:
ATR-based initial stop
Automatic profit protection (Pay-Self)
Adds and partial exits based on the expansion-bar sequence
A protected runner managed with a trailing stop
The user only sets the risk per trade (MLPT).
All other parameters are hardcoded and locked to prevent over-optimization.
👉 Ready for backtesting, discretionary execution, or full automation.

TrintityTrendIntroducing TrinityTrend
A multi-signal indicator combining:
Candle TrendStrength
SuperTrend logic
TTM Squeeze detection
Built for clarity, momentum, and volatility awareness—across any timeframe.
TrendStrength Mode
Candle coloring reflects directional conviction.
Strong uptrend
Strong downtrend
Neutral or indecisive
Helps traders stay with momentum and avoid chop.
SuperTrend Overlay
SuperTrend Logic Dynamic trailing stop based on volatility.
🟩 Price above = bullish bias
🟥 Price below = bearish bias
Great for swing entries and exits.
TTM Squeeze Detection
TTM Squeeze Mode Detects compression zones before breakout.
Squeeze on = buildup (You can change the color of this)
Pairs well with TrendStrength for timing entries.
Multi-Timeframe Versatility
Multi-Timeframe Ready:
Intraday scalping
Daily swing setups
Weekly macro bias
Toggle modes to match your strategy

EMA Multi-Type StrategyThis is a price-action + EMA trend strategy that:
Uses EMA as trend filter
Looks for pullbacks and structure shifts near the EMA
Trades 3 different entry patterns (TYPE 1 / 2 / 3)
Allows:
Fixed SL–TP (RR based)
OR ATR trailing stop
Optionally blocks opposite trades until the current trade exits
Think of it as:
“Trade continuation after pullback in EMA trend, with multiple confirmation strengths.”
