RSI MACD+RSI MACD is a typical MACD indicator with RSI as its source, instead of price close.
Enhanced with signals whenever crossings occur.
In den Scripts nach "RSI MACD" suchen
RSI + MACD + EMA Buy/Sell ComboRSI + MACD + EMA Buy/Sell Combo with signals if all 2 lines up it will create buy and cell signals
RSI + MACD Day Trading Toolkit//@version=6
indicator("RSI + MACD Day Trading Toolkit", overlay = true)
//──────────────────────────────────────────────────────────────────────────────
// 1. INPUTS
//──────────────────────────────────────────────────────────────────────────────
// RSI settings
rsiLength = input.int(14, "RSI Length")
rsiOverbought = input.float(70, "RSI Overbought Level", minval = 50, maxval = 100)
rsiOversold = input.float(30, "RSI Oversold Level", minval = 0, maxval = 50)
// MACD settings (classic 12 / 26 / 9)
macdFastLength = input.int(12, "MACD Fast Length")
macdSlowLength = input.int(26, "MACD Slow Length")
macdSignalLength = input.int(9, "MACD Signal Length")
// Risk model selection
riskModel = input.string("ATR", "Risk Model", options = )
// ATR-based SL/TP
atrLength = input.int(14, "ATR Length")
atrSLMult = input.float(1.5, "SL ATR Multiplier", minval = 0.1, step = 0.1)
atrTPMult = input.float(2.5, "TP ATR Multiplier", minval = 0.1, step = 0.1)
// Percent-based SL/TP (for scalping on very tight spreads)
slPercent = input.float(0.5, "SL % (when Risk Model = Percent)", minval = 0.05, step = 0.05)
tpPercent = input.float(1.0, "TP % (when Risk Model = Percent)", minval = 0.05, step = 0.05)
// Visual / styling
showSLTPLines = input.bool(true, "Plot Stop Loss / Take Profit Lines")
//──────────────────────────────────────────────────────────────────────────────
// 2. CORE INDICATORS: RSI & MACD
//──────────────────────────────────────────────────────────────────────────────
rsiValue = ta.rsi(close, rsiLength)
// Manual MACD calculation (avoids tuple unpacking issues)
macdFastEMA = ta.ema(close, macdFastLength)
macdSlowEMA = ta.ema(close, macdSlowLength)
macdValue = macdFastEMA - macdSlowEMA
macdSignal = ta.ema(macdValue, macdSignalLength)
macdHist = macdValue - macdSignal
atrValue = ta.atr(atrLength)
// Hide internal plots from price scale (still accessible if you change display)
plot(rsiValue, "RSI", display = display.none)
plot(macdValue, "MACD", display = display.none)
plot(macdSignal, "MACD Sig", display = display.none)
plot(macdHist, "MACD Hist", display = display.none)
//──────────────────────────────────────────────────────────────────────────────
// 3. SIGNAL LOGIC (ENTRY CONDITIONS)
//──────────────────────────────────────────────────────────────────────────────
//
// Idea:
// - LONG bias: RSI emerges from oversold AND MACD crosses above signal below zero
// - SHORT bias: RSI falls from overbought AND MACD crosses below signal above zero
//
// Combines momentum (RSI) with trend confirmation (MACD).
//──────────────────────────────────────────────────────────────────────────────
// RSI events
rsiBullCross = ta.crossover(rsiValue, rsiOversold) // RSI crosses UP out of oversold
rsiBearCross = ta.crossunder(rsiValue, rsiOverbought) // RSI crosses DOWN from overbought
// MACD crossover with trend filter
macdBullCross = ta.crossover(macdValue, macdSignal) and macdValue < 0 // Bullish cross below zero-line
macdBearCross = ta.crossunder(macdValue, macdSignal) and macdValue > 0 // Bearish cross above zero-line
// Raw (ungated) entry signals
rawLongSignal = rsiBullCross and macdBullCross
rawShortSignal = rsiBearCross and macdBearCross
//──────────────────────────────────────────────────────────────────────────────
// 4. STATE MANAGEMENT (SIMULATED POSITION TRACKING)
//──────────────────────────────────────────────────────────────────────────────
//
// position: 1 = long
// -1 = short
// 0 = flat
//
// We track entry price and SL/TP levels as if this were a strategy.
// This is still an indicator – it just computes and plots the logic.
//──────────────────────────────────────────────────────────────────────────────
var int position = 0
var float longEntryPrice = na
var float shortEntryPrice = na
var float longSL = na
var float longTP = na
var float shortSL = na
var float shortTP = na
// Per-bar flags (for plotting / alerts)
var bool longEntrySignal = false
var bool shortEntrySignal = false
var bool longExitSignal = false
var bool shortExitSignal = false
// Reset per-bar flags each bar
longEntrySignal := false
shortEntrySignal := false
longExitSignal := false
shortExitSignal := false
//──────────────────────────────────────────────────────────────────────────────
// 5. EXIT LOGIC (STOP LOSS / TAKE PROFIT / OPPOSITE SIGNAL)
//──────────────────────────────────────────────────────────────────────────────
//
// Exits are evaluated BEFORE new entries on each bar.
//──────────────────────────────────────────────────────────────────────────────
// Stop-loss / take-profit hits for existing positions
longStopHit = position == 1 and not na(longSL) and low <= longSL
longTakeHit = position == 1 and not na(longTP) and high >= longTP
shortStopHit = position == -1 and not na(shortSL) and high >= shortSL
shortTakeHit = position == -1 and not na(shortTP) and low <= shortTP
// Opposite signals can also close positions
reverseToShort = position == 1 and rawShortSignal
reverseToLong = position == -1 and rawLongSignal
// Combine exit conditions
longExitNow = longStopHit or longTakeHit or reverseToShort
shortExitNow = shortStopHit or shortTakeHit or reverseToLong
// Register exits and flatten position
if longExitNow and position == 1
longExitSignal := true
position := 0
longEntryPrice := na
longSL := na
longTP := na
if shortExitNow and position == -1
shortExitSignal := true
position := 0
shortEntryPrice := na
shortSL := na
shortTP := na
//──────────────────────────────────────────────────────────────────────────────
// 6. ENTRY LOGIC WITH RISK MODEL (SL/TP CALCULATION)
//──────────────────────────────────────────────────────────────────────────────
//
// Only take a new trade when flat.
// SL/TP are calculated relative to entry price using either ATR or Percent.
//──────────────────────────────────────────────────────────────────────────────
if position == 0
// Long entry
if rawLongSignal
position := 1
longEntryPrice := close
if riskModel == "ATR"
longSL := longEntryPrice - atrValue * atrSLMult
longTP := longEntryPrice + atrValue * atrTPMult
else // Percent model
longSL := longEntryPrice * (1.0 - slPercent / 100.0)
longTP := longEntryPrice * (1.0 + tpPercent / 100.0)
longEntrySignal := true
// Short entry
else if rawShortSignal
position := -1
shortEntryPrice := close
if riskModel == "ATR"
shortSL := shortEntryPrice + atrValue * atrSLMult
shortTP := shortEntryPrice - atrValue * atrTPMult
else // Percent model
shortSL := shortEntryPrice * (1.0 + slPercent / 100.0)
shortTP := shortEntryPrice * (1.0 - tpPercent / 100.0)
shortEntrySignal := true
//──────────────────────────────────────────────────────────────────────────────
// 7. PLOTTING: ENTRIES, EXITS, STOPS & TARGETS
//──────────────────────────────────────────────────────────────────────────────
// Entry markers
plotshape(longEntrySignal, title = "Long Entry", style = shape.triangleup, location = location.belowbar, color = color.new(color.lime, 0), size = size.small, text = "LONG")
plotshape(shortEntrySignal, title = "Short Entry", style = shape.triangledown, location = location.abovebar, color = color.new(color.red, 0), size = size.small, text = "SHORT")
// Exit markers (generic exits: SL, TP or reversal)
plotshape(longExitSignal, title = "Long Exit", style = shape.xcross, location = location.abovebar, color = color.new(color.orange, 0), size = size.tiny, text = "LX")
plotshape(shortExitSignal, title = "Short Exit", style = shape.xcross, location = location.belowbar, color = color.new(color.orange, 0), size = size.tiny, text = "SX")
// Optional: show SL/TP levels on chart while in position
plot(showSLTPLines and position == 1 ? longSL : na, title = "Long Stop Loss", style = plot.style_linebr, color = color.new(color.red, 0), linewidth = 1)
plot(showSLTPLines and position == 1 ? longTP : na, title = "Long Take Profit", style = plot.style_linebr, color = color.new(color.lime, 0), linewidth = 1)
plot(showSLTPLines and position == -1 ? shortSL : na, title = "Short Stop Loss", style = plot.style_linebr, color = color.new(color.red, 0), linewidth = 1)
plot(showSLTPLines and position == -1 ? shortTP : na, title = "Short Take Profit", style = plot.style_linebr, color = color.new(color.lime, 0), linewidth = 1)
//──────────────────────────────────────────────────────────────────────────────
// 8. ALERT CONDITIONS
//──────────────────────────────────────────────────────────────────────────────
//
// Configure TradingView alerts using these conditions.
//──────────────────────────────────────────────────────────────────────────────
// Entry alerts
alertcondition(longEntrySignal, title = "Long Entry (RSI+MACD)", message = "RSI+MACD: Long entry signal")
alertcondition(shortEntrySignal, title = "Short Entry (RSI+MACD)", message = "RSI+MACD: Short entry signal")
// Exit alerts (by type: SL vs TP vs reversal)
alertcondition(longStopHit, title = "Long Stop Loss Hit", message = "RSI+MACD: Long STOP LOSS hit")
alertcondition(longTakeHit, title = "Long Take Profit Hit", message = "RSI+MACD: Long TAKE PROFIT hit")
alertcondition(shortStopHit, title = "Short Stop Loss Hit", message = "RSI+MACD: Short STOP LOSS hit")
alertcondition(shortTakeHit, title = "Short Take Profit Hit", message = "RSI+MACD: Short TAKE PROFIT hit")
alertcondition(reverseToShort, title = "Long Exit by Reverse Signal", message = "RSI+MACD: Long exit by SHORT reverse signal")
alertcondition(reverseToLong, title = "Short Exit by Reverse Signal", message = "RSI+MACD: Short exit by LONG reverse signal")
//──────────────────────────────────────────────────────────────────────────────
// 9. QUICK USAGE NOTES
//──────────────────────────────────────────────────────────────────────────────
//
// - Indicador, não estratégia: ele simula posição, SL/TP e sinais de saída.
// - Para backtest/auto, basta portar a mesma lógica para um script `strategy()`
// usando `strategy.entry` e `strategy.exit`.
// - Em day trade, teste ATR vs Percent e ajuste os multiplicadores ao ativo.
//──────────────────────────────────────────────────────────────────────────────

RSI-MACD Momentum Fusion Indicator(RMFI)📈 RSI-MACD Momentum Fusion Indicator (RMFI)
The RMFI combines the strengths of two RSI variants with a dynamically adaptive MACD module into a powerful momentum oscillator ranging from 0 to 100. The goal is to unify converging momentum information from different perspectives into a clear, weighted overall signal.
🔧 Core Features
RSI 1: Classic Wilder RSI, sensitive to short-term momentum.
RSI 2: Modified RSI based on normalized price movement ranges (Range Momentum).
MACD (3 Modes):
Standardized (min/max-based)
Fully adaptive (Z-score normalization)
50% adaptive (hybrid weighting of both approaches)
Dynamic MACD mode selection (optional): Automatic switching of MACD normalization based on volatility levels (ATR-based).
Signal Line: Smoothed average of all components to visualize momentum trends and crossovers.
🎯 Visualization
Clear separation of overbought (>70) and oversold (<30) zones with color highlighting.
Different colors based on the dynamic MACD mode – visually indicates how strongly the market adapts to volatility.
⚙️ Recommended Use
Ideal for trend following, divergence confirmation (with external divergence logic), and momentum reversals.
Particularly effective in volatile markets, as the MACD component adaptively responds to instability.
© champtrades
RSI + MACD Combo (sajadbagheri)The "RSI+MACD Persian Combo" integrates two classic oscillators with smart normalization. It detects overbought/oversold zones, MACD/RSI convergences, and highlights high-probability reversals using Z-Score scaling. Customizable alerts provide trade-ready signals.
Created by: Sajad Bagheri


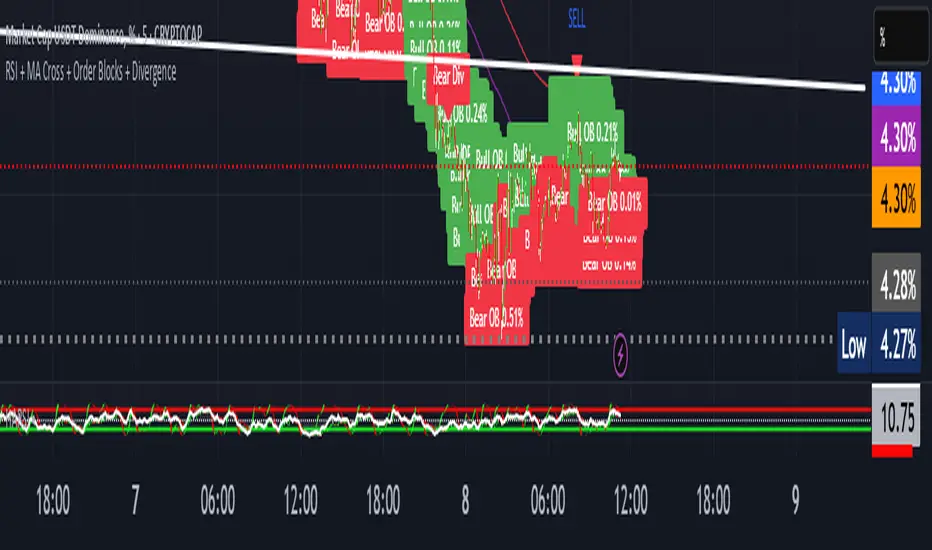
Uptrick: Supply and Demand Zones with RSI, MACD and TP signalsUptrick: Supply and Demand Zones with RSI, MACD Signals and TP Signals
This script is a comprehensive technical analysis indicator for the TradingView platform, combining multiple strategies and indicators to assist traders in making informed decisions. The script incorporates supply and demand zones, Relative Strength Index (RSI), Moving Average Convergence Divergence (MACD) signals, and trend and take profit signals. Below is a detailed explanation of each feature, its purpose, how to use it, and how it differs from other indicators.
Key Features
Supply and Demand Zones:
Purpose: Identify key price levels where buying (demand) or selling (supply) pressure has historically been strong.
Inputs:
supplySwingLength (Default: 20): Determines the number of bars to consider for identifying swing highs for supply zones.
demandSwingLength (Default: 20): Determines the number of bars to consider for identifying swing lows for demand zones.
zoneExtensionBars (Default: 50): Specifies how many bars to extend the zones to the right for visibility.
Usage: The indicator highlights these zones on the chart, making it easier for traders to spot potential reversal points.
Relative Strength Index (RSI) and Moving Average of RSI:
Purpose: RSI measures the speed and change of price movements, helping to identify overbought or oversold conditions. The moving average of RSI smoothens the RSI values to reduce noise.
Inputs:
lengthrsi (Default: 14): The period for calculating RSI.
lengthrsima (Default: 8): The period for calculating the moving average of RSI.
Usage: Buy and sell signals are generated when the RSI crosses above or below the 50 level, respectively, indicating potential entry or exit points.
MACD (Moving Average Convergence Divergence):
Purpose: MACD is a trend-following momentum indicator that shows the relationship between two moving averages of a security’s price.
Inputs:
macdFastLength (Default: 12): The short period for the fast EMA.
macdSlowLength (Default: 26): The long period for the slow EMA.
macdSignalSmoothing (Default: 9): The period for the signal line.
Usage: Buy and sell signals are generated when the MACD line crosses above or below the signal line, respectively. This is an optional feature that can be enabled or disabled.
Signal Type Selection:
Purpose: Allows the trader to choose between RSI signals or supply/demand zone signals.
Inputs:
signalType (Default: "RSI"): Options are "RSI" or "Supply/Demand".
Usage: The chosen signal type determines the logic for plotting buy and sell signals on the chart.
Take Profit Signals:
Purpose: Provide take profit signals based on statistical volatility.
Inputs:
TheLength (Default: 20): The period for calculating the basis SMA and standard deviation.
tpmult (Default: 2.5): The multiplier for the standard deviation to set the take profit levels.
Usage: Generates buy and sell take profit signals when the price crosses over or under the calculated levels.
Detailed Explanation
Supply and Demand Zones Logic:
Swing High and Swing Low:
Functions isSwingHigh and isSwingLow determine whether the current high or low is the highest or lowest within a specified length, indicating potential supply or demand zones.
Zone Visualization:
When a new swing high or low is detected, a box is drawn from the identified bar and extended to the right for visibility. This helps traders visually identify these critical zones.
The boxes are updated dynamically as new swings are detected, ensuring the most relevant zones are always displayed.
RSI and MACD Signals:
RSI Calculation:
The script calculates the RSI using the specified period and then smooths it using an exponential moving average.
Buy and sell signals are generated based on the RSI's crossover with the 50 level.
MACD Calculation:
The MACD line and signal line are calculated using the specified periods.
Buy and sell signals are generated based on crossovers between the MACD line and the signal line.
These signals can be enabled or disabled based on user preference.
Trend Detection and Take Profit Signals:
Trend Detection:
The script calculates the basis (SMA) and upper and lower bands based on the standard deviation.
It determines the trend strength and direction by comparing the current price to these bands.
Take Profit Levels:
Take profit levels are set by multiplying the standard deviation by a user-defined multiplier.
Signals are plotted when the price crosses these take profit levels, indicating potential exit points.
Differences from Other Indicators
Combination of Multiple Indicators:
This script integrates supply and demand zones with RSI and MACD signals, offering a comprehensive tool for technical analysis.
Most other indicators focus on a single strategy, whereas this script provides a holistic view by combining multiple strategies.
Customizable Inputs:
The script offers a high degree of customization, allowing traders to adjust various parameters to suit their trading style and preferences.
Many indicators have fixed settings, limiting their adaptability to different market conditions.
Dynamic Zone Visualization:
The supply and demand zones are dynamically updated, providing real-time insights into key price levels.
This feature is not commonly found in other indicators, which may rely on static levels or less visually intuitive methods.
Usage Guide
Setup:
Add the script to your TradingView chart.
Adjust the input parameters as needed to match your trading strategy.
Interpreting Signals:
Supply and Demand Zones: Look for potential reversal points at these zones.
RSI and MACD Signals: Use these signals to identify potential entry and exit points.
Take Profit Signals: Set take profit levels based on the calculated signals to manage risk and lock in profits.
Combining Signals:
Combine signals from different features to increase the reliability of your trading decisions.
For example, a buy signal from RSI combined with a price approaching a demand zone may indicate a stronger buy opportunity.
Inputs Explained
Supply and Demand Zones:
supplySwingLength: The length of bars to consider for identifying swing highs.
demandSwingLength: The length of bars to consider for identifying swing lows.
zoneExtensionBars: The number of bars to extend the zones to the right.
RSI:
lengthrsi: The period for calculating the RSI.
lengthrsima: The period for calculating the EMA of the RSI.
MACD:
macdFastLength: The short period for the fast EMA.
macdSlowLength: The long period for the slow EMA.
macdSignalSmoothing: The period for the signal line.
Signal Type:
signalType: Choose between "RSI" and "Supply/Demand" signals.
Take Profit:
TheLength: The period for calculating the basis SMA and standard deviation.
tpmult: The multiplier for the standard deviation to set the take profit levels.
Conclusion
The "Uptrick: Supply and Demand Zones with RSI, MACD Signals and TP signals" script is a powerful and versatile indicator that combines multiple strategies to provide traders with a comprehensive analysis tool. Its detailed visualization of supply and demand zones, coupled with RSI and MACD signals, and trend-based take profit signals, makes it an invaluable tool for both novice and experienced traders. By understanding and utilizing its features effectively, traders can make more informed and confident trading decisions.

Combo RSI + MACD + ADX MTF (Avec Alertes)✅ Recommended Title:
Multi-Signal Oscillator: ADX Trend + DI + RSI + MACD (MTF, Cross Alerts)
✅ Detailed Description
📝 Overview
This indicator combines advanced technical analysis tools to identify trend direction, capture reversals, and filter false signals.
It includes:
ADX (Multi-TimeFrame) for trend and trend strength detection.
DI+ / DI- for directional bias.
RSI + ZLSMA for oscillation analysis and divergence detection.
Zero-Lag Normalized MACD for momentum and entry timing.
⚙️ Visual Components
✅ Green/Red Background: Displays overall trend based on Multi-TimeFrame ADX.
✅ DI+ / DI- Lines: Green and red curves showing directional bias.
✅ Normalized RSI: Blue oscillator with orange ZLSMA smoothing.
✅ Zero-Lag MACD: Violet or fuchsia/orange oscillator depending on the version.
✅ Crossover Points: Colored circles marking buy and sell signals.
✅ ADX Strength Dots: Small black dots when ADX exceeds the strength threshold.
🚨 Included Alert System
✅ RSI / ZLSMA Crossovers (Buy / Sell).
✅ MACD / Signal Line Crossovers (Buy / Sell).
✅ DI+ / DI- Crossovers (Buy / Sell).
✅ Double Confirmation DI+ / RSI or DI+ / MACD.
✅ Double Confirmation DI- / RSI or DI- / MACD.
✅ Trend Change Alerts via Background Color.
✅ ADX Strength Alerts (Above Threshold).
🛠️ Suggested Configuration Examples
1. Short-Term Reversal Detection:
RSI Length: 7 to 14
ZLSMA Length: 7 to 14
MACD Fast/Slow: 5 / 13
ADX MTF Period: 5 to 15
ADX Threshold: 15 to 20
2. Long-Term Trend Following:
RSI Length: 21 to 30
ZLSMA Length: 21 to 30
MACD Fast/Slow: 12 / 26
ADX MTF Period: 30 to 50
ADX Threshold: 20 to 25
3. Scalping / Day Trading:
RSI Length: 5 to 9
ZLSMA Length: 5 to 9
MACD Fast/Slow: 3 / 7
ADX MTF Period: 5 to 10
ADX Threshold: 10 to 15
🎯 Why Use This Tool?
Filters false signals using ADX-based background coloring.
Provides multi-source alerting (RSI, MACD, ADX).
Helps identify true market strength zones.
Works on all markets: Forex, Crypto, Stocks, Indices.

$$\text{Entry and Exit Signals (RSI, MACD, Stochastic)}$$بالتأكيد. إليك شرح كامل للكود البرمجي (Pine Script) الذي يمثل استراتيجية مؤشر الزخم الثلاثي (RSI, MACD, Stochastic) باللغة الإنجليزية، مع توضيح منطق كل شرط:
-----
## 🇺🇸 Multi-Indicator Momentum Confirmation Strategy (Pine Script Explanation)
This custom indicator is designed to generate highly confirmed **Entry (Buy)** and **Exit (Sell/Short)** signals by ensuring that three key momentum and oscillator indicators—**RSI, MACD, and Stochastic**—are all aligned in the same direction.
### 📜 Indicator Code Structure
```pinescript
//@version=5
indicator("إشارات الدخول والخروج (RSI, MACD, Stochastic)", overlay=true)
// --- 1. Indicator Settings (Inputs) ---
rsiLength = input.int(14, title="RSI Length")
rsiLevel = input.float(50, title="Positive RSI Level")
// ... MACD and Stochastic inputs
// --- 2. Calculation of Indicators ---
rsiValue = ta.rsi(close, rsiLength)
= ta.macd(close, fastLength, slowLength, signalLength)
stochK = ta.stoch(close, high, low, stochKLength)
// --- 3. Entry (Bullish) and Exit (Bearish) Conditions ---
//
// --- 4. Final Signal Determination ---
finalEntrySignal = rsiCondition_Bullish and macdCondition_Bullish and stochCondition_Bullish
finalExitSignal = rsiCondition_Bearish and macdCondition_Bearish and stochCondition_Bearish
// --- 5. Plotting the Signals ---
plotshape(
finalEntrySignal ? low : na,
style=shape.labelup,
location=location.belowbar,
text="دخول", // 'Entry'
// ... color and size settings
)
plotshape(
finalExitSignal ? high : na,
style=shape.labeldown,
location=location.abovebar,
text="خروج", // 'Exit'
// ... color and size settings
)
```
### 🧠 Logic Behind the Entry Signal ("دخول" - Buy)
A **"Entry" (Buy)** signal is generated when **ALL THREE** of the following bullish conditions are met on the same candlestick:
| Indicator | Bullish Condition (The Logic) | Why this ensures strong momentum? |
| :--- | :--- | :--- |
| **Relative Strength Index (RSI)** | **Positive AND Increasing:** (`rsiValue > 50`) AND (`rsiValue > rsiValue `) | The asset is not only gaining strength (above the 50 centerline) but its strength is actively **accelerating** (current value is higher than the previous one). |
| **Moving Average Convergence Divergence (MACD)** | **Bullish Crossover:** `macdLine > signalLine` | This indicates that the shorter-term momentum (MACD Line) has crossed above the longer-term momentum average (Signal Line), confirming a potential shift to bullish momentum. |
| **Stochastic Oscillator** | **Positive:** `stochK > 50` | The closing price is in the upper half of the recent price range, suggesting that buying pressure is dominating the current trend cycle. |
**The `finalEntrySignal` is triggered only when `RSI_Bullish AND MACD_Bullish AND Stochastic_Bullish` are true.**
-----
### 📉 Logic Behind the Exit Signal ("خروج" - Sell/Short)
A **"Exit" (Sell/Short)** signal is generated when **ALL THREE** of the following bearish conditions are met on the same candlestick:
| Indicator | Bearish Condition (The Logic) | Why this ensures strong momentum loss? |
| :--- | :--- | :--- |
| **Relative Strength Index (RSI)** | **Negative AND Decreasing:** (`rsiValue < 50`) AND (`rsiValue < rsiValue `) | The asset is losing strength (below the 50 centerline) and its weakness is actively **accelerating** (current value is lower than the previous one). |
| **Moving Average Convergence Divergence (MACD)** | **Bearish Crossover:** `macdLine < signalLine` | The shorter-term momentum has crossed below the Signal Line, confirming a potential shift to bearish momentum. |
| **Stochastic Oscillator** | **Negative:** `stochK < 50` | The closing price is in the lower half of the recent price range, suggesting that selling pressure is dominating the current trend cycle. |
**The `finalExitSignal` is triggered only when `RSI_Bearish AND MACD_Bearish AND Stochastic_Bearish` are true.**
### 💡 Visual Output
* **Entry Signal:** Plotted as a green label with the text "دخول" (**Entry**) **below the bar** (`location.belowbar`).
* **Exit Signal:** Plotted as a red label with the text "خروج" (**Exit**) **above the bar** (`location.abovebar`).
This strategy aims to filter out weak signals by requiring a high level of consensus across multiple technical dimensions.

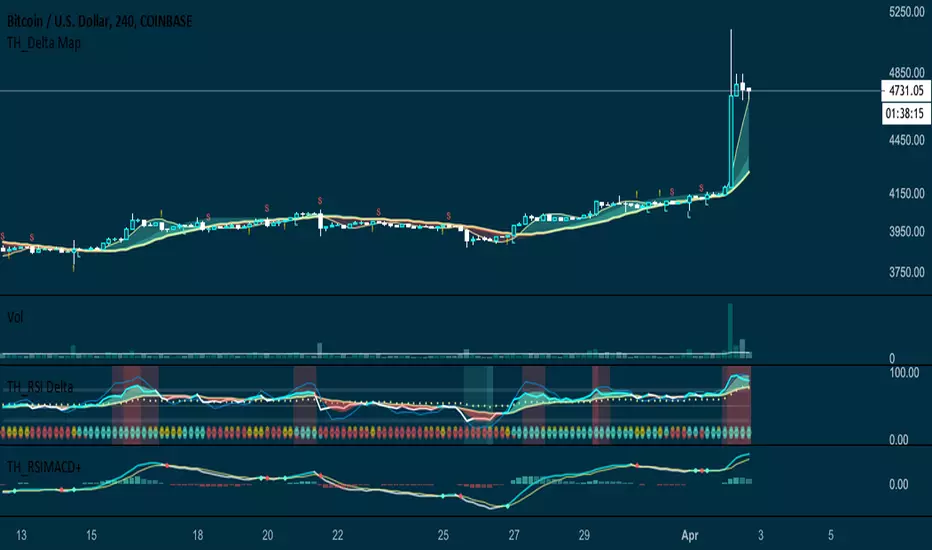
ombs - atr vol ma rsi macdאינדקטור ombs – atr vol ma rsi macd מציג תצוגה חזותית קלה לשימוש של נתוני דשבורד יומיים עיקריים - טווח ממוצע יומי (ATR), ווליום (VOL), ממוצע נע 150, העצמת RSI ו-MACD. העיגולים הצבעוניים מחליפים צבעים לפי חוזק או חולשה במדדים המרכזיים. אידיאלי לאנליסטים וסוחרים שרוצים לראות תמונת מצב טכנית בבת אחת במסך.
The ombs – atr vol ma rsi macd indicator provides a crisp dashboard-style visualization of key daily technical stats: Average True Range (ATR), Volume (VOL), 150-period Moving Average (MA), RSI, and MACD. Colored dots summarize the strength or weakness at a glance for each metric. Perfect for analysts and traders who want an instant technical overview directly on the chart.

MomentumSignal Kit RSI-MACD-ADX-CCI-CMF-TSI-EStoch// ----------------------------------------
// Description:
// ----------------------------------------
// MomentumKit RSI/MACD-ADX-CCI-CMF-TSI-EStoch Suite is a comprehensive momentum indicator suite designed to provide robust buy and sell signals through the consensus of multiple normalized momentum indicators. This suite integrates the following indicators:
// - **Relative Strength Index (RSI)**
// - **Stochastic RSI**
// - **Moving Average Convergence Divergence (MACD)** with enhanced logic
// - **True Strength Index (TSI)**
// - **Commodity Channel Index (CCI)**
// - **Chaikin Money Flow (CMF)**
// - **Average Directional Index (ADX)**
// - **Ehlers' Stochastic**
//
// **Key Features:**
// 1. **Normalization:** Each indicator is normalized to a consistent scale, facilitating easier comparison and interpretation across different momentum metrics. This uniform scaling allows traders to seamlessly analyze multiple indicators simultaneously without the confusion of differing value ranges.
//
// 2. **Consensus-Based Signals:** By combining multiple indicators, MomentumKit generates buy and sell signals based on the agreement among various momentum measurements. This multi-indicator consensus approach enhances signal reliability and reduces the likelihood of false positives.
//
// 3. **Overlap Analysis:** The normalization process aids in identifying overlapping signals, where multiple indicators point towards a potential change in price or momentum. Such overlaps are strong indicators of significant market movements, providing traders with timely and actionable insights.
//
// 4. **Enhanced Logic for MACD:** The MACD component within MomentumKit utilizes enhanced logic to improve its responsiveness and accuracy in detecting trend changes.
//
// 5. **Debugging Features:** MomentumKit includes advanced debugging tools that display individual buy and sell signals generated by each indicator. These features are intended for users with technical and programming skills, allowing them to:
// - **Visualize Signal Generation:** See real-time buy and sell signals for each integrated indicator directly on the chart.
// - **Adjust Signal Thresholds:** Modify the criteria for what constitutes a buy or sell signal for each indicator, enabling tailored analysis based on specific trading strategies.
// - **Filter and Manipulate Signals:** Enable or disable specific indicators' contributions to the overall buy and sell signals, providing flexibility in signal generation.
// - **Monitor Indicator Behavior:** Utilize debug plots and labels to understand how each indicator reacts to market movements, aiding in strategy optimization.
//
// **Work in Progress:**
// MomentumKit is continuously evolving, with ongoing enhancements to its algorithms and user interface. Current debugging features are designed to offer deep insights for technically adept users, allowing for extensive customization and fine-tuning. Future updates aim to introduce more user-friendly interfaces and automated optimization tools to cater to a broader audience.
//
// **Usage Instructions:**
// - **Visibility Controls:** Users can toggle the visibility of individual indicators to focus on specific momentum metrics as needed.
// - **Parameter Adjustments:** Each indicator comes with customizable parameters, allowing traders to fine-tune the suite according to their trading strategies and market conditions.
// - **Debugging Features:** Enable the debugging mode to visualize individual indicator signals and adjust their contribution to the overall buy/sell signals. This requires a basic understanding of the underlying indicators and their operational thresholds.
//
// **Benefits:**
// - **Simplified Analysis:** Normalization simplifies the process of analyzing multiple indicators, making it easier to identify consistent signals across different momentum measurements.
// - **Improved Decision-Making:** Consensus-based signals backed by multiple normalized indicators provide a higher level of confidence in trading decisions.
// - **Versatility:** Suitable for various trading styles and market conditions, MomentumKit offers a versatile toolset for both novice and experienced traders.
//
// **Technical Requirements:**
// - **Programming Knowledge:** To fully leverage the debugging and signal manipulation features, users should possess a foundational understanding of Pine Script and the mechanics of momentum indicators.
// - **Customization Skills:** Ability to adjust indicator parameters and debug filters to align with specific trading strategies.
//
// **Disclaimer:**
// This indicator suite is intended for educational and analytical purposes only and does not constitute financial advice. Trading involves significant risk, and past performance is not indicative of future results. Always conduct your own analysis or consult a qualified financial advisor before making trading decisions.

MTF Stoch RSI + MACD Summary“MTF Stoch RSI + MACD Summary” is a multi-timeframe momentum and trend analysis indicator designed for TradingView. Its primary function is to consolidate Stochastic RSI and MACD readings from multiple user-defined timeframes—ranging from weekly to intraday—into a compact, color-coded summary table. This allows traders to assess the alignment or divergence of momentum and trend signals across different time horizons within a single chart view, providing an efficient means to identify potential trend continuations or reversals.
The script begins by defining input parameters for both indicators. For the Stochastic RSI, the user can adjust the RSI period, stochastic length, and smoothing factors for K and D lines, while for the MACD, it allows customization of the fast and slow exponential moving average lengths. Additionally, the script offers flexibility through five user-defined timeframes, enabling multi-level signal comparison. Theme and color customization options are also included to enhance visual clarity, allowing users to personalize the display according to preference or chart background.
The computational core of the script calculates the RSI based on a chosen price source (typically the closing price) and applies a stochastic transformation with smoothing to determine momentum extremes—classifying them as overbought, mid-high, mid-low, or oversold depending on their numeric range. The MACD component, computed as the difference between the fast and slow EMAs, is evaluated to determine its state: whether it is crossing upward, crossing downward, above zero, or below zero. These states represent shifts in market momentum and potential trend direction. Both Stochastic RSI and MACD values are retrieved from each selected timeframe using the request.security() function, allowing the indicator to integrate higher and lower timeframe data in real time.
Each indicator reading is then converted into a descriptive label and paired with a specific background color for intuitive visual classification. The script organizes this information into a dynamic table displayed at the top-right corner of the chart. This table consists of three columns—timeframe, Stoch RSI status, and MACD status—and automatically updates with the latest market data on every bar close. Through this tabular format, traders can quickly interpret market conditions without having to switch between multiple charts or apply numerous separate indicators.
Overall, the MTF Stoch RSI + MACD Summary acts as a comprehensive dashboard that integrates momentum and trend indicators across multiple timeframes. By presenting data in a simplified visual layout, it enables traders to make more informed decisions based on the consistency of market signals. This facilitates clearer identification of overbought or oversold conditions, confirmation of trend strength, and early detection of potential reversals, making it a valuable tool for multi-timeframe technical analysis.

Nic RSI + MACD (single pane)📊 SPACE-SAVING COMBINED INDICATOR FOR FREE USERS
This indicator combines RSI and MACD into a single pane, perfect for TradingView users with limited indicator slots. Designed to match the default TradingView styling you're familiar with.
🎯 USE AS A PACKAGE:
For optimal trading analysis, use this indicator together with "Nic SMA 9, SMA 200, 9 count" which displays moving averages and the 9 count on your main chart. Together, these two indicators give you a complete technical analysis setup while staying within the 2-3 indicator limit for free TradingView accounts.
📈 WHAT'S INCLUDED:
✅ RSI (Relative Strength Index) - Top Section:
• Default purple line matching TradingView's built-in RSI
• Reference lines at 30, 50, and 70 levels
• Background shading for overbought (>70) and oversold (<30) zones
• Takes up 55% of the pane for better visibility
• Fully customizable period (default: 14)
✅ MACD (Moving Average Convergence Divergence) - Bottom Section:
• Classic histogram with TradingView's default color scheme:
- Teal/cyan for positive momentum
- Red/pink for negative momentum
• Blue MACD line and orange Signal line
• Clear zero line for easy reference
• Takes up 45% of the pane
• Fully customizable periods (default: 12, 26, 9)
⚙️ CUSTOMIZATION OPTIONS:
• Adjust RSI length and source
• Customize RSI line color
• Adjust MACD fast, slow, and signal periods
• Customize MACD source
• Modify gap size between RSI and MACD sections
💡 WHY USE THIS?
• Saves indicator slots - combines 2 indicators into 1
• Professional appearance matching TradingView defaults
• Clean, uncluttered display
• All the functionality of separate RSI and MACD indicators
• Perfect for traders on free or limited plans
📋 RECOMMENDED SETUP:
1. Add "Nic SMA 9, SMA 200, 9 count" to your main chart (published separately)
2. Add this "Nic RSI top + MACD bottom" indicator
3. Optionally add Volume indicator if you have a slot available
This gives you moving averages, the 9 count, RSI, and MACD - everything you need for comprehensive technical analysis!
🔔 WORKS WITH FREE ACCOUNTS:
Both indicators in the Nic package are designed to maximize your analysis capabilities within TradingView's indicator limits.
#RSI #MACD #TechnicalAnalysis #FreeIndicators #SpaceSaving #CombinedIndicator

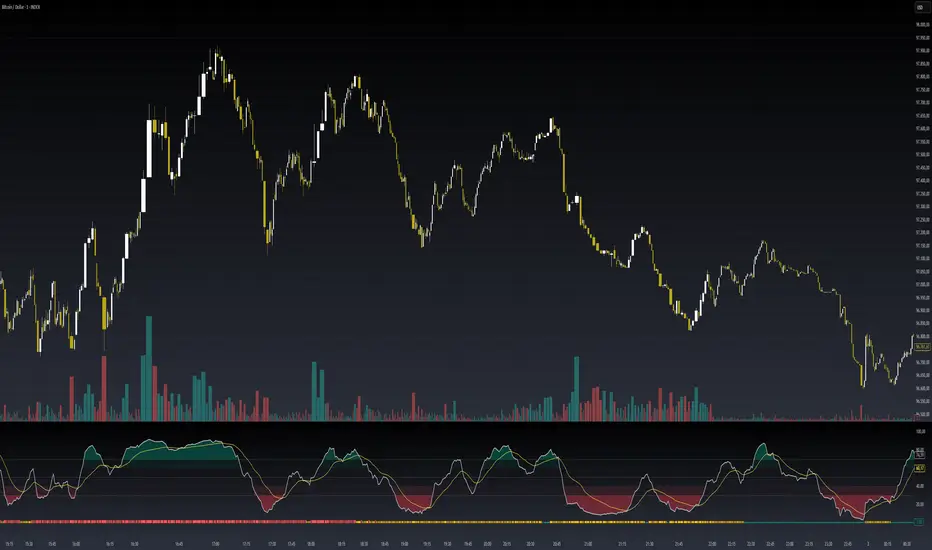
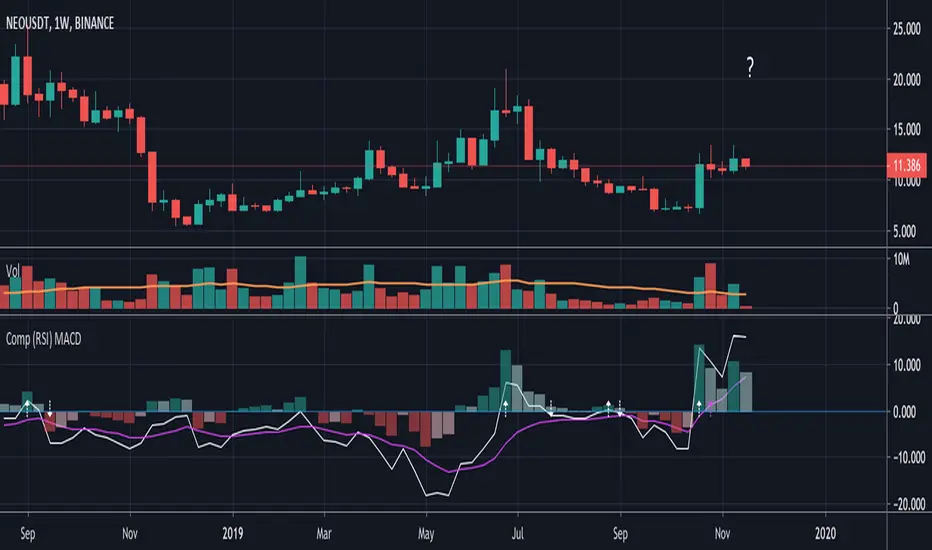
Compare (RSI) MACDHere I've created an indicator which can be used together with my "Compare (RSI) Ticker 3x" Indicator.
It makes it much easier to see the movements between the "RSI Ticker 1" and "RSI Ticker 2/3".
- The white line is the "MACD" of Ticker 1, which is the difference between the "RSI Ticker 1" and "RSI Ticker 2/3".
- The purple line is the "Signal" line, an EMA of the "MACD". (Length is adjustable)
- The "0-line" is the "RSI Ticker 2/3" line, when Ticker 2 is chosen, this will be blue coloured, when Ticker 3 is chosen it will be red.
Because 2 MACD in 1 indicator is way too messy, you only can choose the comparison against Ticker 2 OR Ticker 3.
- In "Settings" > "Inputs" you can enable/disable the second or third Ticker
(If Ticker 2 is enabled, Ticker 3 is disabled and vice versa)
- The second Ticker has multiple choices
- The third you can type any Ticker you want, for example CRYPTOCAP:BNB, BINANCE:ETHUSDT, NASDAQ_DLY:NDX or whatever,
just start typing and you'll see the possibilities (You also can choose between "Cryptocurrencies", "Index", "Forex", ...)
- When the "MACD" crosses the "0-line", arrows will appear, white ones for "MACD", purple ones for the "Signal" line.
- The "Histogram" makes it easier to see the difference between "MACD" and "Signal" line.
- The source of this indicator is adjustable
- When the second chosen Ticker is the same as the first Ticker, of course you will be seeing lines
(because there is no difference between the 2 Tickers, the EMA is visible though)
If you use both "Compare (RSI) Ticker 3x" AND "Compare (RSI) MACD", of course be aware that you have the same Ticker 2 or 3 in each indicator!
Scalper SMA-RSI-MACD – Entry/Exit Signals v2Scalper SMA–RSI–MACD Strategy (Intraday) – Indicator Version
This is an intraday scalping and short-term trading tool designed for manual trading. It provides entry and exit signals based on a combination of trend, momentum, and volatility-based risk management.
Core Components
Trend Filter (Optional)
Uses an EMA (default 200) and an SMA ribbon (5/8/13) to identify the primary trend direction.
Only allows long trades in uptrend and short trades in downtrend (can be turned off for more signals).
Entry Conditions
RSI Pullback: Detects oversold (for long) or overbought (for short) conditions based on a short RSI (default length = 4).
MACD Momentum Turn: Detects bullish or bearish MACD crossovers or momentum shifts.
Both conditions must occur within a specified lookback period (default = last 3 bars).
Stop Loss (SL) Placement
SL is placed at a fixed multiple of the ATR (Average True Range) from the entry price (default = 1.5 × ATR).
Adjusting the multiplier changes how far the SL is placed.
Take Profit (TP) Levels
Two targets: TP1 and TP2, each based on R-multiples of the SL distance.
Default: TP1 = 1 × risk (1:1 R/R), TP2 = 2 × risk (1:2 R/R).
Exit Modes (Selectable)
TP1 or SL
TP2 or SL
Opposite signal (exit when the opposite entry condition appears)
Session Filter (Optional)
Can restrict trading signals to specific market hours (default off for more signals).
Signals and Alerts
Displays LONG and SHORT arrows for entries.
Plots SL and TP levels on the chart.
Marks exits as TP, SL, or opposite signal.
Built-in alertcondition() allows creating TradingView alerts for all entry and exit events.
Typical Usage
Works best on 1-minute to 5-minute charts for scalping; can be adapted to higher timeframes for swing trading.
Ideal for manual execution — the trader sees the signal, checks market conditions, and decides whether to enter.
Can be tuned for more or fewer signals by adjusting RSI thresholds, MACD lookback, and trend filter settings.

Data Trader Stoch | RSI | MACD Strategy IndicatorImplementation of Data Trader's strategy, described in the youtube video, "Highly Profitable Stochastic + RSI + MACD Trading Strategy (Proven 100x)"
Also see Algovibes' video, "Highly Profitable Stochastic + RSI + MACD Trading Strategy? Testing Data Traders strategy in Python"
Note: Despite the claims, it generates barely, if any, signals, certainly in the crypto markets
If there are any mistakes, give feedback in the comments, and I'll fix
### Strategy Summary ###
# Long Signals #
Stoch K and D are oversold
RSI above midline
MACD above signal line
# Short Signals #
Stoch K and D are overbought
RSI below midline
MACD below signal line
# Stop loss and Take Profit #
Stop loss
Longs: below last swing low
Shorts: above last swing high
Take profit at 1.5x stop loss
💰 Aymed55 AI v2 – Para Akışı + RSI + MACD + Alarm→ Para çıkışı + momentum kırılması = SAT ⚠️
📌 What Does This Indicator Do? — Short Summary
The Borsacı AI v2 indicator is designed to detect real money flow in the market.
Its core purpose is simple:
👉 Follow where the money is going — enter early, exit early.
It combines Volume + RSI + MACD to generate highly reliable buy/sell signals.
1) Detects Strong Money Inflow
A BUY condition begins when:
Volume is above 2× the 20-period volume average
Price is moving upward
Volume strength (volume deviation) is positive
→ This means big players are buying.
2) Detects Strong Money Outflow
A SELL condition begins when:
Volume is above 2× the average
Price is falling
→ Means big players are selling.
3) BUY Signal (🚀 AL)
A buy signal is triggered only when ALL of these align:
✔ Strong money inflow
✔ RSI below 70 (not overbought)
✔ MACD bullish crossover (momentum turning up)
→ Result: “Smart money is buying and momentum is shifting upward.”
4) SELL Signal (⚠️ SAT)
A sell signal triggers when:
✔ Money outflow
✔ MACD bearish crossover
→ Result: “Money is leaving and downward momentum is starting.”
5) Background Coloring
Green background = BUY conditions active
Red background = SELL conditions active
6) Alerts Included
TradingView alerts are generated for:
🚀 Buy Signal
⚠️ Sell Signal
🔎 In Summary
This indicator answers one question:
“Where is the money flowing, and when is momentum confirming it?”
It gives early and reliable entry/exit points using a clean, powerful trio:
👉 Volume + RSI + MACD
If you want, I can also write a full English description for TradingView’s description box or a marketing-style product description.

Super 6x: RSI, MACD, Stoch, Loxxer, CCI, & Velocity [Loxx]Super 6x: RSI , MACD , Stoch , Loxxer, CCI , & Velocity is a combination of 6 indicators into one histogram. This includes the option to allow repainting.
What is MACD?
Moving average convergence divergence ( MACD ) is a trend-following momentum indicator that shows the relationship between two moving averages of a security’s price. The MACD is calculated by subtracting the 26-period exponential moving average ( EMA ) from the 12-period EMA .
What is CCI?
The Commodity Channel Index ( CCI ) measures the current price level relative to an average price level over a given period of time. CCI is relatively high when prices are far above their average. CCI is relatively low when prices are far below their average. Using this method, CCI can be used to identify overbought and oversold levels.
What is RSI?
The relative strength index is a technical indicator used in the analysis of financial markets. It is intended to chart the current and historical strength or weakness of a stock or market based on the closing prices of a recent trading period. The indicator should not be confused with relative strength .
What is Stochastic?
The stochastic oscillator, also known as stochastic indicator, is a popular trading indicator that is useful for predicting trend reversals. It also focuses on price momentum and can be used to identify overbought and oversold levels in shares, indices, currencies and many other investment assets.
What is Loxxer?
The Loxxer indicator is a technical analysis tool that compares the most recent maximum and minimum prices to the previous period's equivalent price to measure the demand of the underlying asset.
What is Velocity?
In simple words, velocity is the speed at which something moves in a particular direction. For example as the speed of a car travelling north on a highway, or the speed a rocket travels after launching.
How to use
Long signal: All 4 indicators turn green
Short signal: All 4 indicators turn red
Included
Bar coloring
Alerts

AL-SAT (Dönüş Odaklı: EMA+RSI+MACD)AL-SAT (Reversal Focused: EMA+RSI+MACD) combines three indicators to catch trend reversals.
- EMA50/200 crossovers define the main trend.
- RSI (14) confirms oversold/overbought reversals.
- MACD crossovers confirm momentum shifts.
Signals are generated at crossover points and remain valid until the opposite signal appears.
Best used on 1D or 4H timeframes. Works well for spotting early trend reversals, but may produce noise in sideways markets.

GSO + RSI + MACD + MFI + Bollinger BandsThis script uses a Gann Swing Oscillator , RSI , MACD , MFI and Bollinger Bands to generate long and short signals for cryptocurrencies on the 5 minute chart.
The Gann Swing Oscillator was inspired by HPotter's GSO.
This script is for educational purposes only. This script is NOT to be used as financial advice. I will not accept liability for any losses which may occur as a result of using this script.

COLLAR - RSI MACD EMACOLLAR - RSI MACD EMA
I created this "COLLAR" script by combining scripts from others.
Mentor Piet Vannoppen uses the COLLAR-technique in TC2000 to analyse charts. Because it didn't exist in TradingView, I created it. ; )
In the mean time my friend Vinpierke also created a script for the COLLAR-technique, in which he uses 4 colors.
Check these scripts. If you like it/them or have tips, let me/us know!

RSI MACDDifferent Perspective : By using the RSI as the source for MACD calculation, you are incorporating the RSI's characteristics into the MACD indicator. The RSI measures the speed and change of price movements, while the MACD focuses on the convergence and divergence of moving averages. Combining these two indicators may provide a different perspective on market conditions.
Smoothed MACD : Since the RSI is being used as the source for the MACD calculation, the resulting MACD line (macd1 in the code) may exhibit smoother movements compared to a traditional MACD calculated directly from price data. This smoothing effect could potentially help filter out noise and provide a clearer representation of trend changes.
RSI Confirmation : The RSI is often used to identify overbought and oversold conditions. By incorporating the RSI into the MACD calculation, you can potentially gain additional confirmation when the MACD line crosses above or below zero. For example, if the MACD line crosses above zero and the RSI is in an oversold region, it could provide stronger confirmation for a bullish signal.
Example:

RSI MACD Same RatioこのインジケータはRSIとMACDを同比率で表示するものです。
なぜ同比率で表示するのでしょうか。
同比率で表示することでRSIとMACDのダイバージェンスを同時に確認することができます。
私には思いつきませんが、他にも使い道はあるかもしれません。
必要と感じた場合はぜひ使ってみてください。
※同比率で表示するためにRSIとMACDの値を変更しています。
そのため、値はあくまで参考程度にご覧ください。
注目すべきはラインのみです。
使う場合は「adjustment ratio」に適当な値を入れて、RSIの比率とMACDの比率を合わせてください。
それでは良いトレードライフを。
-----
This indicator shows RSI and MACD in equal proportions.
Why are they displayed at the same ratio?
By displaying at the same ratio, you can check the divergence of RSI and MACD at the same time.
I can't think of it, but there may be other uses.
If you feel it is necessary, please use it.
caution!
The RSI and MACD values are changed to display the same ratio.
Therefore, please see the values for reference only.
Only the line should be noted.
When using it, enter an appropriate value in "adjustment ratio" and match the RSI ratio with the MACD ratio.
Let's have a good trade life.
