DAMA OSC - Directional Adaptive MA OscillatorOverview:
The DAMA OSC (Directional Adaptive MA Oscillator) is a highly customizable and versatile oscillator that analyzes the delta between two moving averages of your choice. It detects trend progression, regressions, rebound signals, MA cross and critical zone crossovers to provide highly contextual trading information.
Designed for trend-following, reversal timing, and volatility filtering, DAMA OSC adapts to market conditions and highlights actionable signals in real-time.
Features:
Support for 11 custom moving average types (EMA, DEMA, TEMA, ALMA, KAMA, etc.)
Customizable fast & slow MA periods and types
Histogram based on percentage delta between fast and slow MA
Trend direction coloring with “Green”, “Blue”, and “Red” zones
Rebound detection using close or shadow logic
Configurable thresholds: Overbought, Oversold, Underbought, Undersold
Optional filters: rebound validation by candle color or flat-zone filter
Full visual overlay: MA lines, crossover markers, rebound icons
Complete alert system with 16 preconfigured conditions
How It Works:
Histogram Logic:
The histogram measures the percentage difference between the fast and slow MA:
hist_value = ((FastMA - SlowMA) / SlowMA) * 100
Trend State Logic (Green / Blue / Red):
Green_Up = Bullish acceleration
Blue_Up (or Red_Up, depending the display settings) = Bullish deceleration
Blue_Down (or Green_Down, depending the display settings) = Bearish deceleration
Red_Down = Bearish acceleration
Rebound Logic:
A rebound is detected when price:
Crosses back over a selected MA (fast or slow)
After being away for X candles (rebound_backstep)
Optional: filtered by histogram zones or candle color
Inputs:
Display Options:
Show/hide MA lines
Show/hide MA crosses
Show/hide price rebounds
Enable/disable blue deceleration zones
DAMA Settings:
Fast/Slow MA type and length
Source input (close by default)
Overbought/Oversold levels
Underbought/Undersold levels
Rebound Settings:
Use Close and/or Shadow
Rebound MA (Fast/Slow)
Candle color validation
Flat zone filter rebounds (between UnderSold and UnderBought)
Available MA type:
SMA (Simple MA)
EMA (Exponential MA)
DEMA (Double EMA)
TEMA (Triple EMA)
WMA (Weighted MA)
HMA (Hull MA)
VWMA (Volume Weighted MA)
Kijun (Ichimoku Baseline)
ALMA (Arnaud Legoux MA)
KAMA (Kaufman Adaptive MA)
HULLMOD (Modified Hull MA, Same as HMA, tweaked for Pine v6 constraints)
Notes:
**DEMA/TEMA** reduce lag compared to EMA, useful for faster reaction in trending markets.
**KAMA/ALMA** are better suited to noisy or volatile environments (e.g., BTC).
**VWMA** reacts strongly to volume spikes.
**HMA/HULLMOD** are great for visual clarity in fast moves.
Alerts Included (Fully Configurable):
Golden Cross:
Fast MA crosses above Slow MA
Death Cross:
Fast MA crosses below Slow MA
Bullish Rebound:
Rebound from below MA in uptrend
Bearish Rebound:
Rebound from above MA in downtrend
Bull Progression:
Transition into Green_Up with positive delta
Bear Progression:
Transition into Red_Down with negative delta
Bull Regression:
Exit from Red_Down into Blue/Green with negative delta
Bear Regression:
Exit from Green_Up into Blue/Red with positive delta
Crossover Overbought:
Histogram crosses above Overbought
Crossunder Overbought:
Histogram crosses below Overbought
Crossover Oversold:
Histogram crosses above Oversold
Crossunder Oversold:
Histogram crosses below Oversold
Crossover Underbought:
Histogram crosses above Underbought
Crossunder Underbought:
Histogram crosses below Underbought
Crossover Undersold:
Histogram crosses above Undersold
Crossunder Undersold:
Histogram crosses below Undersold
Credits:
Created by Eff_Hash. This code is shared with the TradingView community and full free. do not hesitate to share your best settings and usage.
In den Scripts nach "N+credit最新动态" suchen

Multi-Timeframe ATR Levels by Hitesh2603Description:
"Multi-Timeframe ATR Levels by Hitesh2603" is a versatile and adaptive indicator designed to help traders identify key price levels based on the Average True Range (ATR) from a higher timeframe. The script automatically adapts to the current chart’s timeframe and allows you to customize the higher timeframe for ATR calculations, making it ideal for intraday and swing trading strategies.
The indicator plots upper and lower price levels based on the ATR multiplier, providing clear visual cues for potential profit-taking or exit points. It also includes features like editable timeframe presets , historical level plotting , labels , and alerts , making it a powerful tool for traders of all experience levels.
---
Key Features:
1. Automatic Timeframe Adaptation : - The script automatically detects the current chart’s timeframe and selects the appropriate higher timeframe for ATR calculations.
2. Editable Preset Timeframe Pairs : - Customize the higher timeframe for each chart timeframe directly in the indicator settings.
3. Dynamic ATR-Based Levels :- Plots upper and lower price levels using the formula:
- Upper Level = Current Candle Open + (Previous Candle ATR * Multiplier)
- Lower Level = Current Candle Open - (Previous Candle ATR * Multiplier)
4. Customizable Inputs :
- Adjust ATR length, multiplier, line length, colors, and more.
5. Labels :
- Displays the exact values of the upper and lower levels for easy reference.
6. Historical Levels :
- Optionally plots historical levels for all candles.
7. Alerts :
- Get notified when the price crosses the upper or lower levels.
---
Use Cases:
1. Intraday Trading :
- Use the script on a 5-minute or 15-minute chart with a 1-hour higher timeframe to identify intraday profit-taking or exit points.
2. Swing Trading :
- Use the script on a 1-hour or 4-hour chart with a daily higher timeframe to identify swing trading opportunities.
3. Position Trading :
- Use the script on a daily chart with a weekly higher timeframe to identify key levels for position trading.
4. Breakout Confirmation :
- Use the upper and lower levels as confirmation points for breakouts or reversals.
5. Risk Management :
- Use the levels to set stop-loss or take-profit targets based on market volatility.
---
How to Use:
1. Add the Script to Your Chart :
- Search for "Multi-Timeframe ATR Levels by Hitesh2603" in the TradingView indicator library and add it to your chart.
2. Customize the Settings :
- Adjust the inputs (e.g., ATR length, multiplier, line length, colors, etc.) to suit your trading strategy.
3. Set the Higher Timeframe :
- The script will automatically display an input for the higher timeframe based on the current chart’s timeframe. Customize it as needed.
4. Interpret the Levels :
- The script will plot two horizontal lines (upper and lower levels) on the chart. Use these levels for profit-taking, exits, or breakout confirmation.
5. Enable Alerts :
- Set up alerts to get notified when the price crosses the upper or lower levels.
---
Input Parameters:
1. ATR Length :
- The period used to calculate the ATR (default: 14).
2. ATR Multiplier :
- The multiplier applied to the ATR to calculate the levels (default: 0.65).
3. Line Length :
- The number of candles to extend the lines (default: 10).
4. Show Labels :
- Toggle to display the exact values of the levels (default: true).
5. Show Historical Levels :
- Toggle to plot historical levels for all candles (default: false).
6. Line Colors :
- Customize the colors of the upper and lower levels.
7. Line Width :
- Adjust the thickness of the lines (default: 2).
---
Example:
- Current Chart : 5-minute
- Higher Timeframe : 1-hour
- Previous Hour’s ATR : 4.6
- Current Hour’s Open : 102
- Multiplier : 0.65
Levels :
- Upper Level = 102 + (4.6 * 0.65) = 105.0
- Lower Level = 102 - (4.6 * 0.65) = 99.0
The script will plot horizontal lines at 105.0 and 99.0 on the 5-minute chart.
---
Alerts:
- Price Crosses Upper Level :
- Triggered when the price crosses above the upper level.
- Price Crosses Lower Level :
- Triggered when the price crosses below the lower level.
---
Notes:
- The script is designed to be flexible and adaptable to various trading styles and timeframes.
- Always backtest and validate the indicator with your trading strategy before using it in live trading.
---
Credits:
- Developed by Hitesh2603 .
- Special thanks to the TradingView community for inspiration and support.

Live Economic CalendarLive Economic Calendar
This TradingView indicator provides real-time economic news events directly on your charts, helping traders stay informed about key market-moving data. Built on the original Forex Factory utility by toodegrees, this version enhances functionality with customizable alerts and improved visualizations.
Key Features:
Real-Time Economic News: Displays upcoming economic events from Forex Factory, categorized by impact level (High, Medium, Low, Holiday).
Custom Alerts: Set alerts before and after news events to stay prepared for market volatility.
Timezone Adjustments: Adjust news event times to match your local timezone for accurate scheduling.
Currency-Specific News: Automatically filters news based on the currency pair you’re viewing, with manual options for specific currencies.
Flexible Display Options: Choose to display news for today, this week, or a custom period. Customize labels, lines, and tables directly on the chart.
Impact Visualization: Visual cues (lines, labels, background shading) for different impact levels to highlight significant market events.
Credits:
• Original Forex Factory Utility by toodegrees
• Alerts and enhancements by Nachodog
This Pine Script™ code is licensed under the Mozilla Public License 2.0: mozilla.org

Zanger Volume Ratio (ZVR)Zanger Volume Ratio (ZVR)
Credits:
Most of the underlying code and logic in this script have been adapted from the work originally published by The_Peaceful_Lizard
Overview
The Zanger Volume Ratio (ZVR) is a powerful indicator designed to reveal market dynamics by comparing current cumulative volume to an average determined over a historical look-back period. It uses the concept of relative volume to not only highlight unusual volume spikes, but also uses color to illustrate how today's trading compares to typical levels. This unique method of volume analysis was popularized by Dan Zanger - a trader known for turning $10,775 into $18,000,000 in less than two years - by identifying key shifts in market interest and volume behavior.
Key Features
Volume Pacing Analysis:
The script calculates a volume delta by comparing the cumulative volume at any given moment to an average derived over a user-defined lookback period (Default 20-day). The resulting percentage difference offers a clear visualization and insight into unusual volume activity.
Dynamic Visual Representation:
Choose between either “Columns” or “Area” plot styles to display the percent difference. Additionally, you have the option to switch between a standard plot or a background color display, with customizable transparency, ensuring the indicator fits seamlessly with your chart’s aesthetics.
Dashboard Integration:
A simple dashboard table is displayed on the chart, showcasing the current ZVR value in real-time. With user-configurable position, text size, alignment, and color options, this feature ensures that the key metric is always visible and easy to interpret.
Why Use the Zanger Volume Ratio?
The ZVR is more than just a volume indicator. It acts as a window into market sentiment by highlighting days when trading interest intensifies. Many traders believe that an unusually high volume ratio may confirm trend strength or signal a reversal, making the indicator a valuable tool when used in conjunction with other technical analysis methods.
Whether you’re monitoring stocks, commodities, or forex markets, the Zanger Volume Ratio offers an accessible yet sophisticated method to decode volume dynamics. Its practical design and real-time visual feedback provide traders of all experience levels with critical data to spot high-potential setups.
Chart Description
First Pane: normal Volume Indicator on the foreground, ZVR as Background colors
Second Pane: ZVR Indicator with Column Style (default)
First panel: normal volume indicator in foreground, ZVR as background colors
Second panel: ZVR indicator with column style (default)
Note: This indicator is intended for use on intraday charts only!

Dynamic Market Structure DetectorTitle: Dynamic Market Structure Detector – Real-Time BoS & ChoCH Signals
Short Description:
Identify market structure dynamically with real-time Break of Structure (BoS) and Change of Character (ChoCH) signals. Highlight untested support and resistance zones to improve trading precision.
Full Description:
The Dynamic Market Structure Detector is a powerful TradingView indicator designed for traders who want to automate the identification of key market structure levels. This indicator simplifies market analysis by dynamically tracking swing highs and lows, marking critical Break of Structure (BoS) and Change of Character (ChoCH) points, and highlighting untested support and resistance zones.
Key Features:
1. Real-Time Signals:
• Marks Break of Structure (BoS) and Change of Character (ChoCH) points as they occur.
• Automatically updates as the market evolves.
2. Dynamic Swing Highs and Lows:
• Tracks swing highs and lows based on user-defined sensitivity (Swing Length).
• Adjust swing length to tailor signals for intraday or swing trading.
3. Untested Zones Highlight:
• Visualize untested support and resistance zones dynamically.
• Opacity settings allow customization for better chart readability.
4. Customizable Inputs:
• Swing Length:
Adjust the sensitivity of BoS and ChoCH signals.
• Smaller Swing Length values (e.g., 3–5): Capture short-term market movements, ideal for intraday trading.
• Larger Swing Length values (e.g., 10–20): Focus on significant market structure changes for swing or positional trading.
Experiment with these values to find the best fit for your trading style.
• Untested Zone Opacity:
Control the visibility of highlighted support and resistance zones.
• Lower opacity values (e.g., 10–50): Make the zones more prominent, helpful for darker chart backgrounds.
• Higher opacity values (e.g., 70–90): Provide subtle highlights, better suited for lighter chart setups.
• A value of 100% renders the zones completely transparent (invisible).
Use this setting to customize the visual appearance of your chart while still retaining key zone information.
5. User-Friendly Visualization:
• Color-coded labels for BoS (Green) and ChoCH (Red).
• Highlight zones for untested areas using customizable colors (Support: Blue, Resistance: Orange).
Why Use This Indicator?
• Simplifies market structure analysis by automating key calculations.
• Helps traders identify potential trend reversals and continuation points.
• Reduces the need for manual charting, saving time and effort.
• Provides visual clarity on untested zones for better decision-making.
Recommended Usage:
• Intraday Traders: Use smaller Swing Length values (e.g., 3–5) to capture short-term market movements.
• Swing Traders: Opt for higher Swing Length values (e.g., 10–20) to focus on larger market structure changes.
• Monitor untested zones for potential price reactions, enhancing your trade entries and exits.
Notes :
This indicator is best suited for traders who prefer price action trading and market structure analysis. While the indicator provides reliable insights, it is recommended to use it in conjunction with other analysis tools for a holistic trading approach.
Credits:
Developed by TradeTech Analysis to empower traders with automated tools for smarter trading decisions.

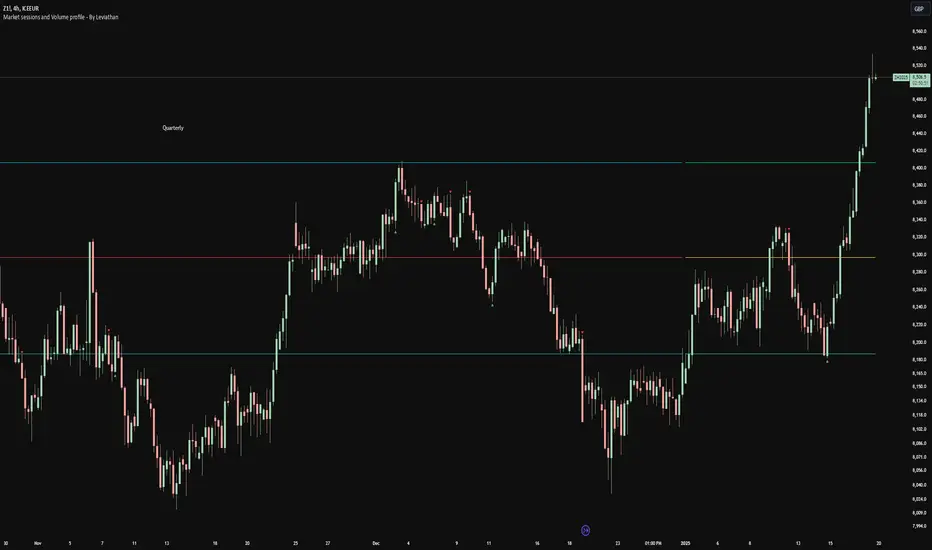
Volume profile [Signals] - By Leviathan [Mindyourbuisness]Market Sessions and Volume Profile with Sweep Signals - Based on Leviathan's Volume Profile
This indicator is an enhanced version of Leviathan's Volume Profile indicator, adding session-based value area analysis and sweep detection signals. It combines volume profile analysis with market structure concepts to identify potential reversal opportunities.
Features
- Session-based volume profiles (Daily, Weekly, Monthly, Quarterly, Yearly)
- Forex sessions support (Tokyo, London, New York)
- Value Area analysis with POC, VAH, and VAL levels
- Extended level visualization for the last completed session
- Sweep detection signals for key value area levels
Sweep Signals Explanation
The indicator detects two types of sweeps at VAH, VAL, and POC levels:
Bearish Sweeps (Red Triangle Down)
Conditions:
- Price makes a high above the level (VAH/VAL/POC)
- Closes below the level
- Closes below the previous candle's low
- Previous candle must be bullish
Trading Implication: Suggests a failed breakout and potential reversal to the downside. These sweeps often indicate stop-loss hunting above key levels followed by institutional selling.
Bullish Sweeps (Green Triangle Up)
Conditions:
- Price makes a low below the level (VAH/VAL/POC)
- Closes above the level
- Closes above the previous candle's high
- Previous candle must be bearish
Trading Implication: Suggests a failed breakdown and potential reversal to the upside. These sweeps often indicate stop-loss hunting below key levels followed by institutional buying.
Trading Guidelines
1. Use sweep signals in conjunction with the overall trend
2. Look for additional confirmation like:
- Volume surge during the sweep
- Price action patterns
- Support/resistance levels
3. Consider the session's volatility and time of day
4. More reliable signals often occur at VAH and VAL levels
5. POC sweeps might indicate stronger reversals due to their significance as fair value levels
Notes
- The indicator works best on higher timeframes (1H and above)
- Sweep signals are more reliable during active market hours
- Consider using multiple timeframe analysis for better confirmation
- Past performance is not indicative of future results
Credits: Original Volume Profile indicator by Leviathan
M2 Global Liquidity Index - Time-Shift - KHM2 Global Liquidity Index - Enhanced Time-Shift Indicator
Based on original work by @Mik3Christ3ns3n
Enhanced with advanced time-shift functionality and overlay capabilities.
Description:
This indicator tracks and visualizes the global M2 money supply from five major economies, allowing precise time-shift analysis for correlation studies. All values are converted to USD in real-time and aggregated to provide a comprehensive view of global liquidity conditions.
Key Features:
- Advanced time-shift capability (-1000 to +1000 days) with shape preservation
- Real-time currency conversion to USD
- Overlay functionality with main chart
- Right-scale display for better comparison
- Full historical data preservation during time shifts
Components Tracked:
- US M2 Money Supply (USM2)
- China M2 Money Supply (CNM2)
- Eurozone M2 Money Supply (EUM2)
- Japan M2 Money Supply (JPM2)
- UK M2 Money Supply (GBM2)
Primary Use Cases:
1. Correlation Analysis:
- Compare global liquidity trends with asset prices
- Identify leading/lagging relationships through time-shift
- Study monetary policy impacts across different time periods
2. Market Analysis:
- Track global liquidity conditions
- Monitor central bank policy effects
- Identify potential macro trend changes
Settings:
- Time Offset: Shift the M2 data backwards or forwards (-1000 to +1000 days)
- Positive values: Move M2 data into the future
- Negative values: Move M2 data into the past
- Zero: Current alignment
Technical Notes:
- Data updates follow central banks' M2 publication schedules
- All currency conversions performed in real-time
- Historical shape preservation during time-shifts
- Enhanced data consistency through lookahead mechanism
Credits:
Original concept and base code by @Mik3Christ3ns3n
Enhanced version includes advanced time-shift capabilities and shape preservation
License:
Pine Script™ code is subject to the terms of the Mozilla Public License 2.0
#M2 #GlobalLiquidity #MoneySupply #Macro #CentralBanks #MonetaryPolicy #TimeShift #Correlation #TradingIndicator #MacroAnalysis #LiquidityAnalysis #MarketIndicator

Eze Profit Range Detection FilterThe Range Detection Filter is a technical analysis tool designed to help traders identify range-bound market conditions and focus on breakout opportunities. It combines the ATR (Average True Range) for volatility analysis and the ADX (Average Directional Index) for trend strength evaluation to highlight consolidation phases and alert traders when the market is ready to break out.
This indicator provides visual cues and customizable alerts, making it suitable for traders looking to avoid false signals during choppy markets and capitalize on trending moves following a breakout.
What Makes It Unique?
ATR for Volatility:
Measures market volatility by comparing ATR with its moving average.
Consolidation phases are flagged when ATR remains below its moving average for a sustained period.
ADX for Trend Strength:
Monitors trend strength, confirming range-bound conditions when ADX falls below a user-defined threshold (default: 20).
Combines with ATR to ensure accurate detection of trendless periods.
Breakout Alerts:
Notifies traders of breakout opportunities when the price moves outside the highest high or lowest low of the range.
How It Works:
Range Detection:
The market is considered "in range" when:
ATR is below its moving average, indicating low volatility.
ADX is below the threshold, confirming a lack of trend strength.
Visual Indication:
A yellow background highlights range-bound conditions, allowing traders to avoid low-probability trades.
Breakout Detection:
Alerts are triggered for breakouts above or below the range to help traders identify potential opportunities.
Features:
Range Highlighting:
Automatically detects and highlights range-bound markets using a yellow background.
Breakout Alerts:
Sends alerts for breakouts above or below the range once the market exits consolidation.
Customizable Inputs:
ATR length, moving average length, and ADX parameters are fully adjustable to adapt to various trading styles and asset classes.
Multi-Timeframe Compatibility:
Suitable for all markets and timeframes, including stocks, forex, and cryptocurrencies.
How to Use:
Identify Ranges:
Avoid trading when the yellow background appears, signaling a range-bound market.
Focus on Breakouts:
Look for alerts indicating breakouts above or below the range for potential trending opportunities.
Combine with Other Indicators:
Use volume analysis, momentum oscillators, or candlestick patterns to confirm breakout signals.
Credits:
This script utilizes widely accepted methodologies for ATR and ADX calculations. ADX is calculated manually using directional movement (+DI and -DI) for precise trend detection. The concept has been adapted and enhanced to create this comprehensive range-detection tool.
Notes:
This indicator is intended for educational purposes and should not be used as standalone financial advice.
Always incorporate this tool into a broader trading strategy for optimal results.

Eze Profit - VWAP + MACD Combined SignalThe Eze Profit - VWAP + MACD Combined Signal is an advanced trading tool designed to help traders align price trends with momentum confirmation for better decision-making. By combining Volume-Weighted Average Price (VWAP) and Moving Average Convergence Divergence (MACD), this indicator provides clear entry and exit signals, allowing traders to follow trends and take advantage of momentum shifts.
How It Works:
VWAP:
VWAP represents the average price of an asset, weighted by volume, over a specific period.
It acts as a dynamic support/resistance level and trend filter. Price above VWAP indicates bullish conditions, while price below VWAP suggests bearish conditions.
MACD:
MACD measures momentum through the difference between fast and slow exponential moving averages (EMAs).
Signals are generated when the MACD line crosses its signal line:
Bullish Crossover: Indicates increasing upward momentum.
Bearish Crossunder: Indicates increasing downward momentum.
Combined Logic:
Long Signal: Triggered when price is above VWAP, and MACD exhibits a bullish crossover.
Short Signal: Triggered when price is below VWAP, and MACD exhibits a bearish crossunder.
The script tracks the trader's "in-position" state to prevent redundant signals and ensure clarity.
How to Use:
Use this script to identify potential long and short trading opportunities:
Buy Signal: Enter a long position when the price moves above VWAP and MACD confirms bullish momentum.
Sell Signal: Exit or short when the price drops below VWAP and MACD confirms bearish momentum.
Combine with additional tools like support/resistance, volume analysis, or candlestick patterns for confirmation.
Features:
VWAP Trend Filter: Dynamically adjusts to the trading session to identify overall trend direction.
MACD Momentum Confirmation: Detects key momentum shifts with configurable settings for fast, slow, and signal lengths.
Position State Tracking: Avoids signal redundancy by monitoring open positions.
Buy/Sell Visualizations: Plots Buy/Sell signals directly on the chart for ease of use.
Alerts: Notifies traders in real-time when a long or short signal is triggered.
Customizable Settings:
MACD Fast Length, Slow Length, and Signal Smoothing parameters.
VWAP timeframe resolution to adapt to different trading styles (e.g., intraday or daily).
Credits:
This script is based on standard VWAP and MACD calculations provided by TradingView’s library and has been enhanced with unique logic for combined signal generation.
Notes:
This indicator is intended for educational purposes and should not be considered financial advice. Use it as part of a broader trading strategy alongside other tools for optimal results.

Zero-Lag MA Trend FollowingScript Name: Zero-Lag MA Trend Following Auto-Trading
Purpose and Unique Features:
This script is designed to implement a trend-following auto-trading strategy by combining the Zero-Lag Moving Average (ZLMA), Exponential Moving Average (EMA), and ATR Bands. To differentiate it from similar scripts, the following key aspects are emphasized:
Zero-Lag MA (ZLMA):
Responds quickly to price changes, minimizing lag compared to EMA.
Detects crossovers with EMA and generates Diamond Signals to indicate trend reversals.
ATR Bands:
Measures market volatility to set stop-loss levels.
Helps optimize entry points and manage risk effectively.
Diamond Signals:
A vital visual cue indicating the early stages of trend reversals.
Green diamonds signal an uptrend, while red diamonds signal a downtrend.
Each component plays a distinct role, working synergistically to enhance trend detection and risk management. This system doesn’t merely combine indicators but optimizes them for comprehensive trend-following and risk control.
Usage Instructions:
Entry Conditions:
Long Entry:
Enter when a green Diamond Signal appears (ZLMA crosses above EMA).
Short Entry:
Enter when a red Diamond Signal appears (ZLMA crosses below EMA).
Exit Conditions:
Stop Loss:
Set at the lower boundary of the ATR band for BUY or the upper boundary for SELL at entry.
Take Profit:
Automatically executed based on a 1:2 risk-reward ratio.
Account Size: ¥100,0000
Commissions and Slippage: Assumed commission of 90 pips per trade and slippage of 1 pip.
Risk per Trade: 10% of account equity (adjustable based on risk tolerance).
Improvements and Original Features:
While based on open-source code, this script incorporates the following critical enhancements:
Diamond Signals from ZLMA and EMA Integration:
Improves entry accuracy with a proprietary trend detection strategy.
ATR Bands Utilization:
Adds a volatility-based risk management function.
Optimized Visual Entry Signals:
Includes plotted triangles (▲, ▼) to clearly indicate trend-following entry points.
Credits:
This script builds upon indicators developed by ChartPrime, whose innovative approach and insights have enabled a more advanced trend-following strategy. We extend our gratitude for their foundational work.
Additionally, it integrates technical methods based on Zero-Lag Moving Average (ZLMA), EMA, and ATR Bands, leveraging insights from the trading community.
Chart Display Options:
The script offers options to toggle the visual signals (Diamond Signals, trend lines, and entry points) on or off, keeping the chart clean while maximizing analytical efficiency.
Disclaimer:
This script is provided for educational purposes and past performance does not guarantee future results.
Use it responsibly with proper risk management.

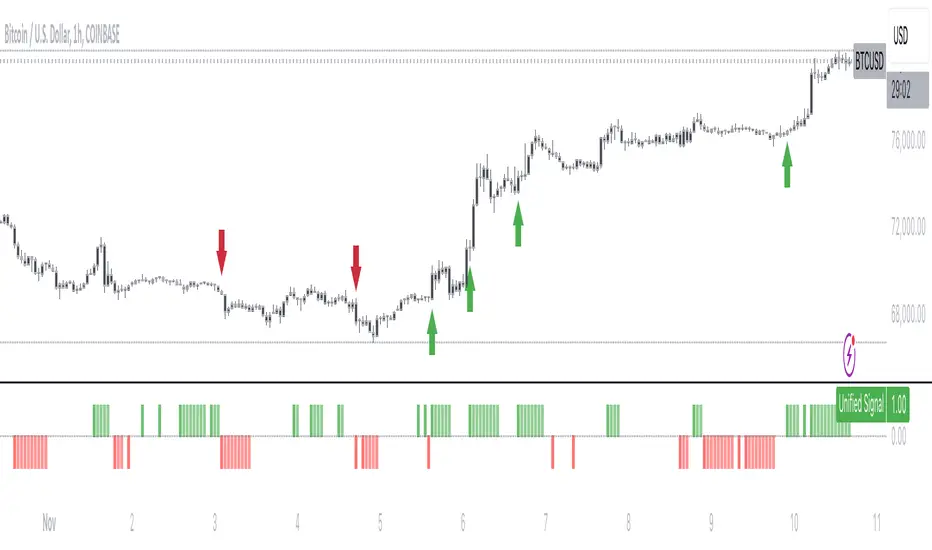
Volume Flow ConfluenceVolume Flow Confluence (CMF-KVO Integration)
Core Function:
The Volume Flow Confluence Indicator combines two volume-analysis methods: Chaikin Money Flow (CMF) and the Klinger Volume Oscillator (KVO). It displays a histogram only when both indicators align in their respective signals.
Signal States:
• Green Bars: CMF is positive (> 0) and KVO is above its signal line
• Red Bars: CMF is negative (< 0) and KVO is below its signal line
• No Bars: When indicators disagree
Technical Components:
Chaikin Money Flow (CMF):
Measures the relationship between volume and price location within the trading range:
• Calculates money flow volume using close position relative to high/low range
• Aggregates and normalizes over specified period
• Default period: 20
Klinger Volume Oscillator (KVO):
Evaluates volume in relation to price movement:
• Tracks trend changes using HLC3
• Applies volume force calculation
• Uses two EMAs (34/55) with a signal line (13)
Practical Applications:
1. Signal Identification
- New colored bars after blank periods show new agreement between indicators
- Color intensity differentiates new signals from continuations
- Blank spaces indicate lack of agreement
2. Trend Analysis
- Consecutive colored bars show continued indicator agreement
- Transitions between colors or to blank spaces show changing conditions
- Can be used alongside other technical analysis tools
3. Risk Considerations
- Signals are not predictive of future price movement
- Should be used as one of multiple analysis tools
- Effectiveness may vary across different markets and timeframes
Technical Specifications:
Core Algorithm
CMF = Σ(((C - L) - (H - C))/(H - L) × V)n / Σ(V)n
KVO = EMA(VF, 34) - EMA(VF, 55)
Where VF = V × |2(dm/cm) - 1| × sign(Δhlc3)
Signal Line = EMA(KVO, 13)
Signal Logic
Long: CMF > 0 AND KVO > Signal
Short: CMF < 0 AND KVO < Signal
Neutral: All other conditions
Parameters
CMF Length = 20
KVO Fast = 34
KVO Slow = 55
KVO Signal = 13
Volume = Regular/Actual Volume
Data Requirements
Price Data: OHLC
Volume Data: Required
Minimum History: 55 bars
Recommended Timeframe: ≥ 1H
Credits:
• Marc Chaikin - Original CMF development
• Stephen Klinger - Original KVO development
• Alex Orekhov (everget) - CMF script implementation
• nj_guy72 - KVO script implementation
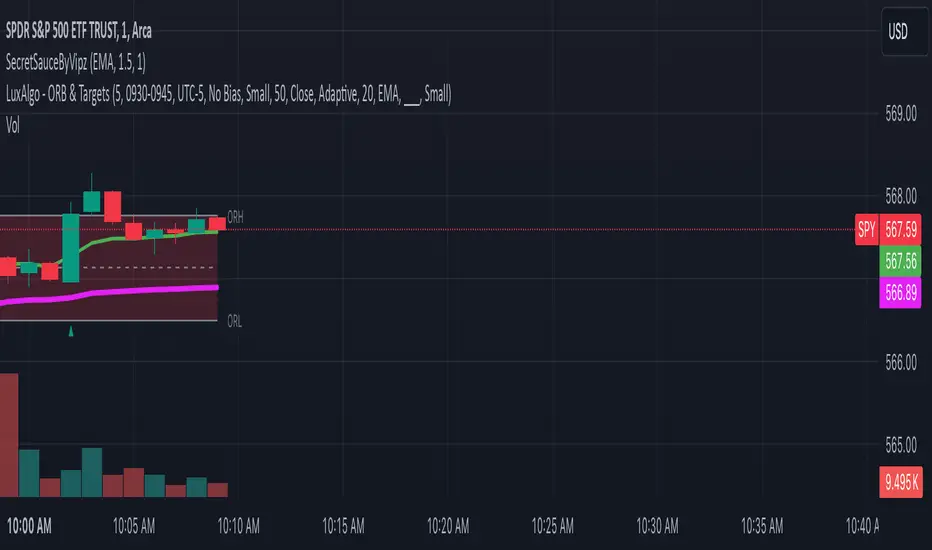
SecretSauceByVipzOverview:
SecretSauceByVipz is a sophisticated trading indicator designed to help traders identify high-probability buy and sell signals by integrating multiple technical analysis tools. By combining Exponential Moving Averages (EMAs), Average True Range (ATR) buffer zones, Volume Weighted Average Price (VWAP), and Relative Strength Index (RSI) momentum confirmation, this indicator aims to reduce false signals and enhance trading decisions.
Key Features:
Exponential Moving Averages (EMAs):
200-period EMA (Long EMA): Serves as a long-term trend indicator.
8-period EMA (Fast EMA): Captures short-term price movements.
21-period EMA (Slow EMA): Reflects medium-term price trends.
EMA Crossovers: Generates initial buy/sell signals when the fast EMA crosses over or under the slow EMA.
ATR-Based Buffer Zones:
ATR Calculation: Utilizes a 14-period ATR to measure market volatility.
Buffer Zone Multiplier: User-adjustable multiplier (default 1.0) applied to the ATR to create dynamic buffer zones around the 200 EMA.
Buffer Zones: Helps filter out false signals by requiring price to move beyond these zones for certain signals.
Volume Weighted Average Price (VWAP):
VWAP Plotting: Provides an average price weighted by volume, useful for identifying fair value areas and potential support/resistance levels.
Signal Confirmation Logic:
Confirmation Candle: Requires the next candle after a crossover to close in the signal's direction for added reliability.
Early Signals: Triggers when price crosses the 200 EMA and moves beyond the buffer zone, indicating potential early trend changes.
Strong Signals: Occur when both the price crosses the fast EMA and the fast EMA crosses the slow EMA simultaneously.
RSI Momentum Confirmation:
RSI Calculation: Uses a 14-period RSI to gauge market momentum.
Momentum Filter: Confirms signals only when RSI aligns with the trend (above 50 for bullish, below 50 for bearish signals).
Visual Aids:
EMA and VWAP Plots: Overlays the EMAs and VWAP directly on the price chart for easy visualization.
Buffer Zone Lines: Plots the upper and lower buffer zones around the 200 EMA.
Signal Labels:
Buy Signals: Displayed as green "BUY" labels below the bars.
Sell Signals: Displayed as red "SELL" labels above the bars.
How to Use:
Trend Identification:
Use the 200 EMA to determine the overall market trend.
Price above the 200 EMA suggests a bullish trend; below indicates a bearish trend.
Signal Generation:
Confirmed Signals: Wait for the confirmation candle after an EMA crossover before considering entry.
Early Signals: Consider early entries when price crosses the 200 EMA and moves beyond the buffer zone.
Strong Signals: Pay attention to strong signals where both price and EMAs are crossing over, indicating robust trend momentum.
Momentum Confirmation:
Ensure the RSI aligns with the signal direction:
Buy Signals: RSI should be above 50.
Sell Signals: RSI should be below 50.
Adjusting Sensitivity:
Modify the ATR Multiplier and Buffer Multiplier to suit different market conditions and personal trading styles.
A higher multiplier may reduce signal frequency but increase reliability.
Customization Parameters:
ATR Multiplier for Distance Filter (Default: 1.5):
Adjusts the sensitivity of the distance filter based on ATR.
Buffer Multiplier for 200 EMA (Default: 1.0):
Alters the width of the buffer zones around the 200 EMA.
Benefits:
Reduces False Signals: The combination of confirmation candles and buffer zones helps filter out noise.
Enhances Trend Detection: Multiple EMA crossovers provide insights into short-term and medium-term trends.
Incorporates Volatility and Momentum: ATR and RSI ensure signals consider market volatility and momentum.
Disclaimer:
This indicator is a tool to assist in technical analysis and should not be used as the sole basis for trading decisions. Always conduct thorough analysis and consider risk management strategies before executing trades. Past performance is not indicative of future results.
Credits:
Developed by Vipink1203.
Version:
Pine Script Version 5
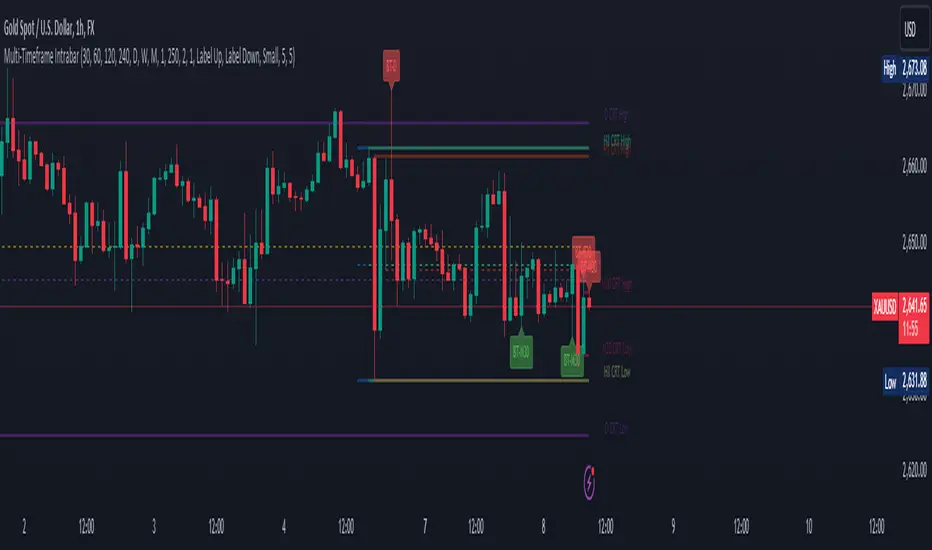
CRT candles Multi-Timeframe Intrabar(open Source ) # CRT candles Multi-Timeframe Intrabar Indicator( open source )
This advanced indicator visualizes Candle Range Theory (CRT) across multiple timeframes, providing traders with a comprehensive view of market structure and potential high-probability setups.
## Key Features:
- Supports 7 timeframes: 30 minutes, 1 hour, 2 hours, 4 hours, daily, weekly, and monthly
- Customizable color schemes for each timeframe
- Options to display mid-level (50%) lines for each range
- Bullish and bearish touch detection with customizable label display
- End-of-line labels for easy identification of CRT levels
- Flexible alert system for touch detections on each timeframe
- Adjustable minimum and maximum bar count for range validity
- Options for wick touch and body touch detection
## How It Works:
The indicator plots CRT ranges for each selected timeframe, identifying potential accumulation, manipulation, and distribution phases. It detects when price touches these levels, providing visual cues and optional alerts for potential trade setups.
snapshot
## Customization:
Users can fine-tune the indicator's appearance and functionality through various input options, including:
- Toggling timeframes on/off
snapshot
- Adjusting colors for range lines and mid-levels
- Controlling label display and count
- Setting alert preferences
- Adjusting line widths and label offsets
## Usage:
This indicator is designed for traders familiar with Candle Range Theory and multi-timeframe analysis. It can be used to identify potential entry and exit points, confirm trends, and spot potential reversals across different timeframes.
## Note:
This indicator is for educational and informational purposes only. Always combine with other forms of analysis and proper risk management when making trading decisions.
## Credits:
Inspired by Romeo's Candle Range Theory and developed to provide a comprehensive multi-timeframe analysis tool.
MTF SqzMom [tradeviZion]Credits:
John Carter for creating the TTM Squeeze and TTM Squeeze Pro.
Lazybear for the original interpretation of the TTM Squeeze: Squeeze Momentum Indicator.
Makit0 for evolving Lazybear's script by incorporating TTM Squeeze Pro upgrades – Squeeze PRO Arrows.
MTF SqzMom - Multi-Timeframe Squeeze & Momentum Tool
MTF SqzMom is a tool designed to help traders easily monitor squeeze and momentum signals across multiple timeframes in a simple, organized format. Built using Pine Script 5, it ensures that data remains consistent, even when switching between different time intervals on the chart.
Key Features:
Multi-Timeframe Monitoring: Track squeeze and momentum signals across various timeframes, all in one view. This includes key timeframes like 1-minute, 5-minute, hourly, and daily.
Dynamic Table Display: A color-coded table that automatically adjusts based on the selected timeframes, offering a clear view of market conditions.
Alerts for Key Market Events: Get notifications when a squeeze starts or fires across your chosen timeframes, so you can stay informed without needing to monitor the chart continuously.
Customizable Appearance: Tailor the look of the table by selecting colors for squeeze levels and momentum shifts, and choose the best position on your chart for easy access.
How It Works:
MTF SqzMom is based on the concept of the squeeze, which signals periods of lower volatility where price breakouts may occur. The tool tracks this by monitoring the contraction of Bollinger Bands within Keltner Channels. Along with this, it provides momentum analysis to help you gauge the potential direction of the market after a squeeze.
Squeeze Conditions: The script tracks four levels of squeeze conditions (no squeeze, low, mid, and high), each represented by a different color in the table.
Momentum Analysis: Momentum is visually represented by colors indicating four stages: up increasing, up decreasing, down increasing, and down decreasing. This color coding helps you quickly assess whether the market is gaining or losing momentum.
Using Alerts:
You can enable two types of alerts: when a squeeze starts (indicating consolidation) and when a squeeze fires (indicating a breakout). These alerts cover all timeframes you’ve selected, so you never miss important signals.
How to Set It Up:
1. Enable Alerts in Settings: Turn on "Alert for Squeeze Start" and "Alert for Squeeze Fire" in the settings.
2. Add Alerts to Your Chart:
Click the three dots next to the indicator name.
Select "Add alert on tradeviZion - MTF SqzMom."
3. Customize and Save: Adjust alert options, choose your notification type, and click "Create."
Why Use MTF SqzMom ?
Consistent Data: The tool ensures that squeeze and momentum data remain consistent, even when you switch between chart intervals.
Real-Time Alerts: Stay updated with alerts for squeeze conditions without needing to constantly watch the chart.
Simple to Use, Customizable to Fit: You can easily adjust the table’s look and choose the timeframes and colors that best suit your trading style.
Acknowledgment:
While this tool builds on the TTM Squeeze concept developed by John Carter of Simpler Trading, it offers added flexibility through multi-timeframe analysis, alerts, and customizability to make monitoring market conditions more accessible.

Sigma 2.0 - Advanced Buy and Sell Signal IndicatorOverview:
Sigma 2.0 is a sophisticated trading indicator designed to help traders identify potential buy and sell opportunities across various financial markets. By leveraging advanced mathematical calculations and incorporating multiple analytical tools, Sigma 2.0 aims to enhance trading strategies by providing precise entry and exit signals.
Key Features:
Advanced Sigma Calculations:
Utilizes a combination of Exponential Moving Averages (EMAs) and price deviations to calculate the Sigma lines (sigma1 and sigma2).
Detects potential trend reversals through the crossover of these Sigma lines.
Customizable Signal Filtering:
Offers the ability to filter buy and sell signals based on user-defined thresholds.
Helps reduce false signals in volatile markets by setting overbought and oversold levels.
Overbought and Oversold Detection:
Identifies extreme market conditions where price reversals are more likely.
Changes the background color of the chart to visually indicate overbought or oversold states.
Integration of Exponential Moving Averages (EMAs):
Includes EMAs of different lengths (10, 21, 55, 200) to assist in identifying market trends.
EMAs act as dynamic support and resistance levels.
Higher Timeframe Signal Incorporation:
Allows users to include signals from a higher timeframe to align trades with the broader market trend.
Enhances the reliability of signals by considering multiple timeframes.
Custom Alerts:
Provides alert conditions for both buy and sell signals.
Enables traders to receive notifications, ensuring timely decision-making.
How It Works:
Sigma Calculation Methodology:
The indicator calculates an average price (ap) and applies EMAs to derive the Sigma lines.
sigma1 represents the smoothed price deviation, while sigma2 is a moving average of sigma1.
A crossover of sigma1 above sigma2 generates a buy signal, indicating potential upward momentum.
Conversely, a crossover of sigma1 below sigma2 generates a sell signal.
Signal Filtering and Thresholds:
Users can enable filtering to only consider signals when sigma1 is below or above certain thresholds.
This helps in focusing on more significant market movements and reducing noise.
Overbought/Oversold Levels:
The indicator monitors sigma1 to detect when the market is in extreme conditions.
Background color changes provide a quick visual cue for these conditions.
EMA Analysis:
The plotted EMAs help in confirming the trend direction.
They can be used alongside Sigma signals to validate trade entries and exits.
Higher Timeframe Signals:
Incorporates signals from a user-selected higher timeframe.
Helps in aligning trades with the overall market trend, increasing the potential success rate.
How to Use:
Adding the Indicator to Your Chart:
Search for "Sigma 2.0" in the TradingView Indicators menu and add it to your chart.
Configuring the Settings:
Adjust the Sigma configurations (Channel Length, Average Length, Signal Line Length) to suit your trading style.
Set the overbought and oversold levels according to your risk tolerance.
Choose whether to filter signals by thresholds.
Select the higher timeframe for additional signal confirmation.
Interpreting the Signals:
Buy Signals:
Indicated by a green triangle below the price bar.
Occur when sigma1 crosses above sigma2 and other conditions are met.
Sell Signals:
Indicated by a red triangle above the price bar.
Occur when sigma1 crosses below sigma2 and other conditions are met.
Higher Timeframe Signals:
Plotted with lime (buy) and maroon (sell) triangles.
Help confirm signals in the current timeframe.
Utilizing EMAs:
Observe the EMAs to gauge the overall trend.
Consider aligning buy signals when the price is above key EMAs and sell signals when below.
Setting Up Alerts:
Use the built-in alert conditions to receive notifications for buy and sell signals.
Customize alert messages as needed.
Credits:
Original Concept Inspiration:
This indicator is inspired by the WaveTrend oscillator and other momentum-based indicators.
Special thanks to the original authors whose work laid the foundation for this enhanced version.
Disclaimer:
Trading involves significant risk, and past performance is not indicative of future results.
This indicator is a tool to assist in analysis and should not be the sole basis for any trading decision.
Always perform thorough analysis and consider multiple factors before entering a trade.
Note:
Ensure your chart is clean and only includes this indicator when publishing.
The script is open-source and can be modified to fit individual trading strategies.
For any questions or support, feel free to reach out or comment.

Dynamic Jurik RSX w/ Fisher Transform█ Introduction
The Dynamic Jurik RSX with Fisher Transform is a powerful and adaptive momentum indicator designed for traders who seek a non-laggy view of price movements. This script is based on the classic Jurik RSX (Relative Strength Index). It also includes features such as the dynamic overbought and oversold limits, the Inverse Fisher Transform, trend display, slope calculations, and the ability to color extremes for better clarity.
█ Key Features:
• RSX: The Relative Strength Index (RSX) in this script is based on Jurik’s RSX, which is smoother than the traditional RSI and aims to reduce noise and lag. This script calculates the RSX using an exponential smoothing technique and adaptive adjustments.
• Inverse Fisher Transform: This script can optionally apply the Inverse Fisher Transform to the RSX, which helps to normalize the RSX values, compressing them between -1 and 1. The inverse transformation makes it easier to spot extreme values (overbought and oversold conditions) by enhancing the visual clarity of those extremes. It also smooths the curve over a user-defined period in hopes of providing a more consistent signal.
• Dynamic Limits: The dynamic overbought and oversold limits are calculated based on the RSX's recent high and low values. The limits adjust dynamically depending on market conditions, making them more relevant to current price action.
• Slope Display: The slope of the RSX is calculated as the rate of change between the current and previous RSX value. The slope is displayed as dots when the slope exceeds the threshold designated by the user, providing visual cues for momentum shifts.
• Trend Coloring: Optionally, the user can also enable a trend-based display. It is simply based on current value of RSX versus the previous one. If RSX is rising then the trend is bullish, if not, then the trend is bearish.
• Coloring Extremes: Users can configure the RSX to color the chart when prices enter extreme conditions, such as overbought or oversold zones, providing visual cues for market reversals.
█ Attached Chart Notes:
• Top Panel: Enabled dynamic limits, Trend display, standard Jurik RSX with 20 lookback period, and Slope display.
• Middle Panel: Enabled dynamic limits, Extremes display, and standard Jurik RSX with 20 lookback period.
• Bottom Panel: Enabled dynamic limits, Trend display, Inverse Fisher Transform with 14 lookback period and 9 smoothing period. and Slope display.
█ Credits:
Special thanks to Everget for providing the original script. The script was also slightly modified based on updates from outside sources.
█ Disclaimer:
This script is for educational purposes only and should not be considered financial advice. Always conduct your own research and consult a professional before making any trading decisions.

ka66: Bar Range BandsThis tool takes a bar's range, and reflects it above the high and below the low of that bar, drawing upper and lower bands around the bar. Repeated for each bar. There's an option to then multiply that range by some multiple. Use a value greater than 1 to get wider bands, and less than one to get narrower bands.
This tool stems out of my frustration from the use of dynamic bands (like Keltner Channels, or Bollinger Bands), in particular for estimating take profit points.
Dynamic bands work great for entries and stop loss, but their dynamism is less useful for a future event like taking profit, in my experience. We can use a smaller multiple, but then we can often lose out on a bigger chunk of gains unnecessarily.
The inspiration for this came from a friend explaining an ICT/SMC concept around estimating the magnitude of a trend, by calculating the Asian Session Range, and reflecting it above or below on to the New York and London sessions. He described this as standard deviation of the Asian Range, where the range can thus be multiplied by some multiple for a wider or narrower deviation.
This, in turn, also reminded me of the Measured Move concept in Technical Analysis. We then consider that the market is fractal in nature, and this is why patterns persist in most timeframes. Traders exist across the spectrum of timeframes. Thus, a single bar on a timeframe, is made up of multiple bars on a lower timeframe . In other words, when we reflect a bar's range above or below itself, in the event that in a lower timeframe, that bar fit a pattern whose take profit target could be estimated via a Measured Move , then the band's value becomes a more valid estimate of a take profit point .
Yet another way to think about it, by way of the fractal nature above, is that it is essentially a simplified dynamic support and resistance mechanism , even simpler than say the various Pivot calculations (e.g. Classical, Camarilla, etc.).
This tool in general, can also be used by those who manually backtest setups (and certainly can be used in an automated setting too!). It is a research tool in that regard, applicable to various setups.
One of the pitfalls of manual backtesting is that it requires more discipline to really determine an exit point, because it's easy to say "oh, I'll know more or less where to exit when I go live, I just want to see that the entry tends to work". From experience, this is a bad idea, because our mind subconsciously knows that we haven't got a trained reflex on where to exit. The setup may be decent, but without an exit point, we will never have truly embraced and internalised trading it. Again, I speak from experience!
Thus, to use this to research take profit/exit points:
Have a setup in mind, with all the entry rules.
Plot your setup's indicators, mark your signals.
Use this indicator to get an idea of where to exit after taking an entry based on your signal.
Credits:
@ICT_ID for providing the idea of using ranges to estimate how far a trend move might go, in particular he used the Asian Range projected on to the London and New York market sessions.
All the technicians who came up with the idea of the Measured Move.

No Lag SupertrendNo Lag Supertrend indicator improves upon the original supertrend by incorporating calculation methods that enhance responsiveness and accuracy. Traditional supertrend indicators often suffer from lag, which can delay signals and affect trading decisions. No Lag Supertrend addresses this issue through the use of KAMA (Kaufman’s Adaptive Moving Average) and Hull ATR (Average True Range) calculations.
Goals of No Lag Supertrend:
- Lag reduction: one of the main issues with traditional supertrend indicators is their lag, which can result in delayed entry and exit signals. By integrating KAMA and Hull ATR, the no lag supertrend minimizes this delay, providing more timely signals.
- Market Noise Filtering: The combined use of KAMA and Hull ATR effectively filters out market noise, ensuring that signals are based on significant price movements rather than minor fluctuations.
- Consistency Across Different Market Conditions: The adaptive nature of KAMA and the smooth responsiveness of Hull ATR ensure that the No Lag Supertrend performs consistently across various market conditions, from trending to volatile markets.
Credits: This code is based on the TradingView supertrend but improved the ATR calculations.
BINANCE-BYBIT Cross Chart: Spot-Perpetual CorrelationName: "Binance-Bybit Cross Chart: Spot-Perpetual Correlation"
Category: Scalping, Trend Analysis
Timeframe: 1M, 5M, 30M, 1D (depending on the specific technique)
Technical analysis: This indicator facilitates a comparison between the price movements shown on the Binance spot chart and the Bybit perpetual chart, with the aim of discerning the correlation between the two charts and identifying the dominant market trends. It automatically generates the corresponding chart based on the ticker selected in the primary chart. When a Binance pair is selected in the main chart, the indicator replicates the Bybit perpetual chart for the same pair and timeframe, and vice versa, selecting the Bybit perpetual chart as the primary chart generates the Binance spot chart.
Suggested use: You can utilize this tool to conduct altcoin trading on Binance or Bybit, facilitating the comparison of price actions and real-time monitoring of trigger point sensitivity across both exchanges. We recommend prioritizing the Binance Spot chart in the main panel due to its typically longer historical data availability compared to Bybit.
The primary objective is to efficiently and automatically manage the following three aspects:
- Data history analysis for higher timeframes, leveraging the extensive historical data of the Binance spot market. Variations in indicators such as slow moving averages may arise due to differences in historical data between exchanges.
- Assessment of coin liquidity on both exchanges by observing candlestick consistency on smaller timeframes or the absence of gaps. In the crypto market, clean charts devoid of gaps indicate dominance and offer enhanced reliability.
- Identification of precise trigger point levels, including daily, previous day, or previous week highs and lows, which serve as sensitive areas for breakout or reversal operations.
All-Time High (ATH) and All-Time Low (ATL) levels may vary significantly across exchanges due to disparities in historical data series.
This tool empowers traders to make informed decisions by leveraging historical data, liquidity insights, and precise trigger point identification across Binance Spot and Bybit Perpetual market.
Configuration:
EMA length:
- EMA 1: Default 5, user configurable
- EMA 2: Default 10, user configurable
- EMA 3: Default 60, user configurable
- EMA 4: Default 223, user configurable
- Additional Average: Optional display of an additional average, such as a 20-period average.
Chart Elements:
- Session separator: Indicates the beginning of the current session (in blue)
- Background: Indicates an uptrend (60 > 223) with a green background and a downtrend (60 < 223) with a red background.
Instruments:
- EMA Daily: Shows daily averages on an intraday timeframe.
- EMA levels 1h - 30m: Shows the levels of the 1g-30m EMAs.
- EMA Levels Highest TF: Provides the option to select additional EMA levels from the major timeframes, customizable via the drop-down menu.
- "Hammer Detector: Marks hammers with a green triangle and inverted hammers with a red triangle on the chart
- "Azzeramento" signal on TF > 30m: Indicates a small candlestick on the EMA after a dump.
- "No Fomo" signal on TF < 30m: Indicates a hyperextended movement.
Trigger Points:
- Today's highs and lows: Shows the opening price of the day's candlestick, along with the day's highs and lows (high in purple, low in red, open in green).
- Yesterday's highs and lows: Displays the opening price of the daily candlestick, along with the previous day's highs and lows (high in yellow, low in red).
You can customize the colors in "Settings" > "Style".
It is best used with the Scalping The Bull indicator on the main panel.
Credits:
@tumiza999: for tests and suggestions.
Thanks for your attention, happy to support the TradingView community.

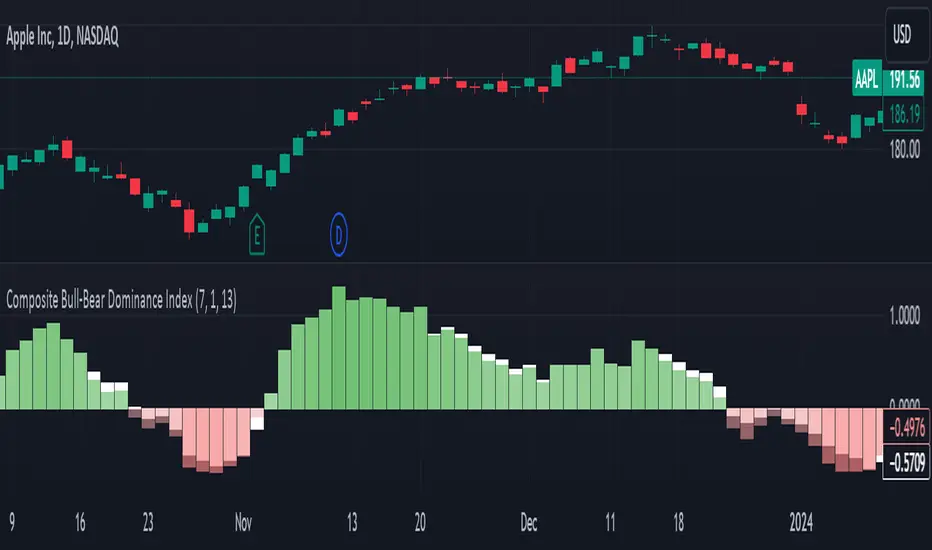
Composite Bull-Bear Dominance IndexNote: CREDITS: This is based on the Up Down Volume Indicator (published in Trading View) and Elder Ray Index (Bull Bear Power).
The Composite Bull Bear Dominance Index (CBBDI) is a indicator that combines up down volume analysis with Bull and Bear Power to provide a comprehensive view of market dynamics. It calculates Z-scores for up down volume delta and bull bear power measures, averages them, and then smoothes the result using Weighted Moving Average (WMA) for Bull and Bear Power and Volume Weighted Moving Average (VWMA) for Up and Down Volume Delta. The advantages include responsiveness to short-term trends, noise reduction through weighting, incorporation of volume information, and the ability to identify significant changes in buying and selling pressure. The indicator aims to offer clear signals for traders seeking insights into overall market dominance and indicate if the bulls or the bears have the upper hand.
Volume Analysis (Up/Down Volume Delta):
Up/Down Volume Delta reflects the net difference between buying and selling volume, providing insights into the prevailing market sentiment.
Positive Delta: Indicates potential bullish dominance due to higher buying volume.
Negative Delta: Suggests potential bearish dominance as selling volume surpasses buying volume.
Price Analysis (Bull and Bear Power):
Bull and Bear Power measure the strength of buying and selling forces based on price movements and the Exponential Moving Average (EMA) of the closing price.
Positive Bull Power: Reflects bullish dominance, indicating potential upward momentum.
Positive Bear Power: Suggests bearish dominance, indicating potential downward momentum.
Composite Bull Bear Dominance Index (CBBDI):
CBBDI combines the standardized Z-scores of Up/Down Volume Delta and Bull Bear Power, providing an average measure of both volume and price-related dominance.
Positive CBBDI: Indicates an overall bullish dominance in both volume and price dynamics.
Negative CBBDI: Suggests an overall bearish dominance in both volume and price dynamics.
Smoothing Techniques:
The use of Weighted Moving Average (WMA) for smoothing Bull and Bear Power Z-scores, and Volume Weighted Moving Average (VWMA) for smoothing Up/Down Volume Delta, reduces noise and provides a clearer trend signal.
Smoothing helps filter out short-term fluctuations and emphasizes more significant trends in both volume and price movements.
Color Coding:
CBBDI values are color-coded based on their direction, visually representing the prevailing market sentiment.
Green Colors: Positive values indicate potential bullish dominance.
Red Colors: Negative values suggest potential bearish dominance.
Hedge Coin M - Statistical Support and ResistanceHedge Coin M - Statistical Support and Resistance
Introduction
"Hedge Coin M - Statistical Support and Resistance" is a sophisticated, statistically-driven indicator designed specifically for traders in the COIN-M market on Binance. It offers a nuanced approach to identifying key market levels, focusing on the dynamics of support and resistance through advanced volatility analysis.
Foundation and Credits:
This script is an advanced adaptation of TradingView's standard code for the Bollinger Bands indicator. It extends the foundational concept of Bollinger Bands by integrating additional volatility metrics.
Calculation Method
This indicator employs Volume Weighted Moving Averages (VWMA) to create two distinct sets of Bollinger Bands, named BB-a and BB-b.
BB-a is derived from the VWMA of high prices, targeting potential resistance levels.
BB-b is based on the VWMA of low prices, aimed at identifying critical support levels.
Users can independently adjust the standard deviation (SD) multipliers for the upper and lower bands of both BB-a and BB-b, accommodating different market conditions.
Enhanced Volatility Analysis
The indicator calculates additional standard deviation lines for the upper band of BB-a and the lower band of BB-b. These lines provide deeper insights into market volatility.
Plotted Graphs
The primary plots include the upper and lower bands of BB-a and BB-b, marked in distinct colors for clarity.
Additional SD lines are plotted to indicate potential extended levels of support and resistance, offering traders a broader view of possible market movements.
Purpose and Usage
"Hedge Coin M - Statistical Support and Resistance" is designed to provide traders with a consistent, statistical method for identifying significant price levels.
It aids in scaling entry into positions, helping traders to navigate the COIN-M market with more informed decision-making.
This tool is especially useful for traders who combine long-term holding with swing trading strategies, offering a balanced approach to market engagement.
Integration and Adaptation
Easily integrate this indicator into your TradingView chart for the COIN-M market.
Use the insights provided to complement your overall trading strategy, particularly in identifying and reacting to significant market movements.
Disclaimer
Important Note: This indicator is provided for informational purposes only. It does not constitute financial advice, investment advice, trading advice, or any other sort of advice. Trading decisions should be made based on your own analysis, prudence, and judgment. Please be aware of the risks involved in trading and consult a financial advisor if necessary.

Advanced Volatility Oscillator with SignalsTitle: Advanced Volatility Oscillator with Signals (AVO-S)
In-Depth Description:
Introduction:
The Advanced Volatility Oscillator with Signals (AVO-S) is designed to offer traders a nuanced understanding of market volatility, combining traditional concepts with innovative visual aids and signal interpretation. This indicator is tailored for diverse financial markets, helping to identify potential trend reversals and momentum shifts.
Calculation and Methodology:
Spike Calculation: The core of AVO-S is the 'spike', calculated as the difference between the closing and opening prices (spike = close - open). This measure provides a straightforward gauge of intra-period volatility.
Standard Deviation: The indicator employs standard deviation to assess the variability of the 'spike', offering a dynamic threshold for understanding market extremities (stdDev = stdev(spike, length)).
Colored Columns: These columns visually represent the 'spike'. Their color changes based on the spike’s value relative to the zero line and the standard deviation threshold, providing an immediate visual cue of market state.
Blue Columns: Indicate moderate positive movement when the spike is above zero but below the standard deviation.
Green and Red Columns: Suggest stronger bullish (above standard deviation) and bearish (below negative standard deviation) movements, respectively.
Bullish and Bearish Signals:
The indicator generates signals based on the relationship between the 'spike' and its standard deviation.
Bullish Signals: Shown as upward triangles, these are formed when the 'spike' crosses above the standard deviation, indicating potential upward momentum.
Bearish Signals: Represented by downward triangles, these signals are generated when the 'spike' falls below the negative standard deviation, hinting at potential downward trends.
Usage and Application:
Traders can use the colored columns to quickly assess market sentiment and volatility.
The bullish and bearish signals serve as potential indicators for market entry or exit points, or for further analysis in conjunction with other technical tools.
Inspiration and Credits:
Inspired by Veryfid's original Volatility Oscillator, the AVO-S refines and builds upon these ideas to provide a comprehensive and user-friendly tool for market analysis. This indicator is a testament to the continuous evolution of technical analysis tools in the trading community.

Ehlers Combo Strategy🚀 Presenting the Enhanced Ehlers Combo Strategy 🚀
Hello Traders! 👋 I'm thrilled to share the latest version of the Ehlers Combo Strategy v2.0. This powerful algorithm combines Ehlers Elegant Oscillator, Decycler, Instantaneous Trendline, Spearman Rank, and introduces the Signal to Noise Ratio for even more precise trading signals.
📊 Strategy Highlights:
Ehlers Elegant Oscillator: Captures market momentum and turning points.
Ehlers Decycler: Filters out market noise for clearer trend signals.
Instantaneous Trendline: Offers a dynamic view of the market trend.
Spearman Rank: Analyzes market rank correlations for enhanced insights.
Signal to Noise Ratio (SNR): Filters out noise for more accurate signals.
💡 Key Features & Customizations:
Adaptive Length: Enable adaptive length based on the market's current conditions.
SNR Threshold: Set your desired SNR threshold for filtering signals.
Exit Length: Define the length for exit signals.
📈 Trading Signals:
Long Entry: Elegant Oscillator and Decycler cross above 0, source crosses above Decycler, source is greater than an increasing Instantaneous Trendline, Spearman Rank is positive, and SNR exceeds the threshold.
Long Exit: Source crosses below the Instantaneous Trendline after entering a long position.
Short Entry: Elegant Oscillator and Decycler cross below 0, source crosses below Decycler, source is less than a decreasing Instantaneous Trendline, Spearman Rank is negative, and SNR exceeds the threshold.
Short Exit: Source crosses above the Instantaneous Trendline after entering a short position.
📊 Insights & Enhancements:
Dynamic Length: The strategy adapts its length dynamically based on market conditions.
Improved SNR: Signal to Noise Ratio ensures better filtering of signals.
Enhanced Visualization: The Elegant Oscillator now features improved color coding for a clearer interpretation.
🚨 Disclaimer:
Trading involves risk, and this script should be used judiciously. It's not a guaranteed profit machine, but with careful use, it can be a valuable addition to your toolkit.
Feel free to backtest, tweak, and make it your own! Let's conquer the markets together! 💪📈
🚀✨ Happy Trading! ✨🚀
---
🙌 Credits:
A big shoutout to the original contributors:
@blackcat1402
@cheatcountry
@DasanC
