Metals:Backwardation/ContangoMETALS: Gold , Silver , Copper ( GC , SI, HG)
Quickly visualize carrying charge market vs backwardized market by comparing the price of the next 2 years of futures contracts.
Carrying charge (contract prices increasing into the future) = normal, representing the costs of carrying/storage of a commodity. When this is flipped to Backwardation (contract prices decreasing into the future): its a bullish sign: Buyers want this commodity, and they want it NOW.
Note: indicator does not map to time axis in the same way as price; it simply plots the progression of contract months out into the future; left to right; so timeframe DOESN'T MATTER for this plot
There's likely some more efficient way to write this; e.g. when plotting for Gold ( GC ); 21 of the security requests are redundant; but they are still made; and can make this slower to load
TO UPDATE(once a year will do): in REQUEST CONTRACTS section, delete old contracts (top) and add new ones (bottom). Then in PLOTTING section, Delete old contract labels (bottom); add new contract labels (top); adjust the X in 'bar_index-(X+_historical)' numbers accordingly
This is one of three similar indicators: Meats | Metals | Grains
-If you want to build from this; to work on other commodities ; be aware that Tradingview limits the number of contract calls to 40 (hence the 3 seperate indicators)
Tips:
-Right click and reset chart if you can't see the plot; or if you have trouble with the scaling.
-Right click and add to new scale if you prefer this not to overlay directly on price. Or move to new pane below.
--Added historical input: input days back in time; to see the historical shape of the Futures curve via selecting 'days back' snapshot
updated 15th June 2022
© twingall
In den Scripts nach "META股价历史数据" suchen

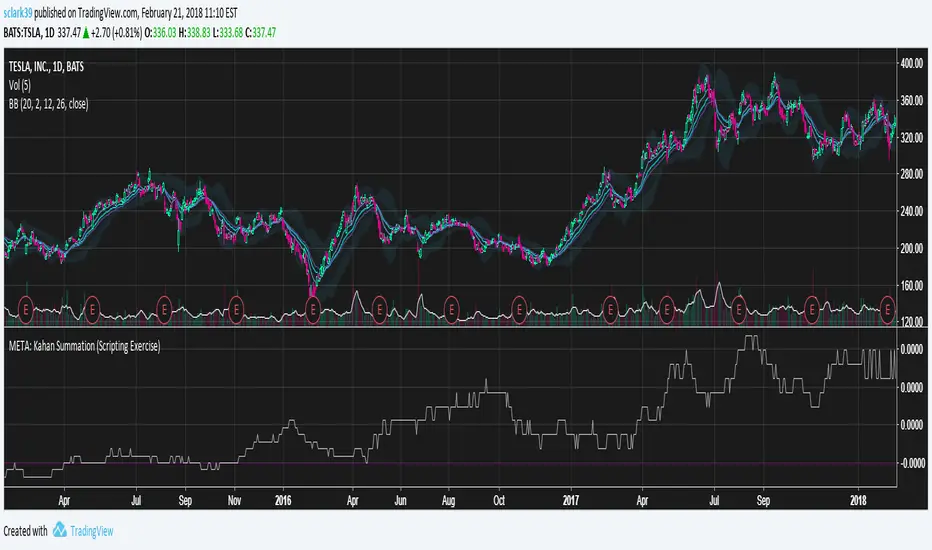
META: Kahan Summation (Scripting Exercise)I was curious to see what Pine uses to accumulate numbers. It looks like it uses the simple "add em up" approach, rather than a compensated summation. This means that especially for large numbers, there is an inherent error amount.
This script implements the Kahan Summation Algorithm, also known as compensated summation.
en.wikipedia.org
This is part 2 of my study into the builtin stdev function. I think this is why it differs so much from the simple two-pass solution.
Metatrader CalculatorThe “ Metatrader Calculator ” indicator calculates the position size, risk, and potential gain of a trade, taking into account the account balance, risk percentage, entry price, stop loss price, and risk/reward ratio. It supports the XAUUSD, XAGUSD, and BTCUSD pairs, automatically calculating the position size (in lots) based on these parameters. The calculation is displayed in a table on the chart, showing the lot size, loss in dollars, and potential gain based on the defined risk.

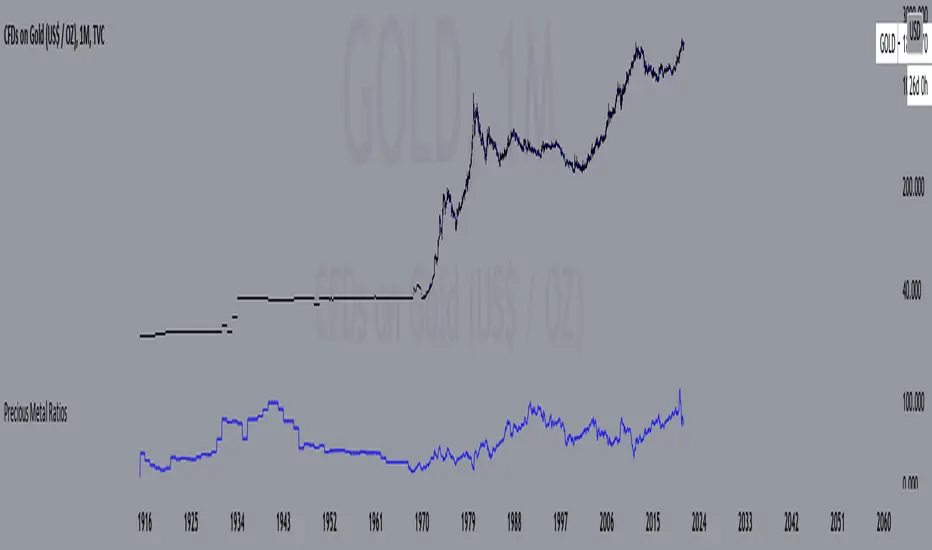
Precious Metal RatiosThis is a script that shows the ratios of precious metals, including Gold, Silver, Platinum, Palladium, Copper, Aluminum, and Steel.
You can choose your desired base currency and quote currency. The default ratio is Gold/Silver, where Gold is the base currency and Silver is the quote.
To use, just select your current timeframe from the menu.
Includes an option for repainting -- default value is true, meaning the script will repaint the current bar.
False = Not Repainting = Value for the current bar is not repainted, but all past values are offset by 1 bar.
True = Repainting = Value for the current bar is repainted, but all past values are correct and not offset by 1 bar.
In both cases, all of the historical values are correct, it is just a matter of whether you prefer the current bar to be realistically painted and the historical bars offset by 1, or the current bar to be repainted and the historical data to match their respective price bars.
As explained by TradingView,`f_security()` is for coders who want to offer their users a repainting/no-repainting version of the HTF data.
Metal worth buyingMetal currently at low price
watch closely for any price drop to buy
keep at least for 2 months

META: STDEV Study (Scripting Exercise)While trying to figure out how to make the STDEV function use an exponential moving average instead of simple moving average , I discovered the builtin function doesn't really use either.
Check it out, it's amazing how different the two-pass algorithm is from the builtin!
Eventually I reverse-engineered and discovered that STDEV uses the Naiive algorithm and doesn't apply "Bessel's Correction". K can be 0, it doesn't seem to change the data although having it included should make it a little more precise.
en.wikipedia.org

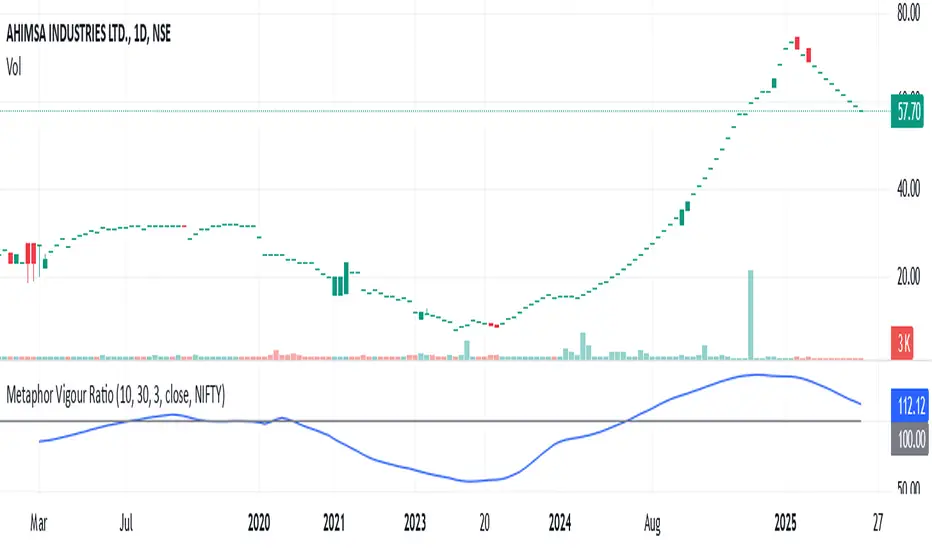
Metaphor Vigour Ratio### **Script Name:** Metaphor Vigour Ratio
**Short Title:** Metaphor Vigour Ratio
**Author:** Sovit Manjani, CMT
**Description:**
The Metaphor Vigour Ratio (MVRatio) is a powerful Relative Strength Indicator designed for assessing normalized relative strength. It is versatile and can be applied to any script or used to rank symbols based on their intermarket relative strength.
---
### **Features:**
1. **Bullish and Bearish Signals:**
- **Above 100:** Indicates a bullish trend.
- **Below 100:** Indicates a bearish trend.
2. **Trend Analysis with Slope:**
- **Slope Rising:** Suggests bullish momentum.
- **Slope Falling:** Suggests bearish momentum.
3. **Stock Selection Strategy:**
- Identify and rank stocks based on the MVRatio. For example, buy the top 10 stocks of Nifty with the highest MVRatio values for strong performance potential.
---
### **Inputs:**
1. **Fast EMA Period (RSEMAFast):** Default set to 10. Controls the sensitivity of the Fast Moving Average.
2. **Slow EMA Period (RSEMASlow):** Default set to 30. Provides a stable trend base with the Slow Moving Average.
3. **Smooth EMA Period (SmoothEMA):** Default set to 3. Smooths the MVRatio for better clarity.
4. **Close Source:** Default is the closing price, but it can be customized as needed.
5. **Comparative Symbol (ComparativeTickerId):** Default is "NSE:NIFTY," allowing comparison against a benchmark index.
---
### **Calculation Logic:**
1. **Relative Strength (RS):**
- Calculated as the ratio of the base symbol's price to the comparative symbol's price.
2. **Exponential Moving Averages (FastMA and SlowMA):**
- Applied to the RS to smooth and differentiate trends.
3. **Metaphor Vigour Ratio (MVRatio):**
- Computed as the ratio of FastMA to SlowMA, scaled by 100, and further smoothed using SmoothEMA.
---
### **Visualization:**
1. **MVRatio Plot (Blue):**
- Represents the relative strength dynamics.
2. **Reference Line at 100 (Gray):**
- Helps quickly identify bullish (above 100) and bearish (below 100) zones.
---
### **How to Use:**
1. Add the indicator to your chart from TradingView's Pine Script editor.
2. Compare the performance of any symbol relative to a benchmark (e.g., Nifty).
3. Analyze trends, slopes, and ranking based on MVRatio values to make informed trading decisions.
---
**Note:** This indicator is for educational purposes and should be used alongside other analysis methods to make trading decisions.
Meta-LR ForecastThis indicator builds a forward-looking projection from the current bar by combining twelve time-compressed “mini forecasts.” Each forecast is a linear-regression-based outlook whose contribution is adaptively scaled by trend strength (via ADX) and normalized to each timeframe’s own volatility (via that timeframe’s ATR). The result is a 12-segment polyline that starts at the current price and extends one bar at a time into the future (1× through 12× the chart’s timeframe). Alongside the plotted path, the script computes two summary measures:
* Per-TF Bias% — a directional efficiency × R² score for each micro-forecast, expressed as a percent.
* Meta Bias% — the same score, but applied to the final, accumulated 12-step path. It summarizes how coherent and directional the combined projection is.
This tool is an indicator, not a strategy. It does not place orders. Nothing here is trade advice; it is a visual, quantitative framework to help you assess directional bias and trend context across a ladder of timeframe multiples.
The core engine fits a simple least-squares line on a normalized price series for each small forecast horizon and extrapolates one bar forward. That “trend” forecast is paired with its mirror, an “anti-trend” forecast, constructed around the current normalized price. The model then blends between these two wings according to current trend strength as measured by ADX.
ADX is transformed into a weight (w) in using an adaptive band centered on the rolling mean (μ) with width derived from the standard deviation (σ) of ADX over a configurable lookback. When ADX is deeply below the lower band, the weight approaches -1, favoring anti-trend behavior. Inside the flat band, the weight is near zero, producing neutral behavior. Clearly above the upper band, the weight approaches +1, favoring a trend-following stance. The transitions between these regions are linear so the regime shift is smooth rather than abrupt.
You can shape how quickly the model commits to either wing using two exponents. One exponent controls how aggressively positive weights lean into the trend forecast; the other controls how aggressively negative weights lean into the anti-trend forecast. Raising these exponents makes the response more gradual; lowering them makes the shift more decisive. An optional switch can force full anti-trend behavior when ADX registers a deep-low condition far below the lower tail, if you prefer a categorical stance in very flat markets.
A key design choice is volatility normalization. Every micro-forecast is computed in ATR units of its own timeframe. The script fetches that timeframe’s ATR inside each security call and converts normalized outputs back to price with that exact ATR. This avoids scaling higher-timeframe effects by the chart ATR or by square-root time approximations. Using “ATR-true” for each timeframe keeps the cross-timeframe accumulation consistent and dimensionally correct.
Bias% is defined as directional efficiency multiplied by R², expressed as a percent. Directional efficiency captures how much net progress occurred relative to the total path length; R² captures how well the path aligns with a straight line. If price meanders without net progress, efficiency drops; if the variation is well-explained by a line, R² rises. Multiplying the two penalizes choppy, low-signal paths and rewards sustained, coherent motion.
The forward path is built by converting each per-timeframe Bias% into a small ATR-sized delta, then cumulatively adding those deltas to form a 12-step projection. This produces a polyline anchored at the current close and stepping forward one bar per timeframe multiple. Segment color flips by slope, allowing a quick read of the path’s direction and inflection.
Inputs you can tune include:
* Max Regression Length. Upper bound for each micro-forecast’s regression window. Larger values smooth the trend estimate at the cost of responsiveness; smaller values react faster but can add noise.
* Price Source. The price series analyzed (for example, close or typical price).
* ADX Length. Period used for the DMI/ADX calculation.
* ATR Length (normalization). Window used for ATR; this is applied per timeframe inside each security call.
* Band Lookback (for μ, σ). Lookback used to compute the adaptive ADX band statistics. Larger values stabilize the band; smaller values react more quickly.
* Flat half-width (σ). Width of the neutral band on both sides of μ. Wider flats spend more time neutral; narrower flats switch regimes more readily.
* Tail width beyond flat (σ). Distance from the flat band edge to the extreme trend/anti-trend zone. Larger tails create a longer ramp; smaller tails reach extremes sooner.
* Polyline Width. Visual thickness of the plotted segments.
* Negative Wing Aggression (anti-trend). Exponent shaping for negative weights; higher values soften the tilt into mean reversion.
* Positive Wing Aggression (trend). Exponent shaping for positive weights; lower values make trend commitment stronger and sooner.
* Force FULL Anti-Trend at Deep-Low ADX. Optional hard switch for extremely low ADX conditions.
On the chart you will see:
* A 12-segment forward polyline starting from the current close to bar\_index + 1 … +12, with green segments for up-steps and red for down-steps.
* A small label at the latest bar showing Meta Bias% when available, or “n/a” when insufficient data exists.
Interpreting the readouts:
* Trend-following contexts are characterized by ADX above the adaptive upper band, pushing w toward +1. The blended forecast leans toward the regression extrapolation. A strongly positive Meta Bias% in this environment suggests directional alignment across the ladder of timeframes.
* Mean-reversion contexts occur when ADX is well below the lower tail, pushing w toward -1 (or forcing anti-trend if enabled). After a sharp advance, a negative Meta Bias% may indicate the model projects pullback tendencies.
* Neutral contexts occur when ADX sits inside the flat band; w is near zero, the blended forecast remains close to current price, and Meta Bias% tends to hover near zero.
These are analytical cues, not rules. Always corroborate with your broader process, including market structure, time-of-day behavior, liquidity conditions, and risk limits.
Practical usage patterns include:
* Momentum confirmation. Combine a rising Meta Bias% with higher-timeframe structure (such as higher highs and higher lows) to validate continuation setups. Treat the 12th step’s distance as a coarse sense of potential room rather than as a target.
* Fade filtering. If you prefer fading extremes, require ADX to be near or below the lower ramp before acting on counter-moves, and avoid fades when ADX is decisively above the upper band.
* Position planning. Because per-step deltas are ATR-scaled, the path’s vertical extent can be mentally mapped to typical noise for the instrument, informing stop distance choices. The script itself does not compute orders or size.
* Multi-timeframe alignment. Each step corresponds to a clean multiple of your chart timeframe, so the polyline visualizes how successively larger windows bias price, all referenced to the current bar.
House-rules and repainting disclosures:
* Indicator, not strategy. The script does not execute, manage, or suggest orders. It displays computed paths and bias scores for analysis only.
* No performance claims. Past behavior of any measure, including Meta Bias%, does not guarantee future results. There are no assurances of profitability.
* Higher-timeframe updates. Values obtained via security for higher-timeframe series can update intrabar until the higher-timeframe bar closes. The forward path and Meta Bias% may change during formation of a higher-timeframe candle. If you need confirmed higher-timeframe inputs, consider reading the prior higher-timeframe value or acting only after the higher-timeframe close.
* Data sufficiency. The model requires enough history to compute ATR, ADX statistics, and regression windows. On very young charts or illiquid symbols, parts of the readout can be unavailable until sufficient data accumulates.
* Volatility regimes. ATR normalization helps compare across timeframes, but unusual volatility regimes can make the path look deceptively flat or exaggerated. Judge the vertical scale relative to your instrument’s typical ATR.
Tuning tips:
* Stability versus responsiveness. Increase Max Regression Length to steady the micro-forecasts but accept slower response. If you lower it, consider slightly increasing Band Lookback so regime boundaries are not too jumpy.
* Regime bands. Widen the flat half-width to spend more time neutral, which can reduce over-trading tendencies in chop. Shrink the tail width if you want the model to commit to extremes sooner, at the cost of more false swings.
* Wing shaping. If anti-trend behavior feels too abrupt at low ADX, raise the negative wing exponent. If you want trend bias to kick in more decisively at high ADX, lower the positive wing exponent. Small changes have large effects.
* Forced anti-trend. Enable the deep-low option only if you explicitly want a categorical “markets are flat, fade moves” policy. Many users prefer leaving it off to keep regime decisions continuous.
Troubleshooting:
* Nothing plots or the label shows “n/a.” Ensure the chart has enough history for the ADX band statistics, ATR, and the regression windows. Exotic or illiquid symbols with missing data may starve the higher-timeframe computations. Try a more liquid market or a higher timeframe.
* Path flickers or shifts during the bar. This is expected when any higher-timeframe input is still forming. Wait for the higher-timeframe close for fully confirmed behavior, or modify the code to read prior values from the higher timeframe.
* Polyline looks too flat or too steep. Check the chart’s vertical scale and recent ATR regime. Adjust Max Regression Length, the wing exponents, or the band widths to suit the instrument.
Integration ideas for manual workflows:
* Confluence checklist. Use Meta Bias% as one of several independent checks, alongside structure, session context, and event risk. Act only when multiple cues align.
* Stop and target thinking. Because deltas are ATR-scaled at each timeframe, benchmark your proposed stops and targets against the forward steps’ magnitude. Stops that are much tighter than the prevailing ATR often sit inside normal noise.
* Session context. Consider session hours and microstructure. The same ADX value can imply different tradeability in different sessions, particularly in index futures and FX.
This indicator deliberately avoids:
* Fixed thresholds for buy or sell decisions. Markets vary and fixed numbers invite overfitting. Decide what constitutes “high enough” Meta Bias% for your market and timeframe.
* Automatic risk sizing. Proper sizing depends on account parameters, instrument specifications, and personal risk tolerance. Keep that decision in your risk plan, not in a visual bias tool.
* Claims of edge. These measures summarize path geometry and trend context; they do not ensure a tradable edge on their own.
Summary of how to think about the output:
* The script builds a 12-step forward path by stacking linear-regression micro-forecasts across increasing multiples of the chart timeframe.
* Each micro-forecast is blended between trend and anti-trend using an adaptive ADX band with separate aggression controls for positive and negative regimes.
* All computations are done in ATR-true units for each timeframe before reconversion to price, ensuring dimensional consistency when accumulating steps.
* Bias% (per-timeframe and Meta) condenses directional efficiency and trend fidelity into a compact score.
* The output is designed to serve as an analytical overlay that helps assess whether conditions look trend-friendly, fade-friendly, or neutral, while acknowledging higher-timeframe update behavior and avoiding prescriptive trade rules.
Use this tool as one component within a disciplined process that includes independent confirmation, event awareness, and robust risk management.

MetaPlanet USD Prices + Cheapest/Expensive SummaryThis custom TradingView indicator tracks and compares the real-time USD-equivalent prices of MetaPlanet Inc. (Ticker 3350) across three different global exchanges:
🇯🇵 TSE:3350 (Tokyo Stock Exchange, JPY)
🇩🇪 FWB:DN3 (Frankfurt/Xetra Exchange, EUR)
🇺🇸 OTC:MTPLF (US Over-the-Counter, USD)
It converts all prices into USD using live forex rates (USDJPY and EURUSD via OANDA) and plots them together for easy visual comparison.

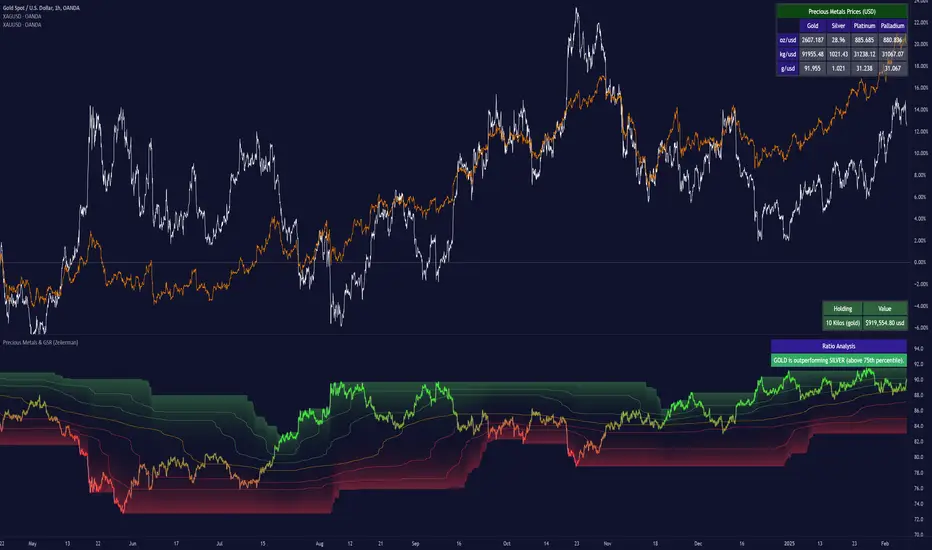
Precious Metals & GSR (Zeiierman)█ Overview
The Precious Metals & GSR (Zeiierman) is designed to provide traders and investors with a comprehensive view of the Gold-Silver Ratio (GSR) and other precious metal relationships. This tool helps evaluate the relative strength between different metals by analyzing their price ratios over historical periods, using quantile-based analysis and trend interpretation tables to highlight key insights.
The Gold-Silver Ratio (GSR) is a widely utilized metric in precious metals trading, representing the number of silver ounces required to purchase one ounce of gold. Historically, this ratio has fluctuated, providing traders with insights into the relative value of these two metals. By analyzing the GSR, traders can identify potential trading opportunities based on historical patterns and market dynamics.
By integrating customizable percentile bands, gradient coloring for performance visualization, and dynamic ratio analysis, this indicator assists in understanding how one metal is performing relative to another, making it useful for trend tracking, risk management, and portfolio allocation.
█ How It Works
The Precious Metals & GSR Indicator operates by fetching the latest prices of the selected precious metals in the user's chosen currency. It then calculates the ratio between two selected metals (Metal 1 and Metal 2) and analyzes this ratio over a specified period. By computing quantile bands and high/low bands, the indicator provides insights into the historical performance and current standing of the ratio.
⚪ Ratio Calculation
The core of this indicator is the metal ratio, calculated by dividing the price of Metal 1 by Metal 2.
A rising ratio means Metal 1 is outperforming Metal 2.
A falling ratio means Metal 2 is outperforming Metal 1.
The indicator automatically retrieves live market prices of Gold, Silver, Platinum, and Palladium to compute the ratio.
⚪ Quantile Ratio Bands
The indicator calculates the highest (max) and lowest (min) ratio levels over a user-defined period.
It also plots quantile bands at the 10th, 25th, 50th (median), 75th, and 90th percentiles, providing deeper statistical insights into how extreme or average the current ratio is.
The median (Q50) acts as a reference level, showing whether the ratio is above or below its historical midpoint.
⚪ Interpretation Table
The Ratio Interpretation Table provides a text-based summary of the ratio’s strength.
It detects whether Metal 1 is at a historical high, low, or within common ranges.
This helps traders and investors make informed decisions on whether the ratio is overextended, mean-reverting, or trending.
⚪ Precious Metals Table
Displays live market prices for Gold, Silver, Platinum, and Palladium.
Prices are shown in different units (oz, kg, grams, and troy ounces) based on user preferences.
A color-coded system highlights price changes, making it easier to track market movements.
⚪ Physical Holding Calculator
Users can enter their precious metal holdings to estimate their current value.
The system adjusts calculations based on weight, purity (24K, 22K, etc.), and unit of measurement.
The holding value is displayed in the selected currency (USD, EUR, GBP, etc.).
█ How to Use
⚪ Trend Identification
If the ratio is increasing, Metal 1 is gaining strength relative to Metal 2 → Possible Long Position on Metal 1 / Short on Metal 2
If the ratio is decreasing, Metal 2 is gaining strength relative to Metal 1 → Possible Short Position on Metal 1 / Long on Metal 2
⚪ Mean Reversion Strategy
When the ratio reaches the 90th percentile, Metal 1 is historically overextended (expensive) compared to Metal 2.
Traders may look to sell Metal 1 and buy Metal 2, expecting the ratio to decline back toward its historical average.
Example (Gold/Silver Ratio): If the GSR is above the 90th percentile, gold is very expensive relative to silver, suggesting a potential buying opportunity in silver and/or a selling opportunity in gold.
When the ratio reaches the 10th percentile, Metal 1 is historically undervalued (cheap) compared to Metal 2.
Traders may look to buy Metal 1 and sell Metal 2, expecting the ratio to rise back toward its historical average.
Example (Gold/Silver Ratio): If the GSR is below the 10th percentile, gold is very cheap relative to silver, suggesting a potential buying opportunity in gold and/or a selling opportunity in silver.
⚪ Common Strategy Based on GSR Insights
A common approach involves monitoring the ratio for extreme values based on historical data. When the ratio reaches historically high levels, it suggests that gold is expensive relative to silver, potentially indicating a buying opportunity for silver and/or a selling opportunity for gold. Conversely, when the ratio is at historically low levels, silver is expensive relative to gold, suggesting a potential buying opportunity for gold and/or selling opportunity for silver. This mean-reversion strategy relies on the tendency of the GSR to return to its historical average over time.
⚪ Hedging & Portfolio Diversification
If Gold is strongly outperforming Silver, investors may shift allocations to balance risk.
If Silver is rapidly gaining on Gold, it may indicate increased industrial demand or speculative interest.
⚪ Inflation & Economic Cycles
A rising Gold-Silver ratio often correlates with economic downturns and increased risk aversion.
A falling Gold-Silver ratio may signal stronger economic growth and higher inflation expectations.
█ Settings
Precious Metals Table
Select which metals to display (Gold, Silver, Platinum, Palladium)
Choose measurement units (oz, kg, grams, troy ounces)
Ratio Analysis
Select Metal 1 & Metal 2 for ratio calculation
Set historical length for quantile calculations
Interpretation Table
Enable automated insights based on ratio levels
Physical Holdings Calculator
Enter metal weight, purity, and unit
Select calculation currency
-----------------
Disclaimer
The content provided in my scripts, indicators, ideas, algorithms, and systems is for educational and informational purposes only. It does not constitute financial advice, investment recommendations, or a solicitation to buy or sell any financial instruments. I will not accept liability for any loss or damage, including without limitation any loss of profit, which may arise directly or indirectly from the use of or reliance on such information.
All investments involve risk, and the past performance of a security, industry, sector, market, financial product, trading strategy, backtest, or individual's trading does not guarantee future results or returns. Investors are fully responsible for any investment decisions they make. Such decisions should be based solely on an evaluation of their financial circumstances, investment objectives, risk tolerance, and liquidity needs.
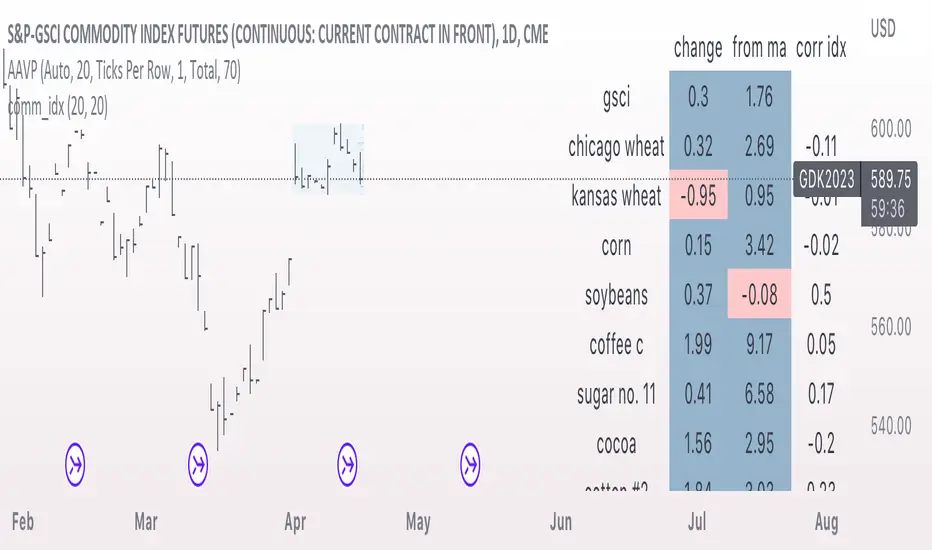
comm_idxThis script displays information about the components of the Goldman Sachs Commodity Index. The index is based on futures contracts in the categories of agricultural products, softs commodities, livestock, energies, industrial metals, and precious metals. The statistics displayed in the table are:
change: 1-day % change
from ma: the % change from a moving average
corr idx: correlation of the contract to the GSCI
The lengths for the moving average and correlation statistic can be set using the inputs.
See the script source for the symbols used for each commodity. Although most of the symbols correspond to the actual futures contract used to compute the index, LME contracts are not available on tradingview. Hence, corresponding HKEX contracts are used for the industrial metals.
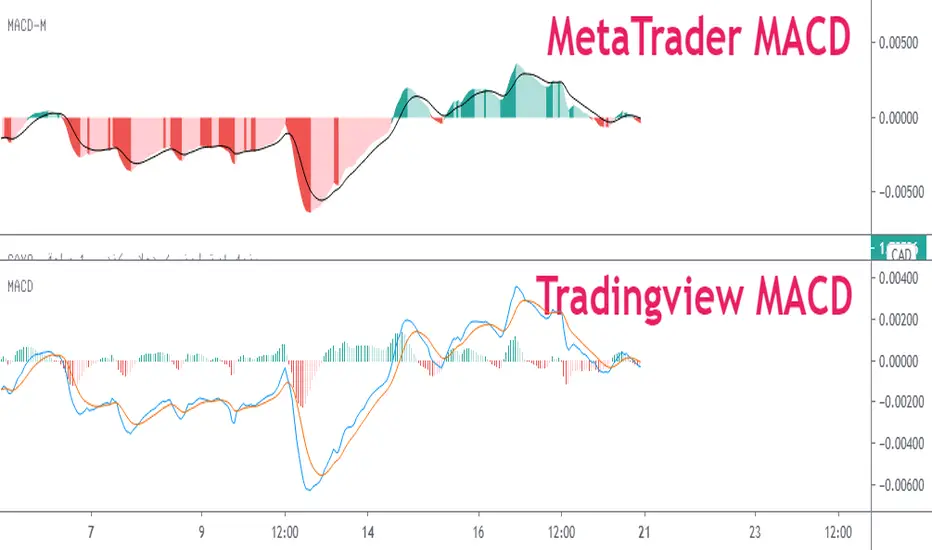
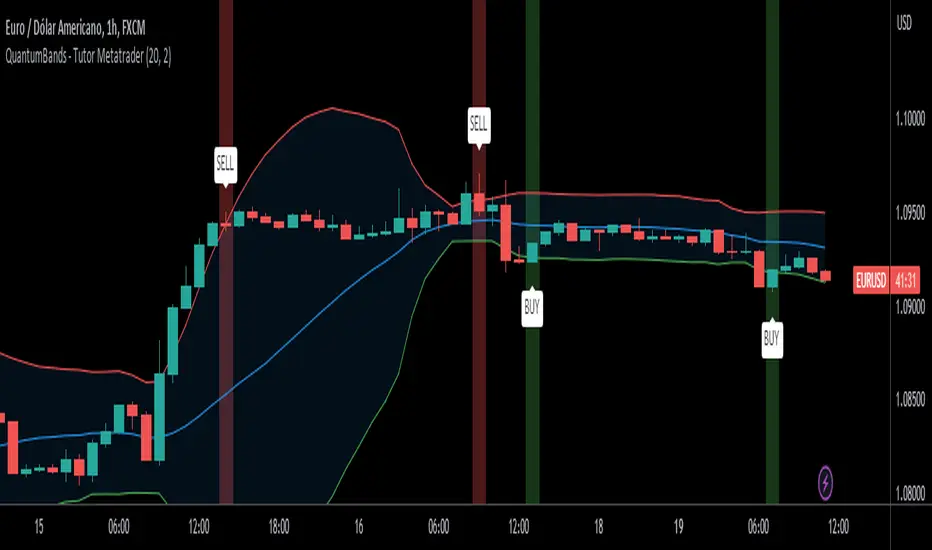
QuantumBands - Tutor Metatrader🚀 QuantumBands - Tutor Metatrader 🚀
📖 Description:
QuantumBands is a powerful technical indicator designed to enhance your trading analysis. It combines the popular Bollinger Bands with a unique twist, providing you with valuable insights into market dynamics. This indicator is presented by the Tutor Metatrader channel, offering expert guidance and education on using the indicator effectively.
🔍 How it Works:
QuantumBands calculates the Bollinger Bands based on a defined period and multiplier. The indicator plots the middle band (basis), the upper band, and the lower band on your chart, visualizing potential price volatility and areas of support and resistance. Additionally, it generates buy and sell signals when the price crosses the bands, helping you identify potential entry and exit points in your trading strategy.
🎯 Key Features:
- Customizable period and multiplier for the Bollinger Bands.
- Clear visual representation of the bands for easy analysis.
- Buy and sell signals for potential trading opportunities.
- Backed by the expertise of Tutor Metatrader channel.
📚 How to Use:
1. Set the desired period and multiplier for the Bollinger Bands.
2. Look for price action near the bands and monitor for potential reversals or breakouts.
3. Pay attention to buy and sell signals generated when the price crosses the bands.
4. Consider additional factors and perform proper risk management before executing trades.
⚠️ Disclaimer: Trading involves risk, and this indicator should be used as a tool to support your analysis. Always perform your due diligence and combine the indicator with other technical and fundamental analysis methods.
🌟 Enjoy using QuantumBands for your trading analysis, and remember to check out the Tutor Metatrader channel for expert guidance and educational content!
💡 Share your feedback and trading experiences with QuantumBands - Tutor Metatrader in the comments below. Happy trading!
Moving Stop-Loss mechanism + alerts to MT4/MT5"How to code moving stop-loss mechanism", is one of the most often repeating questions in private messages I receive, so just to focus on this mechanism, I made a spin-off from my previous script: TradingView-Alerts-to-MT4-MT5-dynamic-variables-NON-REPAINTING .
The logic here moves the stop-loss each time a trade is running and a new pivot high/low is detected. When such event occurs (UpdateLongStopLoss or UpdateShortStopLoss), stoploss_long or stoploss_short mutable variable is modified. And it needs to be coded inside strategy.exit() line as "stop=stoploss_long" or "stop=stoploss_short". Entries are pretty straightforward - on Stoch crosses.
Last lines of the script show how to wrap information about such updates and send send alerts to MetaTrader via TradingConnector for execution in Forex/indices/commodities/crypto markets via MetaTrader. Please note that "tradeid=" variable must be passed with each alert, to let MetaTrader know which trade to modify. SLMOD, TPMOD are recently added commands, along with BE (as in "move stop-loss to breakeven" - but that's another topic).
Please disregard strategy backtest results, as this script is for coding education purposes only. However, it seems with the stop-loss mechanism enabled, the results are even better, than in original version of the script :)

(MVD) Meta-Volatility Divergence (DAFE) Meta-Volatility Divergence (MVD)
Reveal the Hidden Tension in Volatility.
The Meta-Volatility Divergence (MVD) indicator is a next-generation tool designed to expose the disagreement between multiple volatility measures—helping you spot when the market’s “volatility engines” are out of sync, and a regime shift or volatility event may be brewing.
What Makes MVD Unique?
Multi-Source Volatility Analysis:
Unlike traditional volatility indicators that rely on a single measure, MVD fuses four distinct volatility signals:
ATR (Average True Range): Captures the average range of price movement.
Stdev (Standard Deviation): Measures the dispersion of closing prices.
Range: The average difference between high and low.
VoVix: A proprietary “volatility of volatility” metric, quantifying the difference between fast and slow ATR, normalized by ATR’s own volatility.
Divergence Engine:
The core MVD line (yellow) represents the mean absolute deviation (MAD) of these volatility measures from their average. When the line is flat, all volatility measures are in agreement. When the line rises, it means the market’s volatility signals are diverging—often a precursor to regime shifts, volatility expansions, or hidden stress.
Dynamic Z-Score Normalization:
The MVD line is normalized as a Z-score, so you can easily spot when current divergence is rare or extreme compared to recent history.
Visual Clarity:
Yellow center line: Tracks the real-time divergence of volatility measures.
Green dashed thresholds: Mark the ±2.00 Z-score levels, highlighting when divergence is unusually high and action may be warranted.
Dashboard: Toggleable panel shows all key metrics (ATR, Stdev, VoVix, MVD Z) and your custom branding.
Compact Info Label : For mobile or minimalist users, a single-line summary keeps you informed without clutter.
What Makes The MVD line move?
- The MVD line rises when the included volatility measures (ATR, Stdev, Range, VoVix) are moving in different directions or at different magnitudes. For example, if ATR is rising but Stdev is falling, the line will move up, signaling disagreement.
- The line falls or flattens when all volatility measures are in sync, indicating a consensus in the market’s volatility regime.
- VoVix adds a unique dimension, making the indicator especially sensitive to sudden changes in volatility structure that most tools miss.
Inputs & Settings
ATR Length: Sets the lookback for ATR calculation. Shorter = more sensitive, longer = smoother.
Stdev Length: Sets the lookback for standard deviation. Adjust for your asset’s volatility.
Range Length: Sets the lookback for the average high-low range.
MVD Lookback: Controls the window for Z-score normalization. Higher values = more historical context, lower = more responsive.
Show Dashboard: Toggle the full dashboard panel on/off.
Show Compact Info Label: Toggle the mobile-friendly info line on/off.
Tip:
Adjust these settings to match your asset’s volatility and your trading timeframe. There is no “one size fits all”—tuning is key to extracting the most value from MVD.
How to make MVD work for you:
Threshold Crosses: When the MVD line crosses above or below the green dashed thresholds (±2.00), it signals that volatility measures are diverging more than usual. This is a heads-up that a volatility event, regime shift, or hidden market stress may be developing.
Not a Buy/Sell Signal: A threshold cross is not a direct buy or sell signal. It is an indication that the market’s volatility structure is changing. Use it as a filter, confirmation, or alert in combination with your own strategy and risk management.
Dashboard & Info Line: Use the dashboard for a full view of all metrics, or the info label for a quick glance—especially useful on mobile.
Chart: MNQ! on 5min frames
ATR: 14
StDev L: 11
Range L: 13
MDV LB: 13
Important Note
MVD is a market structure and volatility regime tool.
It is designed to alert you to potential changes in market conditions, not to provide direct trade entries or exits. Always combine with your own analysis and risk management.
Meta-Volatility Divergence:
See the market’s hidden tension. Anticipate the next wave.
For educational purposes only. Not financial advice. Always use proper risk management.
Use with discipline. Trade your edge.
— Dskyz, for DAFE Trading Systems

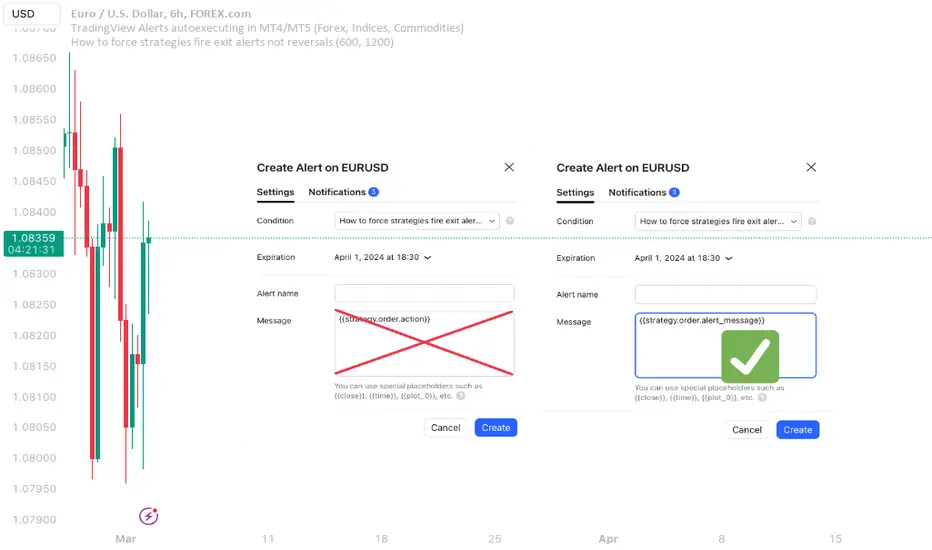
How to force strategies fire exit alerts not reversalsPineScript has gone a long way, from very simple and little-capable scripting language to a robust coding platform with reliable execution endpoints. However, this one small intuitivity glitch is still there and is likely to stay, because it is traditionally justified and quite intuitive for significant group of traders. I'm sharing this workaround in response to frequent inquiries about it.
What's the glitch? When setting alerts on strategies to be synchronized with TradingView's Strategy Tester events, using simple alert messages such as "buy" or "sell" based on entry direction seems straightforward by inserting {{strategy.order.action}} into the Create Alert's "Message" field. Because "buy" or "sell" are exactly the strings produced by {{strategy.order.action}} placeholder. However, complications arise when attempting to EXIT positions without reversing, whether triggered by price levels like Stop Loss or Take Profit, or logical conditions to close trades. Those bricks fall apart, because on such events {{strategy.order.action}} sends the same "sell" for exiting buy positions and "buy" for exiting sell positions, instead of something more differentiating like "closebuy" or "closesell". As a result reversal trades are opened, instead of simply closing the open ones.
This convention harkens back to traditional stock market practices, where traders either bought shares to enter positions or sold them to exit. However, modern trading encompasses diverse instruments like CFDs, indices, and Forex, alongside advanced features such as Stop Loss, reshaping the landscape. Despite these advancements, the traditional nomenclature persists.
And is poised to stay on TradingView as well, so we need a workaround to get a simple strategy going. Luckily it is here and is called alert_message . It is a parameter, which needs to be added into each strategy.entry() / strategy.exit() / strategy.close() function call - each call, which causes Strategy Tester to produce entry or exit orders. As in this example script:
line 12: strategy.entry(... alert_message ="buy")
line 14: strategy.entry(... alert_message ="sell")
line 19: strategy.exit(... alert_message ="closebuy")
line 20: strategy.exit(... alert_message ="closesell")
line 24: strategy.close(... alert_message ="closebuy")
line 26: strategy.close(... alert_message ="closesell")
These alert messages are compatible with the Alerts Syntax of TradingConnector - a tool facilitating auto-execution of TradingView alerts in MetaTrader 4 or 5. Yes, simple alert messages like "buy" / "sell" / "closebuy" / "closesell" suffice to carry the execution of simple strategy, without complex JSON files with multiple ids and such. Other parameters can be added (actually plenty), but they are only option and that's not a part of this story :)
Last thing left to do is to replace "Message" in Create Alert popup with {{strategy.order.alert_message}} . This placeholder transmits the string defined in the PineScript alert_message= parameter, as outlined in this publication. With this workaround, executing closing alerts becomes seamless within PineScript strategies on TradingView.
Disclaimer: this content is purely educational, especially please don't pay attention to backtest results on any timeframe/ticker.
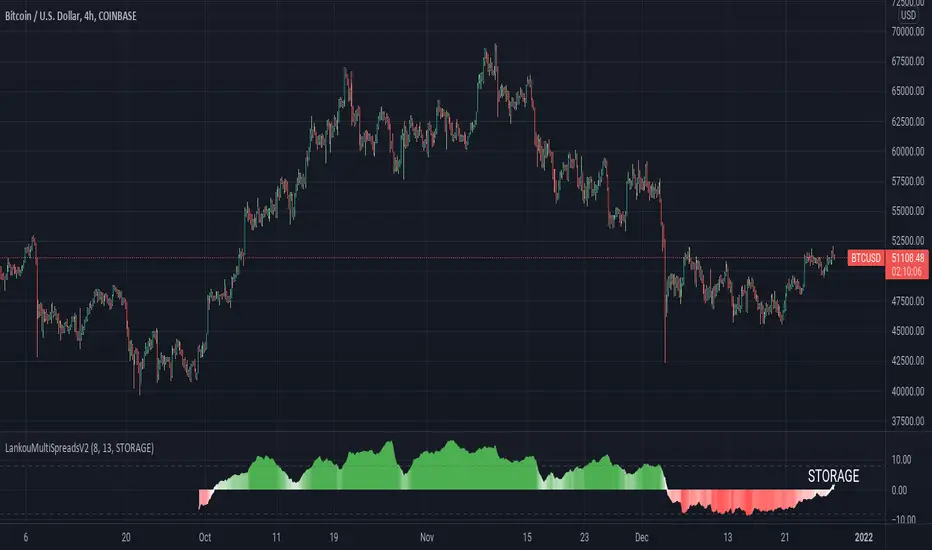
LankouMultiSpreadsV2 AllThis script is calculating the spread between a token and it's relative counterpart on the PERPETUAL FUTURES contract
It's focus on exchange / defi / Tokens / metaverse / storage
for exchange tokens
It uses future from FTX because Binance does not have PERP contractc for other exchanges
If it's red, the price on PERP is lower than SPOT
If it's green, the price on PERP is HIGHER than SPOT meaning people are bullish on this asset
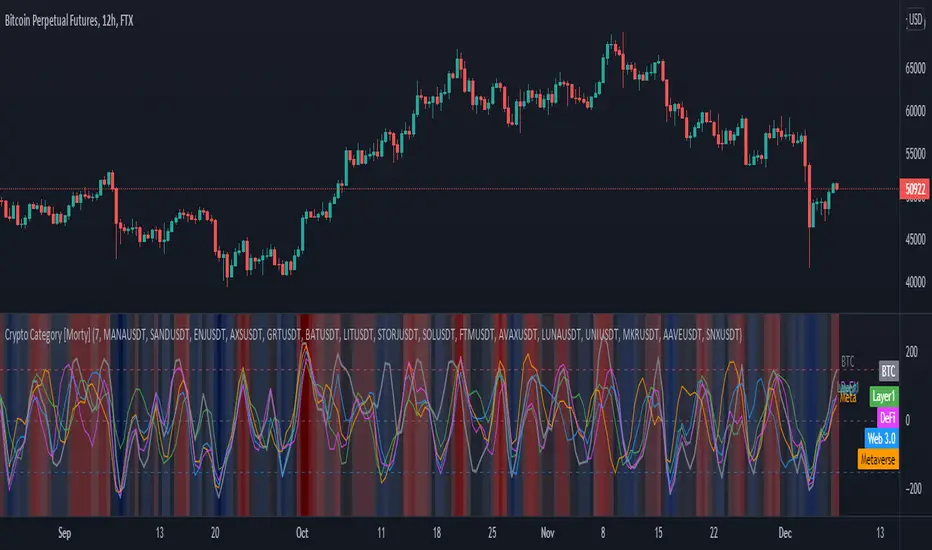
Crypto Category [Morty]This Crypto Category indicator shows an index oscillator for each cryptocurrency category.
Currently there are four categorys, include Metaverse, Web3, Layer1 and DeFi.
Each category index has four compoments and you can custom the input symbols.
The index is a Hull moving avarage of the compoments CCI. You can set the avarage period.
It also show a background heatmap based on the market sentiment which is calculated from the avarage of four indices.
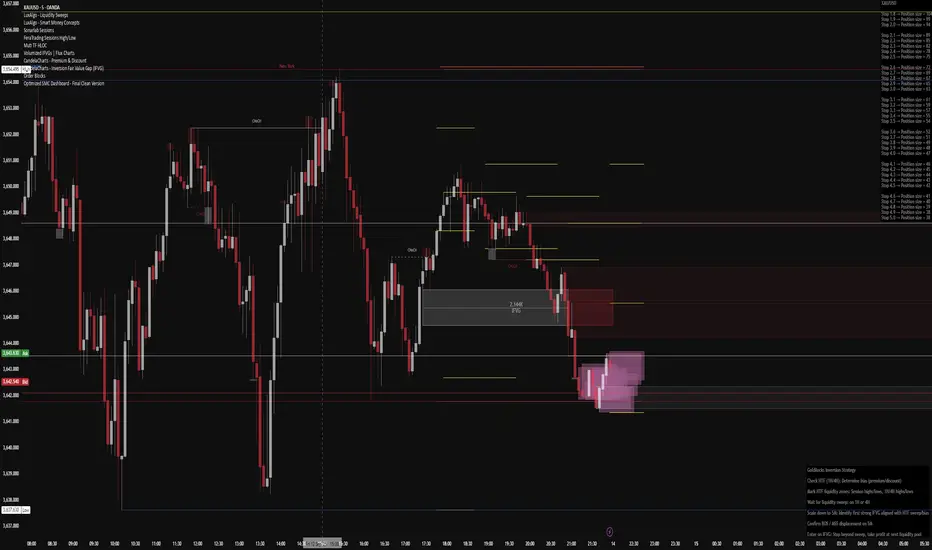
Optimized SMC Dashboard - by MinkyJuiceSMC - all in one
all SMC confluences are included, fully automated and customisable
enjoy, made by MinkyJuice
No Turd Burglars, please
gZScoreMETA currently has a strong bullish trend and is the distance from its yearly average too.
But, how much META is distant from the mean?
With this indicator, you can see an absolute value useful to determine support and resistance when the price is so far.
In this example, applied to the daily chart, currently, META is distant 3 standard deviations that could be seen as interesting resistance looking the past
This indicator could be applied as a filter for all your mean reversion strategies.


ATAI Volume Pressure Analyzer V 1.0 — Pure Up/DownATAI Volume Pressure Analyzer V 1.0 — Pure Up/Down
Overview
Volume is a foundational tool for understanding the supply–demand balance. Classic charts show only total volume and don’t tell us what portion came from buying (Up) versus selling (Down). The ATAI Volume Pressure Analyzer fills that gap. Built on Pine Script v6, it scans a lower timeframe to estimate Up/Down volume for each host‑timeframe candle, and presents “volume pressure” in a compact HUD table that’s comparable across symbols and timeframes.
1) Architecture & Global Settings
Global Period (P, bars)
A single global input P defines the computation window. All measures—host‑TF volume moving averages and the half‑window segment sums—use this length. Default: 55.
Timeframe Handling
The core of the indicator is estimating Up/Down volume using lower‑timeframe data. You can set a custom lower timeframe, or rely on auto‑selection:
◉ Second charts → 1S
◉ Intraday → 1 minute
◉ Daily → 5 minutes
◉ Otherwise → 60 minutes
Lower TFs give more precise estimates but shorter history; higher TFs approximate buy/sell splits but provide longer history. As a rule of thumb, scan thin symbols at 5–15m, and liquid symbols at 1m.
2) Up/Down Volume & Derived Series
The script uses TradingView’s library function tvta.requestUpAndDownVolume(lowerTf) to obtain three values:
◉ Up volume (buyers)
◉ Down volume (sellers)
◉ Delta (Up − Down)
From these we define:
◉ TF_buy = |Up volume|
◉ TF_sell = |Down volume|
◉ TF_tot = TF_buy + TF_sell
◉ TF_delta = TF_buy − TF_sell
A positive TF_delta indicates buyer dominance; a negative value indicates selling pressure. To smooth noise, simple moving averages of TF_buy and TF_sell are computed over P and used as baselines.
3) Key Performance Indicators (KPIs)
Half‑window segmentation
To track momentum shifts, the P‑bar window is split in half:
◉ C→B: the older half
◉ B→A: the newer half (toward the current bar)
For each half, the script sums buy, sell, and delta. Comparing the two halves reveals strengthening/weakening pressure. Example: if AtoB_delta < CtoB_delta, recent buying pressure has faded.
[ 4) HUD (Table) Display /i]
Colors & Appearance
Two main color inputs define the theme: a primary color and a negative color (used when Δ is negative). The panel background uses a translucent version of the primary color; borders use the solid primary color. Text defaults to the primary color and flips to the negative color when a block’s Δ is negative.
Layout
The HUD is a 4×5 table updated on the last bar of each candle:
◉ Row 1 (Meta): indicator name, P length, lower TF, host TF
◉ Row 2 (Host TF): current ↑Buy, ↓Sell, ΔDelta; plus Σ total and SMA(↑/↓)
◉ Row 3 (Segments): C→B and B→A blocks with ↑/↓/Δ
◉ Rows 4–5: reserved for advanced modules (Wings, α/β, OB/OS, Top
5) Advanced Modules
5.1 Wings
“Wings” visualize volume‑driven movement over C→B (left wing) and B→A (right wing) with top/bottom lines and a filled band. Slopes are ATR‑per‑bar normalized for cross‑symbol/TF comparability and converted to angles (degrees). Coloring mirrors HUD sign logic with a near‑zero threshold (default ~3°):
◉ Both lines rising → blue (bullish)
◉ Both falling → red (bearish)
◉ Mixed/near‑zero → gray
Left wing reflects the origin of the recent move; right wing reflects the current state.
5.2 α / β at Point B
We compute the oriented angle between the two wings at the midpoint B:
β is the bottom‑arc angle; α = 360° − β is the top‑arc angle.
◉ Large α (>180°) or small β (<180°) flags meaningful imbalance.
◉ Intuition: large α suggests potential selling pressure; small β implies fragile support. HUD cells highlight these conditions.
5.3 OB/OS Spike
OverBought/OverSold (OB/OS) labels appear when directional volume spikes align with a 7‑oscillator vote (RSI, Stoch, %R, CCI, MFI, DeMarker, StochRSI).
◉ OB label (red): unusually high sell volume + enough OB votes
◉ OS label (teal): unusually high buy volume + enough OS votes
Minimum votes and sync window are user‑configurable; dotted connectors can link labels to the candle wick.
5.4 Top3 Volume Peaks
Within the P window the script ranks the top three BUY peaks (B1–B3) and top three SELL peaks (S1–S3).
◉ B1 and S1 are drawn as horizontal resistance (at B1 High) and support (at S1 Low) zones with adjustable thickness (ticks/percent/ATR).
◉ The HUD dedicates six cells to show ↑/↓/Δ for each rank, and prints the exact High (B1) and Low (S1) inline in their cells.
6) Reading the HUD — A Quick Checklist
◉ Meta: Confirm P and both timeframes (host & lower).
◉ Host TF block: Compare current ↑/↓/Δ against their SMAs.
◉ Segments: Contrast C→B vs B→A deltas to gauge momentum change.
◉ Wings: Right‑wing color/angle = now; left wing = recent origin.
◉ α / β: Look for α > 180° or β < 180° as imbalance cues.
◉ OB/OS: Note labels, color (red/teal), and the vote count.
◉Top3: Keep B1 (resistance) and S1 (support) on your radar.
Use these together to sketch scenarios and invalidation levels; never rely on a single signal in isolation.
[ 7) Example Highlights (What the table conveys) /i]
◉ Row 1 shows the indicator name, the analysis length P (default 55), and both TFs used for computation and display.
◉ B1 / S1 blocks summarize each side’s peak within the window, with Δ indicating buyer/seller dominance at that peak and inline price (B1 High / S1 Low) for actionable levels.
◉ Angle cells for each wing report the top/bottom line angles vs. the horizontal, reflecting the directional posture.
◉ Ranks B2/B3 and S2/S3 extend context beyond the top peak on each side.
◉ α / β cells quantify the orientation gap at B; changes reflect shifting buyer/seller influence on trend strength.
Together these visuals often reveal whether the “wings” resemble a strong, upward‑tilted arm supported by buyer volume—but always corroborate with your broader toolkit
8) Practical Tips & Tuning
◉ Choose P by market structure. For daily charts, 34–89 bars often works well.
◉ Lower TF choice: Thin symbols → 5–15m; liquid symbols → 1m.
◉ Near‑zero angle: In noisy markets, consider 5–7° instead of 3°.
◉ OB/OS votes: Daily charts often work with 3–4 votes; lower TFs may prefer 4–5.
◉ Zone thickness: Tie B1/S1 zone thickness to ATR so it scales with volatility.
◉ Colors: Feel free to theme the primary/negative colors; keep Δ<0 mapped to the negative color for readability.
Combine with price action: Use this indicator alongside structure, trendlines, and other tools for stronger decisions.
Technical Notes
Pine Script v6.
◉ Up/Down split via TradingView/ta library call requestUpAndDownVolume(lowerTf).
◉ HUD‑first design; drawings for Wings/αβ/OBOS/Top3 align with the same sign/threshold logic used in the table.
Disclaimer: This indicator is provided solely for educational and analytical purposes. It does not constitute financial advice, nor is it a recommendation to buy or sell any security. Always conduct your own research and use multiple tools before making trading decisions.

Secret bubbleSecret bubble
Why Might It Be Called "Bubbles"?
Although not officially named so, some traders or platforms might refer to Bollinger Bands as "bubbles" because:
The bands visually surround the price like a bubble.
During low volatility, the bands form a tight "bubble" around price.
Breakouts look like the price "popping out" of a bubble.
Hence, the nickname "пузырьки" (bubbles) could be a colloquial or visual metaphor for Bollinger Bands in Russian-speaking trading communities.
Conclusion
While there is no official technical indicator called "Bubbles", the term likely refers to Bollinger Bands due to their visual appearance and function. This powerful tool helps traders assess volatility, spot potential reversals, and time entries and exits. When combined with other analysis methods, Bollinger Bands remain a cornerstone of modern technical trading.
🔧 Tip: You can find Bollinger Bands on almost every trading platform (TradingView, MetaTrader, ThinkorSwim) by searching "Bollinger Bands" in the indicators list.
