Exchange and Symbol by BULL┃NETThe B | N EXSY (Exchange and Symbol by BULL | NET)
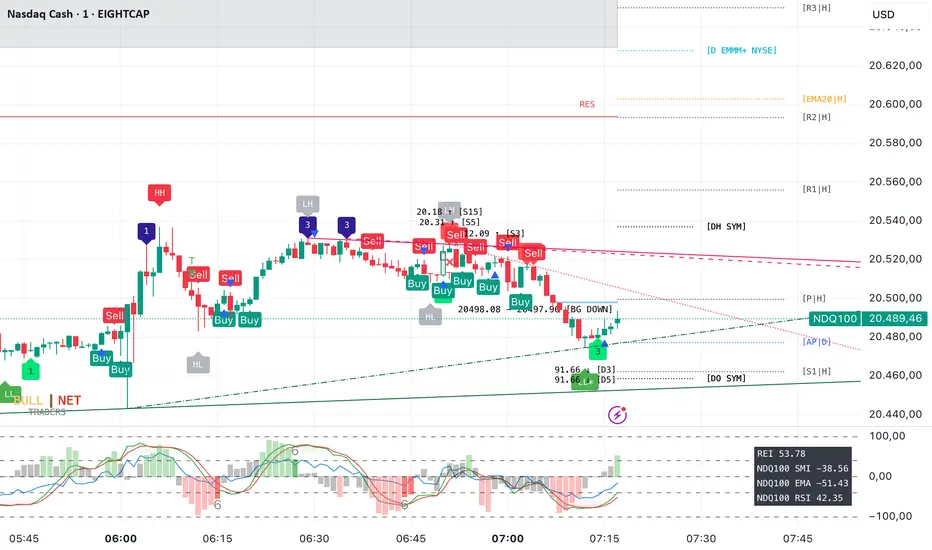
indicator provides traders using CFD brokers with the most significant price and time events from the stock exchange of the underlying original index or security. For example traders are able to easily identify the price at the Daily Open and Close time of up to three additional stock exchanges. Traders can choose from a huge list of options including the values from the current and previous Day, Week, Month and Year. In addition traders can enable the display of the Expected Move by either implied or historical volatility. The indicator can show Open Gaps (gap between close and open of two trading sessions) also which traders would usually see only on the original chart of an index or security.
The B | N EXSY indicator can help traders to make better entry decisions based on the real market sessions.
█ ⚠️ DISCLAIMER – READ BEFORE YOU USE ⚠️
█ CONCEPTS
CFD Brokers allow you to trade many indices, securities and assets up to 24 hours per day and 7 days per week (24/7). Other than Crypto Assets indices and securities get the highest transaction volume during the session of a stock market. Most importantly while its “Home Stock Market” is open.
For example the NASDAQ or S&P500 will see the highest volume during the business hours of the New York Stock Exchange (NYSE) between 9:30am and 4:00pm (America New York Time). Most CFD Providers however will open their Trading session approximately 9.5 hours before the NYSE opens and even 2 hours before Japan and Australia open the markets.
The German DAX on the other hand is listed on the Deutsche Börse Xetra which is open from 9:00 to 17:00 (Europe Berlin Time). CFD Brokers will open the DAX for trading differently between 9 and 5.5 hours before the XETRA opens.
Therefore most available indicators for visualizing the day open will show different results. Traders at Broker A will tell a totally different story than traders at Broker B who opened 3 hours later.
Furthermore people trading the NASDAQ often keep an eye on the London Stock Exchange (LSE) as well and those trading the NIKKEI often watch the NYSE besides its home at the Japan Exchange Group (JPX).
Advanced traders know about the importance of those information and I have seen thousands of charts where people draw horizontal lines to mark the open and closing prices as well as the session highs and lows. They do it every day and often for different indices and securities. A time consuming job.
Here is where B | N EXSY steps in to give traders objective information for Intraday trading (Daily timeframe and below). More or less automatically. Choose your primary stock exchange (e.g. the NYSE if you trade the NASDAQ) and optionally a second and third stock exchange you are interested in. Individually select the price events you like to see or keep the defaults. Make your own cosmetic decision on how you want the data to be displayed. Save your chart and you will never have to draw a horizontal line again to see the High of the current session, the Low of last week, the monthly Open or yesterdays Close. Sharing ideas with other traders in the chat groups will be easy because everyone is relying on the same information. Even across different CFD Brokers (with slightly different prices of course). Your Technical Analysis can become much more efficient.
█ FEATURES
B | N EXSY is highly customizable. The default settings are optimized for the NASDAQ during the NYSE session. Following you get an overview of all options in the settings menu.
— LOWER TIMEFRAME
The “Lower Timeframe in Minutes” defaults to 30 minutes and should work with most CFD Brokers and stock exchanges. If not you will get a huge warning on the chart suggesting different settings. If e.g. a CFD Broker opens the Dax session at 3:15 but the XETRA opens at 9:00 you have to change the setting to 15.
— STOCK EXCHANGE
Primary is mandatory and defaults to NYSE (New York Stock Exchange) which is the home of the NASDAQ, the S&P 500, the Dow Jones and many others. Usually you select the home stock exchange of the instrument you trade. E.g. XETRA for the DAX, JPX for the NIKKEI or HKEX for the HANG SENG.
The Second and Third stock exchange is optional and defaults to NONE. If e.g. you trade Nvidia with NYSE as the primary stock exchange and you are interested in the High and Low of the European Session select LSE (London Stock Exchange) or XETRA (Deutsche Börse Xetra) as the second stock exchange. By default the indicator will show only information about the current day and week for the second and third stock exchange but you can change that later.
— VISUALIZE SESSIONS
Beginners and less advanced traders sometimes want to see the time span of a session. By default this feature is disabled because it adds more noise to the chart. You can select each of the three stock exchanges individually and select your preferred color.
— CUSTOM STOCK EXCHANGE
Whether your preferred Stock Exchange is missing in the dropdowns or you have a special purpose (see the HOW TO USE section) you can add your own ”Stock Exchange” to the chart.
Name and Country are optional and get displayed in tooltips only. Opening, Closing and Timezone are important. Enter the Open and Close time as HOUR:MINUTE in 24 hour notation (22:00 instead of 10:00pm). The timezone can be provided as time offset in GMT or UTC notation (e.g. GMT+2 or UTC-5) or as a time zone name listed in the IANA Time Zone Database ( e.g. "America/New_York" or “Europe/Berlin”). If you do it wrong the indicator will give wrong results or don’t work at all.
— EXPECTED MOVE IMPLIED VOLATILITY
With this setting you can enable the calculation and display of the Expected Move (EM). Option and Future traders should be familiar with this feature. Those who never heard about should read about it on the internet. Your favorite search engine will provide you with lots of information about it.
After enabling the feature you have to select a source to calculate the EM. The drop down menu contains popular sources and are named after the indices they are based on. It is crucial that the setting match the index, symbol or asset you are trading. If e.g. you are trading a CFD for the NASDAQ you have to select Nasdaq as source. Wrong settings will lead to wrong calculations.
If the source you need is missing you select manually and enter the implied Volatility in the field “Value for manual calculation”. If e.g. you trade the Nikkei you have to enter the current value of the JNIV manually because it is not listed at TradingView so I can’t add it.
The other settings control the Line Color and Style, the Label Color and Size as well as the Text Color.
The indicator will display the EM+ and EM- as well as the 2 and 3 Sigma EM +/-. On the Daily Chart it will display the Weekly Expected Moves. On any timeframe below you will get the Daily Expected Moves.
— EXPECTED MOVE HISTORICAL VOLATILITY
Other than the feature above, this one calculates the EM based on historical volatility.
After enabling the feature you have to enter the amount of days to look back to calculate volatility. Like you would do for a SMA, EMA or RSI. The default is 10 days. Depending on what asset you trade you might play a little with this setting.
The other settings control the Line Color and Style, the Label Color and Size as well as the Text Color.
Like with the Expected Move Implied Volatility this setting will show weekly data on the daily timeframe and daily information on intraday timeframes.
— LABEL AND LINE COSMETICS
The settings in this section control how lines and labels get positioned on the chart and which information the labels show.
● Bar Offset
The bar offset controls the horizontal distance to the last bar on the chart where lines end. By default it is “2” bars to the right. If you use other indicators which show information on the right side you can increase this value to avoid overlapping.
● Bar Anchor
The bar anchor controls where lines start. Default is “lastbar”.
Lastbar sets the start of lines to the last bar of the chart. This provides a very clean chart without lines crossing bars to the left.
Moving sets lines to start at the bar at which the price event occurred. The line for the daily open (DO) price will stay at the opening bar of the stock market and it will do so when it becomes the previous day open (PDO) the next day. The line that marks the session High (DH) will be anchored to the highest bar while the stock market is open. Therefore it might be moving with the advancing chart. The same counts for the session Low (DL). The next day these lines become the previous day high or low (PDH / PDL) and stay at the highest/lowest bar from the day before. This logic is forwarded to all other lines (weekly, monthly, yearly). This gives traders a quick orientation on which bar a price event occurred but a less clean chart.
If you choose Day as bar anchor all lines will start at the beginning of the Brokers trading session in which the price event took place. This is also true for the roll over event when e.g. the Week Open (WO) will become the Previous Week Open (PWO) next Week. Unlike the “moving” setting the new WO and PWO will be anchored to the beginning of the Week. Traders will have a box like view into the past.
● Label Distance Divisor
This setting is used to calculate the minimum vertical distance of labels in means of price points. The internal formular takes the day close price and divides it by the number entered in this field. If e.g. the daily closing price was 5000 the minimum vertical distance would become 1 price point if you enter 5000 for this setting. If the price difference of two events would then be less than 1 the labels would be positioned higher and lower to prevent overlapping. The default value is fine for the Nasdaq (~ 19000 / 5000 = 3.8 at the time of writing). For other indices, securities and assets you should change the divider to your likings or as needed to set the trigger for repositioning labels.
● Distance Modifier
This setting is used to control the vertical shift of the label. The default of Zero disables the setting and activates an internal function which makes a decision based on the used timeframe on the chart (0.1 less than m30, 0.5 from m30 to h4, 0.75 above h4 and 1 for daily). The logic takes the minimum vertical distance and multiplies it by the distance modifier.
In the example above for the label distance divider a label would shift by 1.9 price points on a 30 minute chart if two lines trigger the minimum vertical distance. On the upper line the label moves up and on the lower line it moves down. If three lines are too close to each other the label in the middle does not get moved. If more lines break the minimum distance some labels will overlap until the price is advancing. Those events happen most likely during the opening of a stock exchange.
Price events with equal price, e.g. Day and Week Open at the start of a new week or Day, Week, Month, Year High in the event of a new ATH will get lined up (stacked) horizontally.
While this cosmetic corrections have limits overlapping can be reduced to a minimum.
● Show Price
● Show Exchange
Labels can show up to three information. The price, the stock exchange and the event. The event however can’t be disabled. If you select both options you will see something like
5347.84 for the Day Close of the S&P 500 on the New York Stock Exchange
With this two settings you can disable the display of price and/or stock exchange.
If you have chosen to use more than one stock exchange the setting for “Show Exchange” will be ignored. Otherwise you would not know which Day Close (DC) or Day High (DH) belongs to which stock exchange
● Enable Tooltip
If you decide to hide the price and/or exchange on the label it can be useful to get this information in a tooltip while hovering with the mouse over the label. On the contrary it might become annoying with labels popping up if you have a nervous mouse finger. The feature is disabled by default.
● Equalize Label Size
The size of labels is one of the most discussed issues. Some say it is too small other say it is too big. Label size matters on different devices. “Normal” labels can be too large on a smartphone and too small on a 4k display. And the size is crucial for the automatic horizontal stacking of labels. You simply can’t line up a small, normal and large label in Pine Script (the programming language at TradingView). The stacking is done by prepending labels with spaces to shift them to the right.
This setting overloads all individual size settings for the price events below and activates the automatic horizontal stacking of labels with equal price. It is a convenient way to change the size of all labels with one click in case you have different layouts for different devices.
If you disable this feature you can set the label size individually but you lose the horizontal stacking. This can be useful for traders who display only a few price events or for educational purpose where you want to point out a special event.
— CURRENT DAY
This setting controls which price events of the current day (current session) get displayed and how they appear.
Primary O/C
Enable the Day Open (DO) and Close (DC) for the primary stock exchange. Enabled by default.
Primary H/L
Enable the Day High (DH) and Low (DL) for the primary stock exchange. Enabled by default.
Other O/C
Enable the Day Open (DO) and Close (DC) for the second and third stock exchange. Enabled by default.
Other H/L
Enable the Day High (DH) and Low (DL) for the second and third stock exchange. Enabled by default.
The settings below control the Line Color and Style, the Label Color and Size as well as the Text Color.
— PREVIOS DAY
This setting controls which price events of the previous day get displayed and how they appear.
Primary O/C
Enable the Previous Day Open (PDO) and Close (PDC) for the primary stock exchange. Enabled by default.
Primary H/L
Enable the Previous Day High (PDH) and Low (PDL) for the primary stock exchange. Enabled by default.
Other O/C
Enable the Previous Day Open (PDO) and Close (PDC) for the second and third stock exchange. Disabled by default.
Other H/L
Enable the Previous Day High (PDH) and Low (PDL) for the second and third stock exchange. Disabled by default.
The settings below control the Line Color and Style, the Label Color and Size as well as the Text Color.
— OPENING HOUR
This setting controls whether and how to display the famous opening hour (High and Low within the first 60 minutes after stock market opens)
Primary Cur
Display the Current Day Opening Hour High (OH) and Low (OL) for the primary stock exchange. Enabled by default.
Primary Pre
Display the Previous Day Opening Hour High (POH) and Low (POL) for the primary stock exchange. Enabled by default.
Other Cur
Display the Current Day Opening Hour High (OH) and Low (OL) for the second and third stock exchange. Disabled by default.
Other Pre
Display the Previous Day Opening Hour High (POH) and Low (POL) for the second and third stock exchange. Disabled by default.
The settings below control the Line Color and Style, the Label Color and Size as well as the Text Color.
— CURRENT WEEK
This setting controls which price events of the current week get displayed and how they appear.
Primary O/C
Enable the Week Open (WO) and Close (WC) for the primary stock exchange. Enabled by default.
Primary H/L
Enable the Week High (WH) and Low (WL) for the primary stock exchange. Enabled by default.
Other O/C
Enable the Week Open (WO) and Close (WC) for the second and third stock exchange. Enabled by default.
Other H/L
Enable the Week High (WH) and Low (WL) for the second and third stock exchange. Enabled by default.
The settings below control the Line Color and Style, the Label Color and Size as well as the Text Color.
— PREVIOUS WEEK
This setting controls which price events of the previous week get displayed and how they appear.
Primary O/C
Enable the Previous Week Open (PWO) and Close (PWC) for the primary stock exchange. Enabled by default.
Primary H/L
Enable the Previous Week High (PWH) and Low (PWL) for the primary stock exchange. Enabled by default.
Other O/C
Enable the Previous Week Open (PWO) and Close (PWC) for the second and third stock exchange. Disabled by default.
Other H/L
Enable the Previous Week High (PWH) and Low (PWL) for the second and third stock exchange. Disabled by default.
The settings below control the Line Color and Style, the Label Color and Size as well as the Text Color.
— CURRENT MONTH
This setting controls which price events of the current month get displayed and how they appear.
Primary O/C
Enable the Month Open (MO) and Close (MC) for the primary stock exchange. Enabled by default.
Primary H/L
Enable the Month High (MH) and Low (ML) for the primary stock exchange. Enabled by default.
Other O/C
Enable the Month Open (MO) and Close (MC) for the second and third stock exchange. Disabled by default.
Other H/L
Enable the Month High (MH) and Low (ML) for the second and third stock exchange. Disabled by default.
The settings below control the Line Color and Style, the Label Color and Size as well as the Text Color.
— PREVIOUS MONTH
This setting controls which price events of the previous month get displayed and how they appear.
Primary O/C
Enable the Previous Month Open (PMO) and Close (PMC) for the primary stock exchange. Enabled by default.
Primary H/L
Enable the Previous Month High (PMH) and Low (PML) for the primary stock exchange. Enabled by default.
Other O/C
Enable the Previous Month Open (PMO) and Close (PMC) for the second and third stock exchange. Disabled by default.
Other H/L
Enable the Previous Month High (PMH) and Low (PML) for the second and third stock exchange. Disabled by default.
The settings below control the Line Color and Style, the Label Color and Size as well as the Text Color.
— CURRENT YEAR
This setting controls which price events of the current year get displayed and how they appear.
Primary O/C
Enable the Year Open (YO) and Close (YC) for the primary stock exchange. Enabled by default.
Primary H/L
Enable the Year High (YH) and Low (YL) for the primary stock exchange. Enabled by default.
Other O/C
Enable the Year Open (YO) and Close (YC) for the second and third stock exchange. Disabled by default.
Other H/L
Enable the Year High (YH) and Low (YL) for the second and third stock exchange. Disabled by default.
The settings below control the Line Color and Style, the Label Color and Size as well as the Text Color.
— PREVIOUS YEAR
This setting controls which price events of the previous year get displayed and how they appear.
Primary O/C
Enable the Previous Year Open (PYO) and Close (PYC) for the primary stock exchange. Enabled by default.
Primary H/L
Enable the Previous Year High (PYH) and Low (PYL) for the primary stock exchange. Enabled by default.
Other O/C
Enable the Previous Year Open (PYO) and Close (PYC) for the second and third stock exchange. Disabled by default.
Other H/L
Enable the Previous Year High (PYH) and Low (PYL) for the second and third stock exchange. Disabled by default.
The settings below control the Line Color and Style, the Label Color and Size as well as the Text Color.
— ALL TIME HIGH
This setting controls whether the All Time High gets displayed on the daily chart and how it appears. See the limitations section (Amount of data) for details why the ATH will be displayed in the daily timeframe only.
Primary ATH
Enable the All Time High (ATH) for the primary stock exchange. Enabled by default.
OTHER ATH
Enable the All Time High (ATH) for the second and third stock exchange. Enabled by default.
The settings below control the Line Color and Style, the Label Color and Size as well as the Text Color.
— GAPFINDER
If you look at the original charts of an index (not the CFD Broker chart) you will see mostly every day a price difference between the closing price of the last session and the opening price of the current session. There are many names for those gaps. I call them Open Gaps or Kassa Gaps. Advanced traders know the market tends to close those gaps more or less quickly. Which is one more reason to know where the real previous day close was.
There are market conditions where those gaps are not closed within the new session. Those gap leftovers will usually be closed in the future. Some earlier, some later. If those gaps get more and more you quickly lose track and if the time comes to close one of the gaps you might not remember or recognize the price has reached an old gap. The charts of CFDs don’t even show such gaps due to the fact they trade nearly 24 hours per day.
The Gapfinder will display such leftovers after the end of the next session. If e.g. the previous day close was at 18000 and the market opens the next session at 18200 we have an Open Gap of 200 price points. If the Low of this session is 18100 after the session closes there would be rest gap of 100 price points. The Gapfinder then would mark it with a rectangle colored according to the direction of the Gap.
Bullish gaps result from an opening price (DO) and the current Day Low (DL) being higher than the previous day close (PDC).
Bearish gaps arise from an opening price (DO) and the current Day High (DH) being lower than the previous day closing price (PDC).
If you like you can change the color for the gaps and the text color.
— MISCELLANEOUS
To streamline the appearance of prices they are set to display two decimals only. Numbers get rounded! However, trading currency pairs or crypto assets might need to display the full amount of decimals. In that case simply disable the setting “2 Decimals”.
By default the indicator will display a small table in the lower right corner of the chart. It contains information about the current symbol, the selected primary stock exchange and the volatility. If you don’t like or need it you can disable it.
The “Unreliable Data” checkbox usually should not affect you. But if it does it can be really helpful. The B | N EXSY indicator uses Lower Timeframe Data to match CFD Broker and Stock Exchange opening times. If e.g. a CFD Broker opens at 0:00 and the stock exchange at 9:30 the script uses data from the 30 Minutes timeframe if you view the chart at any timeframe higher than 30 Minutes. Why? Because if you chose a four hours timeframe there is simply no bar that starts at 9:30 in this case. The CFD brokers h4 bars will start at 0:00, 4:00, 8:00, 12:00 and so on.
Sometimes the data stream of the Broker and TradingView get out of sync and a 4 hour bar eventually returns just 6x 30 Minutes instead of 8. During development of the indicator I came across of at least two brokers with such an issue. Only in one time frame and a specific period of time. If this happens the price information might be wrong. A Day High might be to low, a Day Close missing or the Day Open not be found. In such cases your trade might fail. To prevent such situations the indicator performs a daily consistency check at 12:00 during the session for an exchange in its time zone if this option is enabled.
In case the data are found unreliable you will see a label above the bar with further information in the tooltip of the label. You should than compare the information from this timeframe with the lower timeframe selected in the field below. Anway, it is a rare issue and if you, like me, work on multiple timeframes in parallel this bug probably won’t affect you.
— HOLIDAYS
● Holidays
If there is a holiday on a stock market the original chart of an index will simply show no bars for that day. CFD Broker charts will only show no bars if it is an international holiday or the broker itself is affected by the holiday. Take for example Memorial Day in the U.S. Although the NYSE is closed you can trade e.g. the NASDAQ until around 17:30 European Time which is the closing time of the LSE and XETRA. Unfortunately the closing time in Europe is after the opening time in the U.S. If the price goes up in the overlapping time you eventually see a new Weekly High (WH) if you rely on the chart of the CFD Broker. To avoid such misleading information the B | N EXSY indicator allows you to enter holidays for each stock market individually. If the indicator finds a holiday it will not store or add data for this day.
By default there are already the market holidays entered for the NYSE, XETRA, FSX and LSE in 2024. If you want to add your own holidays you have to follow some simple rules:
1. The entry must start in a new line below existing entries (carriage return)
2. The entry starts with the shortcut of the stock exchange exactly as you see them in the dropdown menu.
3. The stock exchange gets separated from the holidays with a colon (:)
4. Each holiday is entered as YYYY-MM-DD
5. Holidays get separated with a single whitespace
The entry for the Japan Exchange Group (JPX) in 2025 would start with:
JPX: 2025-01-01, 2025-01-02, 2025-01-03, 2025-01-08
Completed by the rest of the holiday.
If you make your own entries please keep a copy of the line you added because it will be replaced by the defaults if the indicator gets an update. Best practices would be to provide your holiday string in the comment section and I add it as a default.
● Early Close
Some stock exchanges close the market early before some holidays. In that case the indicator won’t be able to fetch the closing price for that day and the daily roll over won’t work for the day after the holiday. To prevent chaos you can enter the days with early close in this field.
By default the early closing days of the NYSE are already entered. If you want to add your own early closing days you have to follow some simple rules:
1. The entry must start in a new line below existing entries (carriage return)
2. The entry starts with the shortcut of the stock exchange exactly as you see them in the dropdown menu.
3. The stock exchange gets separated from the days with a colon (:)
4. Each early closing day is entered as YYYY-MM-DD-HH-MM where HH-MM is the closing time of this day entered in 24 hours format in the timezone of the stock exchange
5. Days get separated with a single whitespace
The entry for the day before Thanksgiving at the NYSE in 2025 would be:
NYSE:2025-11-25-13-00
This is because the market will close early at 1:00 PM on November 25, 2025, the day before Thanksgiving. The time is provided in 24-hour format as 13:00.
-------------------------------------------------------
Disclaimer BullNet: The information provided in this document is for educational and informational purposes only and does not constitute financial, investment, or trading advice. Any use of the content is at your own risk. No liability is assumed for any losses or damages resulting from reliance on this information. Trading financial instruments involves significant risks, including the potential loss of all invested capital. There is no guarantee of profits or specific outcomes. Please conduct your own research and consult a professional financial advisor if needed.
Disclaimer TradingView: According to the www.tradingview.com
Copyright: 2025-BULLNET - All rights reserved.
Roadmap:
Version 1.0 03.03.2025
In den Scripts nach "Implied volatility" suchen
[blackcat] L1 Dynamic Volatility IndicatorThe volatility indicator (Volatility) is used to measure the magnitude and instability of price changes in financial markets or a specific asset. This thing is usually used to assess how risky the market is. The higher the volatility, the greater the fluctuation in asset prices, but brother, the risk is also relatively high! Here are some related terms and explanations:
- Historical Volatility: The actual volatility of asset prices over a certain period of time in the past. This thing is measured by calculating historical data.
- Implied Volatility: The volatility inferred from option market prices, used to measure market expectations for future price fluctuations.
- VIX Index (Volatility Index): Often referred to as the "fear index," it predicts the volatility of the US stock market within 30 days in advance. This is one of the most famous volatility indicators in global financial markets.
Volatility indicators are very important for investors and traders because they can help them understand how unstable and risky the market is, thereby making wiser investment decisions.
Today I want to introduce a volatility indicator that I have privately held for many years. It can use colors to judge sharp rises and falls! Of course, if you are smart enough, you can also predict some potential sharp rises and falls by looking at the trend!
In the financial field, volatility indicators measure the magnitude and instability of price changes in different assets. They are usually used to assess the level of market risk. The higher the volatility, the greater the fluctuation in asset prices and therefore higher risk. Historical Volatility refers to the actual volatility of asset prices over a certain period of time in the past, which can be measured by calculating historical data; while Implied Volatility is derived from option market prices and used to measure market expectations for future price fluctuations. In addition, VIX Index is commonly known as "fear index" and is used to predict volatility in the US stock market within 30 days. It is one of the most famous volatility indicators in global financial markets.
Volatility indicators are very important for investors and traders because they help them understand market uncertainty and risk, enabling them to make wiser investment decisions. The L1 Dynamic Volatility Indicator that I am introducing today is an indicator that measures volatility and can also judge sharp rises and falls through colors!
This indicator combines two technical indicators: Dynamic Volatility (DV) and ATR (Average True Range), displaying warnings about sharp rises or falls through color coding. DV has a slow but relatively smooth response, while ATR has a fast but more oscillating response. By utilizing their complementary characteristics, it is possible to construct a structure similar to MACD's fast-slow line structure. Of course, in order to achieve fast-slow lines for DV and ATR, first we need to unify their coordinate axes by normalizing them. Then whenever ATR's yellow line exceeds DV's purple line with both curves rapidly breaking through the threshold of 0.2, sharp rises or falls are imminent.
However, it is important to note that relying solely on the height and direction of these two lines is not enough to determine the direction of sharp rises or falls! Because they only judge the trend of volatility and cannot determine bull or bear markets! But it's okay, I have already considered this issue early on and added a magical gradient color band. When the color band gradually turns warm, it indicates a sharp rise; conversely, when the color band tends towards cool colors, it indicates a sharp fall! Of course, you won't see the color band in sideways consolidation areas, which avoids your involvement in unnecessary trades that would only waste your funds! This indicator is really practical and with it you can better assess market risks and opportunities!

VOLQ Sigma TableThis indicator replaces the implied volatility of VOLQ with the daily volatility and reflects that value into the price on the NDX chart to create the VOLQ standard deviation table.
It will only be useful for stocks related to the Nasdaq Index.
For example, NDX, QQQ or so.
And we want to predict the range of weekly fluctuations by plotting those values as a line in the future.
It is expressed as High 2σ by adding the standard deviation 2 sigma value of the VOLQ value from last week's closing price.
It is expressed as High 1σ by adding the standard deviation 1 sigma value of the VOLQ value from last week's closing price.
It is expressed as Low 1σ by subtracting the standard deviation 1 sigma value of the VOLQ value from the closing price of the previous week.
It is expressed as Low 2σ by subtracting the standard deviation 2 sigma value of the VOLQ value from last week's closing price.
1day predicts daily fluctuations.
2day predicts 2-day fluctuations.
3day predicts 3-day fluctuations.
4day predicts 4-day fluctuations.
5day predicts 5-day fluctuations.
In the settings you can select the start date to display the VOLQ line via input.
-----------------------------
What motivated me to create this indicator?
From my point of view, the reason for classifying vix volq historical volatility (realized volatility) is that the most important point is that VIXX and VolQ are calculated from implied volatility. It can be standardized as one-month volatility. There are many strike prices, but exchanges use the implied volatility of options traded on their own exchanges.
Because historical volatility depends on how the period is set, to compare with VIXX, we compare it with a month, that is, 20 business days. One-month implied volatility means (actually different depending on the strike price), because option traders expect that the one-month volatility will be this much, and it is the volatility created by volatility trading.
So we see it as the volatility expected by derivatives traders, especially volatility traders.
I'm trying to infer what the market thinks will fluctuate this much from the numbers generated there.

Prometheus Black-Scholes Option PricesThe Black-Scholes Model is an option pricing model developed my Fischer Black and Myron Scholes in 1973 at MIT. This is regarded as the most accurate pricing model and is still used today all over the world. This script is a simulated Black-Scholes model pricing model, I will get into why I say simulated.
What is an option?
An option is the right, but not the obligation, to buy or sell 100 shares of a certain stock, for calls or puts respective, at a certain price, on a certain date (assuming European style options, American options can be exercised early). The reason these agreements, these contracts exist is to provide traders with leverage. Buying 1 contract to represent 100 shares of the underlying, more often than not, at a cheaper price. That is why the price of the option, the premium , is a small number. If an option costs $1.00 we pay $100.00 for it because 100 shares * 1 dollar per share = 100 dollars for all the shares. When a trader purchases a call on stock XYZ with a strike of $105 while XYZ stock is trading at $100, if XYZ stock moves up to $110 dollars before expiration the option has $5 of intrinsic value. You have the right to buy something at $105 when it is trading at $110. That agreement is way more valuable now, as a result the options premium would increase. That is a quick overview about how options are traded, let's get into calculating them.
Inputs for the Black-Scholes model
To calculate the price of an option we need to know 5 things:
Current Price of the asset
Strike Price of the option
Time Till Expiration
Risk-Free Interest rate
Volatility
The price of a European call option 𝐶 is given by:
𝐶 = 𝑆0 * Φ(𝑑1) − 𝐾 * 𝑒^(−𝑟 * 𝑇) * Φ(𝑑2)
where:
𝑆0 is the current price of the underlying asset.
𝐾 is the strike price of the option.
𝑟 is the risk-free interest rate.
𝑇 is the time to expiration.
Φ is the cumulative distribution function of the standard normal distribution.
𝑑1 and 𝑑2 are calculated as:
𝑑1 = (ln(𝑆0 / 𝐾) + (𝑟 + (𝜎^2 / 2)) * 𝑇) / (𝜎 * sqrt(𝑇))
𝑑2= 𝑑1 - (𝜎 * sqrt(𝑇))
𝜎 is the volatility of the underlying asset.
The price of a European put option 𝑃 is given by:
𝑃 = 𝐾 * 𝑒^(−𝑟 * 𝑇) * Φ(−𝑑2) − 𝑆0 * Φ(−𝑑1)
where 𝑑1 and 𝑑2 are as defined above.
Key Assumptions of the Black-Scholes Model
The price of the underlying asset follows a lognormal distribution.
There are no transaction costs or taxes.
The risk-free interest rate and volatility of the underlying asset are constant.
The underlying asset does not pay dividends during the life of the option.
The markets are efficient, meaning that all known information is already reflected in the prices.
Options can only be exercised at expiration (European-style options).
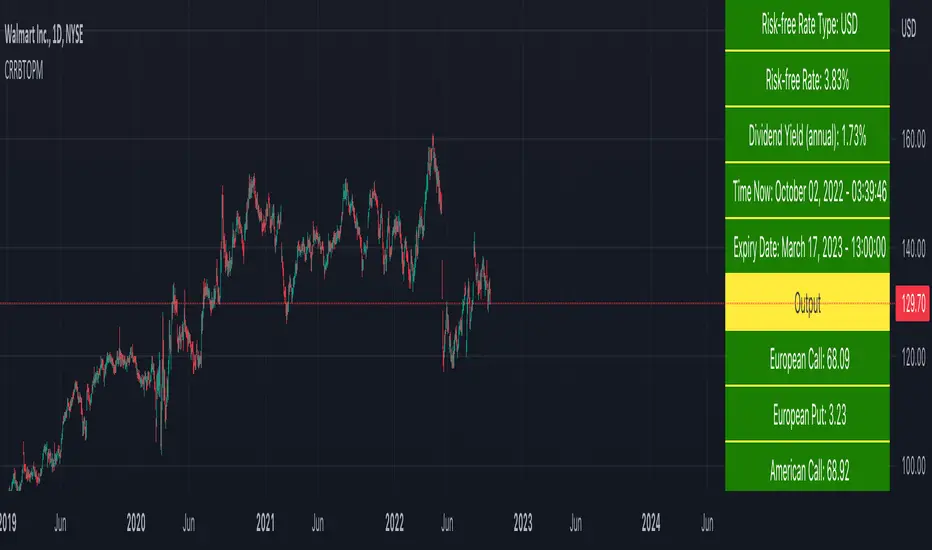
Understanding the Script
Here I have arrows pointing to specific spots on the table. They point to Historical Volatility and Inputted DTE . Inputted DTE is a value the user may input to calculate premium for options that expire in that many days. Historical Volatility , is the value calculated by this code.
length = 252 // One year of trading days
hv = ta.stdev(math.log(close / close ), length) * math.sqrt(365)
And then made daily like the Black-Scholes model needs from this step in the code.
hv_daily = request.security(syminfo.tickerid, "1D", hv)
The user has the option to input their own volatility to the Script. I will get into why that may be advantageous in a moment. If the user chooses to do so the Script will change which value it is using as so.
hv_in_use = which_sig == false ? hv_daily : sig
There is a lot going on in this image but bare with me, it will all make sense by the end. The column to the far left of both the green and maroon colored columns represent the strike price of the contract, if the numbers are white that means the contract is out of the money, gray means in the money. If you remember from the calculation this represents the price to buy or sell shares at, for calls or puts respective. The column second from the left shows a value for Simulated Market Price . This is a necessary part of this script so we can show changes in implied volatility. See, when we go to our brokerages and look at options prices, sure the price was calculated by a pricing model, but that is rarely the true price of the model. Market participant sentiment affects this value as their estimates for future volatility, Implied Volatility changes.
For example, if a call option is supposed to be worth $1.00 from the pricing model, however everyone is bullish on the stock and wants to buy calls, the premium may go to $1.20 from $1.00 because participants juice up the Implied Volatility . Higher Implied Volatility generally means higher premium, given enough time to expiration. Buying an option at $0.80 when it should be worth $1.00 due to changes in sentiment is a big part of the Quant Trading industry.
Of course I don't have access to an actual exchange so get prices, so I modeled participant decisions by adding or subtracting a small random value on the "perfect premium" from the Black-Scholes model, and solving for implied volatility using the Newton-Raphson method.
It is like when we have speed = distance / time if we know speed and time , we can solve for distance .
This is what models the changing Implied Volatility in the table. The other column in the table, 3rd from the left, is the Black-Scholes model price without the changes of a random number. Finally, the 4th column from the left is that Implied Volatility value we calculated with the modified option price.
More on Implied Volatility
Implied Volatility represents the future expected volatility of an asset. As it is the value in the future it is not know like Historical Volatility, only projected. We provide the user with the option to enter their own Implied Volatility to start with for better modeling of options close to expiration. If you want to model options 1 day from expiration you will probably have to enter a higher Implied Volatility so that way the prices will be higher. Since the underlying is so close to expiration they are traded so much and traders manipulate their Implied Volatility , increasing their value. Be safe while trading these!
Thank you all for clicking on my indicator and reading this description! Happy coding, Happy trading, Be safe!
Good reference: www.investopedia.com

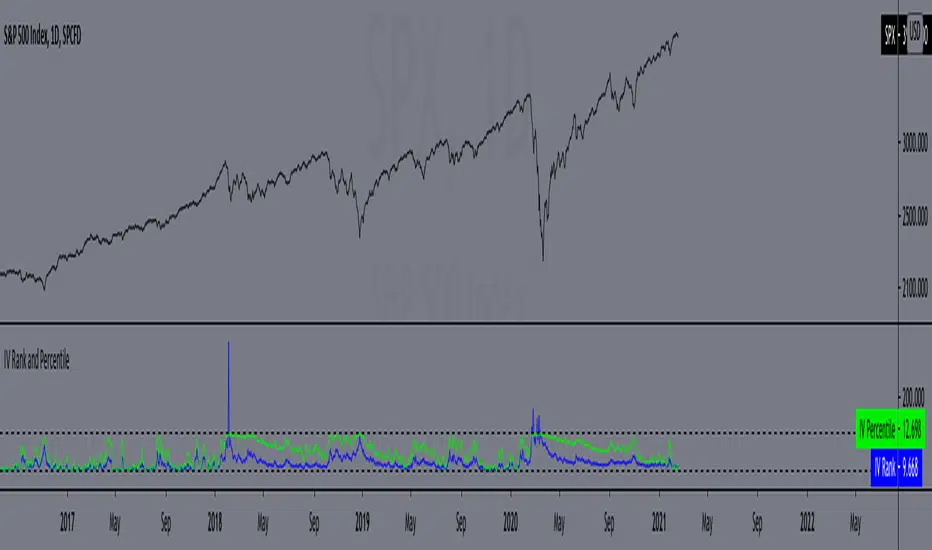
IV Rank and Percentile"All stocks in the market have unique personalities in terms of implied volatility (their option prices). For example, one stock might have an implied volatility of 30%, while another has an implied volatility of 50%. Even more, the 30% IV stock might usually trade with 20% IV, in which case 30% is high. On the other hand, the 50% IV stock might usually trade with 75% IV, in which case 50% is low.
So, how do we determine whether a stock's option prices (IV) are relatively high or low?
The solution is to compare each stock's IV against its historical IV levels. We can accomplish this by converting a stock's current IV into a rank or percentile.
Implied Volatility Rank (IV Rank) Explained
Implied volatility rank (IV rank) compares a stock's current IV to its IV range over a certain time period (typically one year).
Here's the formula for one-year IV rank:
(Current IV - 1 Year Low IV) / (1 Year High IV - 1 Year Low IV) * 100
For example, the IV rank for a 20% IV stock with a one-year IV range between 15% and 35% would be:
(20% - 15%) / (35% - 15%) = 25%
An IV rank of 25% means that the difference between the current IV and the low IV is only 25% of the entire IV range over the past year, which means the current IV is closer to the low end of historical levels of implied volatility.
Furthermore, an IV rank of 0% indicates that the current IV is the very bottom of the one-year range, and an IV rank of 100% indicates that the current IV is at the top of the one-year range.
Implied Volatility Percentile (IV Percentile) Explained
Implied volatility percentile (IV percentile) tells you the percentage of days in the past that a stock's IV was lower than its current IV.
Here's the formula for calculating a one-year IV percentile:
Number of trading days below current IV / 252 * 100
As an example, let's say a stock's current IV is 35%, and in 180 of the past 252 days, the stock's IV has been below 35%. In this case, the stock's 35% implied volatility represents an IV percentile equal to:
180/252 * 100 = 71.42%
An IV percentile of 71.42% tells us that the stock's IV has been below 35% approximately 71% of the time over the past year.
Applications of IV Rank and IV Percentile
Why does it help to know whether a stock's current implied volatility is relatively high or low? Well, many traders use IV rank or IV percentile as a way to determine appropriate strategies for that stock.
For example, if a stock's IV rank is 90%, then a trader might look to implement strategies that profit from a decrease in the stock's implied volatility, as the IV rank of 90% indicates that the stock's current IV is at the top of its range over the past year (for a one-year IV rank).
On the other hand, if a stock's IV rank is 0%, then traders might look to implement strategies that profit from an increase in implied volatility, as the IV rank of 0% indicates the stock's current implied volatility is at the bottom of its range over the past year."
This script approximates IV by using the VIX products, which calculate the 30-day implied volatility of the specified security.
*Includes an option for repainting -- default value is true, meaning the script will repaint the current bar.
False = Not Repainting = Value for the current bar is not repainted, but all past values are offset by 1 bar.
True = Repainting = Value for the current bar is repainted, but all past values are correct and not offset by 1 bar.
In both cases, all of the historical values are correct, it is just a matter of whether you prefer the current bar to be realistically painted and the historical bars offset by 1, or the current bar to be repainted and the historical data to match their respective price bars.
As explained by TradingView,`f_security()` is for coders who want to offer their users a repainting/no-repainting version of the HTF data.
Cox-Ross-Rubinstein Binomial Tree Options Pricing Model [Loxx]Cox-Ross-Rubinstein Binomial Tree Options Pricing Model is an options pricing panel calculated using an N-iteration (limited to 300 in Pine Script due to matrices size limits) "discrete-time" (lattice based) method to approximate the closed-form Black–Scholes formula. Joshi (2008) outlined varying binomial options pricing model furnishes a numerical approach for the valuation of options. Significantly, the American analogue can be estimated using the binomial tree. This indicator is the complex calculation for Binomial option pricing. Most folks take a shortcut and only calculate 2 iterations. I've coded this to allow for up to 300 iterations. This can be used to price American Puts/Calls and European Puts/Calls. I'll be updating this indicator will be updated with additional features over time. If you would like to learn more about options, I suggest you check out the book textbook Options, Futures and other Derivative by John C Hull.
***This indicator only works on the daily timeframe!***
A quick graphic of what this all means:
In the graphic, "n" are the steps, in this case we can do up to 300, in production we'd need to do 5-15K. That's a lot of steps! You can see here how the binomial tree fans out. As I said previously, most folks only calculate 2 steps, here we are calculating up to 300.
Want to learn more about Simple Introduction to Cox, Ross Rubinstein (1979) ?
Watch this short series "Introduction to Basic Cox, Ross and Rubinstein (1979) model."
Limitations of Black Scholes options pricing model
This is a widely used and well-known options pricing model, factors in current stock price, options strike price, time until expiration (denoted as a percent of a year), and risk-free interest rates. The Black-Scholes Model is quick in calculating any number of option prices. But the model cannot accurately calculate American options, since it only considers the price at an option's expiration date. American options are those that the owner may exercise at any time up to and including the expiration day.
What are Binomial Trees in options pricing?
A useful and very popular technique for pricing an option involves constructing a binomial tree. This is a diagram representing different possible paths that might be followed by the stock price over the life of an option. The underlying assumption is that the stock price follows a random walk. In each time step, it has a certain probability of moving up by a certain percentage amount and a certain probability of moving down by a certain percentage amount. In the limit, as the time step becomes smaller, this model is the same as the Black–Scholes–Merton model.
What is the Binomial options pricing model ?
This model uses a tree diagram with volatility factored in at each level to show all possible paths an option's price can take, then works backward to determine one price. The benefit of the Binomial Model is that you can revisit it at any point for the possibility of early exercise. Early exercise is executing the contract's actions at its strike price before the contract's expiration. Early exercise only happens in American-style options. However, the calculations involved in this model take a long time to determine, so this model isn't the best in rushed situations.
What is the Cox-Ross-Rubinstein Model?
The Cox-Ross-Rubinstein binomial model can be used to price European and American options on stocks without dividends, stocks and stock indexes paying a continuous dividend yield, futures, and currency options. Option pricing is done by working backwards, starting at the terminal date. Here we know all the possible values of the underlying price. For each of these, we calculate the payoffs from the derivative, and find what the set of possible derivative prices is one period before. Given these, we can find the option one period before this again, and so on. Working ones way down to the root of the tree, the option price is found as the derivative price in the first node.
Inputs
Spot price: select from 33 different types of price inputs
Calculation Steps: how many iterations to be used in the Binomial model. In practice, this number would be anywhere from 5000 to 15000, for our purposes here, this is limited to 300
Strike Price: the strike price of the option you're wishing to model
% Implied Volatility: here you can manually enter implied volatility
Historical Volatility Period: the input period for historical volatility; historical volatility isn't used in the CRRBT process, this is to serve as a sort of benchmark for the implied volatility,
Historical Volatility Type: choose from various types of implied volatility, search my indicators for details on each of these
Option Base Currency: this is to calculate the risk-free rate, this is used if you wish to automatically calculate the risk-free rate instead of using the manual input. this uses the 10 year bold yield of the corresponding country
% Manual Risk-free Rate: here you can manually enter the risk-free rate
Use manual input for Risk-free Rate? : choose manual or automatic for risk-free rate
% Manual Yearly Dividend Yield: here you can manually enter the yearly dividend yield
Adjust for Dividends?: choose if you even want to use use dividends
Automatically Calculate Yearly Dividend Yield? choose if you want to use automatic vs manual dividend yield calculation
Time Now Type: choose how you want to calculate time right now, see the tool tip
Days in Year: choose how many days in the year, 365 for all days, 252 for trading days, etc
Hours Per Day: how many hours per day? 24, 8 working hours, or 6.5 trading hours
Expiry date settings: here you can specify the exact time the option expires
Take notes:
Futures don't risk free yields. If you are pricing options of futures, then the risk-free rate is zero.
Dividend yields are calculated using TradingView's internal dividend values
This indicator only works on the daily timeframe
Included
Option pricing panel
Loxx's Expanded Source Types
Support and Resistance levels from Options DataINTRODUCTION
This script is designed to visualize key support and resistance levels derived from options data on TradingView charts. It overlays lines, labels, and boxes to highlight levels such as Put Walls (gamma support), Call Walls (gamma resistance), Gamma Flip points, Vanna levels, and more.
These levels are intended to help traders identify potential areas of price magnetism, reversal, or breakout based on options market dynamics. All calculations and visualizations are based on user-provided data pasted into the input field, as Pine Script cannot directly fetch external options data due to platform limitations (explained below).
For convenience, my website allows users to interact with a bot that will generate the string for up to 30 tickers at once getting nearly real-time data on demand (data is cached for 15min). With the output string pasted into this indicator, it's a bliss to shuffle through your portfolio and see those levels for each ticker.
The script is open-source under TradingView's terms, allowing users to study, modify, and improve it. It draws inspiration from common options-derived metrics like gamma exposure and vanna, which are widely discussed in financial literature. No external code is copied without rights; all logic is original or based on standard mathematical formulas.
How the Options Levels Are Calculated
The levels displayed by this script are not computed within Pine Script itself—instead, they rely on pre-calculated values provided by the user (via a pasted data string). These values are derived from options chain data fetched from financial APIs (e.g., using libraries like yfinance in Python). Here's a step-by-step overview of how these levels are generally calculated externally before being input into the script:
Fetching Options Data:
Historical and current options chain data for a ticker (e.g., strikes, open interest, volume, implied volatility, expirations) is retrieved for near-term expirations (e.g., up to 90 days).
Current stock price is obtained from recent history.
Gamma Support (Put Wall) and Resistance (Call Wall):
Gamma Calculation: For each option, gamma (the rate of change of delta) is computed using the Black-Scholes formula:
gamma = N'(d1) / (S * sigma * sqrt(T))
where S is the stock price, K is the strike, T is time to expiration (in years), sigma is implied volatility, r is the risk-free rate (e.g., 0.0445), and N'(d1) is the normal probability density function.
Weighted gamma is multiplied by open interest and aggregated by strike.
The Put Wall is the strike below the current price with the highest weighted gamma from puts (acting as support).
The Call Wall is the strike above the current price with the highest weighted gamma from calls (acting as resistance).
Short-term versions focus on strikes closer to the money (e.g., within 10-15% of the price).
Gamma Flip Level:
Net dealer gamma exposure (GEX) is calculated across all strikes:
GEX = sum (gamma * OI * 100 * S^2 * sign * decay)
where sign is +1 for calls/-1 for puts, and decay is 1 / sqrt(T).
The flip point is the price where net GEX changes sign (from positive to negative or vice versa), interpolated between strikes.
Vanna Levels:
Vanna (sensitivity of delta to volatility) is calculated:
vanna = -N'(d1) * d2 / sigma
where d2 = d1 - sigma * sqrt(T).
Weighted by open interest, the highest positive and negative vanna strikes are identified.
Other Levels:
S1/R1: Significant strikes with high combined open interest and volume (80% OI + 20% volume), below/above price for support/resistance.
Implied Move: ATM implied volatility scaled by S * sigma * sqrt(d/365) (e.g., for 7 days).
Call/Put Ratio: Total call contracts divided by put contracts (OI + volume).
IV Percentage: Average ATM implied volatility.
Options Activity Level: Average contracts per unique strike, binned into levels (0-4).
Stop Loss: Dynamically set below the lowest support (e.g., Put Wall, Gamma Flip), adjusted by IV (tighter in low IV).
Fib Target: 1.618 extension from Put Wall to Call Wall range.
Previous day levels are stored for comparison (e.g., to detect Call Wall movement >2.5% for alerts).
Effect as Support and Resistance in Technical Trading
Options levels like gamma walls influence price action due to market maker hedging:
Put Wall (Gamma Support): High put gamma below price creates a "magnet" effect—market makers buy stock as price falls, providing support. Traders might look for bounces here as entry points for longs.
Call Wall (Gamma Resistance): High call gamma above price leads to selling pressure from hedging, acting as resistance. Rejections here could signal trims, sells or even shorts.
Gamma Flip: Where gamma exposure flips sign, often a volatility pivot—crossing it can accelerate moves (bullish above, bearish below).
Vanna Levels: Positive/negative vanna indicate volatility sensitivity; crosses may signal regime shifts.
Implied Move: Shows expected range; prices outside suggest overextension.
S1/R1 and Fib Target: Volume/OI clusters act as classic S/R; Fib extensions project upside targets post-breakout.
In trading, these are not guarantees—combine with TA (e.g., volume, trends). High activity levels imply stronger effects; low CP ratio suggests bearish sentiment. Alerts trigger on proximities/crosses for awareness, not advice.
Limitations of the TradingView Platform for Data Pulling
TradingView's Pine Script is sandboxed for security and performance:
No direct internet access or API calls (e.g., can't fetch yfinance data in-script).
Limited to chart data/symbol info; no real-time options chains.
Inputs are static per load; updates require manual pasting.
Caching isn't persistent across sessions.
This prevents dynamic data pulling, ensuring scripts remain lightweight but requiring external tools for fresh data.
Creative Solution for On-Demand Data Pulling
To overcome these limitations, users can use external tools or scripts (e.g., Python-based) to fetch and compute levels on demand. The tool processes tickers, generates a formatted string (e.g., "TICKER:level1,level2,...;TIMESTAMP:unix;"), and users paste it into the script's input. This keeps data fresh without violating platform rules, as computation happens off-platform. For example, run a local script to query APIs and output the string—adaptable for any ticker.
Script Functionality Breakdown
Inputs: Custom data string (parsed for levels/timestamp); toggles for short-term/previous/Vanna/stop loss; style options (colors, transparency).
Parsing: Extracts levels for the chart symbol; gets timestamp for "updated ago" display.
Drawing: Lines/labels for levels; boxes for gamma zones/implied move; clears old elements on updates.
Info Panel: Top-right summary with metrics (CP ratio, IV, distances, activity); emojis for quick status.
Alerts: Conditions for proximities, crosses, bounces (e.g., 0.5% bounce from Put Wall).
Performance: Uses vars for persistence; efficient for real-time.
This script is educational—test thoroughly. Not financial advice; past performance isn't indicative of future results. Feedback welcome via TradingView comments.

Rule of 16 - LowerThe "Rule of 16" is a simple guideline used by traders and investors to estimate the expected annualized volatility of the S&P 500 Index (SPX) based on the level of the CBOE Volatility Index (VIX). The VIX, often referred to as the "fear gauge" or "fear index," measures the market's expectations for future volatility. It is calculated using the implied volatility of a specific set of S&P 500 options.
The Rule of 16 provides a rough approximation of the expected annualized percentage change in the S&P 500 based on the VIX level. Here's how it works:
Find the VIX level: Look up the current value of the VIX. Let's say it's currently at 20.
Apply the Rule of 16: Divide the VIX level by 16. In this example, 20 divided by 16 equals 1.25.
Result: The result of this calculation represents the expected annualized percentage change in the S&P 500. In this case, 1.25% is the estimated annualized volatility.
So, according to the Rule of 16, a VIX level of 20 suggests an expected annualized volatility of approximately 1.25% in the S&P 500.
Here's how you can use the Rule of 16:
Market Sentiment: The VIX is often used as an indicator of market sentiment. When the VIX is high (above its historical average), it suggests that investors expect higher market volatility, indicating potential uncertainty or fear in the markets. Conversely, when the VIX is low, it suggests lower expected volatility and potentially more confidence in the markets.
Risk Management: Traders and investors can use the Rule of 16 to estimate the potential risk associated with their portfolios. For example, if you have a portfolio of S&P 500 stocks and the VIX is at 20, you can use the Rule of 16 to estimate that the annualized volatility of your portfolio may be around 1.25%. This information can help you make decisions about position sizing and risk management.
Option Pricing: Options traders may use the Rule of 16 to get a quick estimate of the implied annualized volatility priced into S&P 500 options. It can help them assess whether options are relatively expensive or cheap based on the VIX level.
It's important to note that the Rule of 16 is a simplification and provides only a rough estimate of expected volatility. Market conditions and the relationship between the VIX and the S&P 500 can change over time. Therefore, it should be used as a guideline rather than a precise forecasting tool. Traders and investors should consider other factors and use additional analysis to make informed decisions.

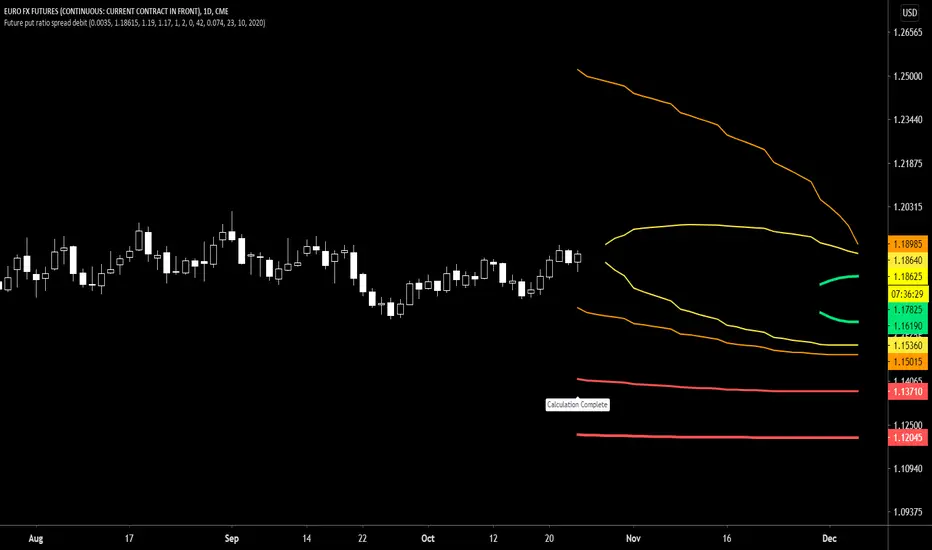
Future put ratio spread debit indicatorFuture Put ratio spread debit indicator developed by Chobotaru Brothers.
You need to have basic knowledge in option trading to use this indicator!
This spread is a DEBIT SPREAD.
The indicator shows P&L lines of the options strategy. Use only for futures since the mathematical model of options for Future instruments is different from stocks. Plus, the days' representation in futures is also different from stocks (stocks have fewer days than futures ).
***Each strategy in options is based on different mathematical equations, use this indicator only for the strategy in the headline.***
What does the indicator do?
The indicator is based on the Black-Scholes model, which uses partial differential equations to determine the option pricing. Due to options non-linear behavior, it is hard to visualize the option price. The indicator calculates the solutions of the Black-Scholes equation and plots them on the chart so traders can view how the option pricing will behave.
How the indicator does it?
The indicator uses five values (four dominants and one less dominant) to solve the Black-Scholes equation. The values are stock price, the strike price of the option, time to expiration, risk-free interest rate, and implied volatility .
How the indicator help the users?
-View the risks and rewards so you can know the profit targets in advance which means you can compare different options in different strikes.
-View the volatility change impact so you can know the risk and the P&L changes in case of a change in the volatility over the life of the option before you enter the trade.
-View the passage of time impact so you can know where and when you could realize a profit.
-Multi-timeframes so you can stay on the same chart (Daily and below).
All these features are to help the user improve his analysis while trading options.
How to use it?
The user needs to obtain from the “option chain” the following inputs:
-Debit paid: The debit paid for one unit of options strategy. Minimum value: 0.00001.
-Instrument price when entered spread: the stock price when you enter the options strategy.
-Upper strike price: the upper strike price of the options strategy.
-Lower strike price: the lower strike price of the options strategy.
- Upper Strike numbers of puts . This number has to be less than the number of puts that were sold.
- Lower Strike number of puts . This number has to be greater than the number of puts that were bought.
-Interest rate: find the risk-free interest rate from the U.S. DEPARTMENT OF THE TREASURY. Example: for 2% interest rate, input: 0.02.
-Days to expire: how many days until the option expires.
-Volatility: the implied volatility of the option bought/sold. Example: for 45% implied volatility , input: 0.45.
-Day of entry: A calendar day of the month that the option bought/sold.
-Month of entry: Calendar month the option bought/sold.
-Year of entry: Calendar year the option bought/sold.
After entering all the inputs, press Ok and you should see “Calculation Complete” on the chart.
The user should not change the entry date and days to expire inputs as time passes after he entered the trade.
How to access the indicator?
Use the link below to obtain access to the indicator
Future put ratio spread credit indicatorFuture Put ratio spread credit indicator developed by Chobotaru Brothers.
You need to have basic knowledge in option trading to use this indicator!
This spread is a CREDIT SPREAD.
The indicator shows P&L lines of the options strategy. Use only for futures since the mathematical model of options for Future instruments is different from stocks. Plus, the days' representation in futures is also different from stocks (stocks have fewer days than futures ).
***Each strategy in options is based on different mathematical equations, use this indicator only for the strategy in the headline.***
What does the indicator do?
The indicator is based on the Black-Scholes model, which uses partial differential equations to determine the option pricing. Due to options non-linear behavior, it is hard to visualize the option price. The indicator calculates the solutions of the Black-Scholes equation and plots them on the chart so traders can view how the option pricing will behave.
How the indicator does it?
The indicator uses five values (four dominants and one less dominant) to solve the Black-Scholes equation. The values are stock price, the strike price of the option, time to expiration, risk-free interest rate, and implied volatility .
How the indicator help the users?
-View the risks and rewards so you can know the profit targets in advance which means you can compare different options in different strikes.
-View the volatility change impact so you can know the risk and the P&L changes in case of a change in the volatility over the life of the option before you enter the trade.
-View the passage of time impact so you can know where and when you could realize a profit.
-Multi-timeframes so you can stay on the same chart (Daily and below).
All these features are to help the user improve his analysis while trading options.
How to use it?
The user needs to obtain from the “option chain” the following inputs:
-Credit received: The credit received for one unit of options strategy. Minimum value: 0.00001.
-Instrument price when entered spread: the stock price when you enter the options strategy.
-Upper strike price: the upper strike price of the options strategy.
-Lower strike price: the lower strike price of the options strategy.
- Upper Strike numbers of puts . This number has to be less than the number of puts that were sold.
- Lower Strike number of puts . This number has to be greater than the number of puts that were bought.
-Interest rate: find the risk-free interest rate from the U.S. DEPARTMENT OF THE TREASURY. Example: for 2% interest rate, input: 0.02.
-Days to expire: how many days until the option expires.
-Volatility: the implied volatility of the option bought/sold. Example: for 45% implied volatility , input: 0.45.
-Day of entry: A calendar day of the month that the option bought/sold.
-Month of entry: Calendar month the option bought/sold.
-Year of entry: Calendar year the option bought/sold.
After entering all the inputs, press Ok and you should see “Calculation Complete” on the chart.
The user should not change the entry date and days to expire inputs as time passes after he entered the trade.
How to access the indicator?
Use the link below to obtain access to the indicator

Future call ratio spread debit indicatorFuture Call ratio spread debit indicator developed by Chobotaru Brothers.
You need to have basic knowledge in option trading to use this indicator!
This spread is a DEBIT SPREAD.
The indicator shows P&L lines of the options strategy. Use only for stocks since the mathematical model of options for Future instruments is different from futures . Plus, the days' representation in futures is also different from stocks (stocks have fewer days than futures ).
***Each strategy in options is based on different mathematical equations, use this indicator only for the strategy in the headline.***
What does the indicator do?
The indicator is based on the Black-Scholes model, which uses partial differential equations to determine the option pricing. Due to options non-linear behavior, it is hard to visualize the option price. The indicator calculates the solutions of the Black-Scholes equation and plots them on the chart so traders can view how the option pricing will behave.
How the indicator does it?
The indicator uses five values (four dominants and one less dominant) to solve the Black-Scholes equation. The values are stock price, the strike price of the option, time to expiration, risk-free interest rate, and implied volatility .
How the indicator help the users?
-View the risks and rewards so you can know the profit targets in advance which means you can compare different options in different strikes.
-View the volatility change impact so you can know the risk and the P&L changes in case of a change in the volatility over the life of the option before you enter the trade.
-View the passage of time impact so you can know where and when you could realize a profit.
-Multi-timeframes so you can stay on the same chart (Daily and below).
All these features are to help the user improve his analysis while trading options.
How to use it?
The user needs to obtain from the “option chain” the following inputs:
-Debit paid: The debit paid for one unit of options strategy. Minimum value: 0.00001.
-Instrument price when entered spread: the stock price when you enter the options strategy.
-Upper strike price: the upper strike price of the options strategy.
-Lower strike price: the lower strike price of the options strategy.
- Upper Strike numbers of calls . This number has to be greater than the number of calls that were bought.
- Lower Strike number of calls . This number has to be less than the number of calls that were sold.
-Interest rate: find the risk-free interest rate from the U.S. DEPARTMENT OF THE TREASURY. Example: for 2% interest rate, input: 0.02.
-Days to expire: how many days until the option expires.
-Volatility: the implied volatility of the option bought/sold. Example: for 45% implied volatility , input: 0.45.
-Day of entry: A calendar day of the month that the option bought/sold.
-Month of entry: Calendar month the option bought/sold.
-Year of entry: Calendar year the option bought/sold.
After entering all the inputs, press Ok and you should see “Calculation Complete” on the chart.
The user should not change the entry date and days to expire inputs as time passes after he entered the trade.
How to access the indicator?
Use the link below to obtain access to the indicator

Future Call ratio spread credit indicatorFuture Call ratio spread credit indicator developed by Chobotaru Brothers.
You need to have basic knowledge in option trading to use this indicator!
This spread is a CREDIT SPREAD.
The indicator shows P&L lines of the options strategy. Use only for futures since the mathematical model of options for Future instruments is different from stocks. Plus, the days' representation in futures is also different from stocks (stocks have fewer days than futures ).
***Each strategy in options is based on different mathematical equations, use this indicator only for the strategy in the headline.***
What does the indicator do?
The indicator is based on the Black-Scholes model, which uses partial differential equations to determine the option pricing. Due to options non-linear behavior, it is hard to visualize the option price. The indicator calculates the solutions of the Black-Scholes equation and plots them on the chart so traders can view how the option pricing will behave.
How the indicator does it?
The indicator uses five values (four dominants and one less dominant) to solve the Black-Scholes equation. The values are stock price, the strike price of the option, time to expiration, risk-free interest rate, and implied volatility .
How the indicator help the users?
-View the risks and rewards so you can know the profit targets in advance which means you can compare different options in different strikes.
-View the volatility change impact so you can know the risk and the P&L changes in case of a change in the volatility over the life of the option before you enter the trade.
-View the passage of time impact so you can know where and when you could realize a profit.
-Multi-timeframes so you can stay on the same chart (Daily and below).
All these features are to help the user improve his analysis while trading options.
How to use it?
The user needs to obtain from the “option chain” the following inputs:
-Credit received: The credit received for one unit of options strategy. Minimum value: 0.00001.
-Instrument price when entered spread: the stock price when you enter the options strategy.
-Upper strike price: the upper strike price of the options strategy.
-Lower strike price: the lower strike price of the options strategy.
- Upper Strike numbers of calls . This number has to be greater than the number of calls that were bought.
- Lower Strike number of calls . This number has to be less than the number of calls that were sold.
-Interest rate: find the risk-free interest rate from the U.S. DEPARTMENT OF THE TREASURY. Example: for 2% interest rate, input: 0.02.
-Days to expire: how many days until the option expires.
-Volatility: the implied volatility of the option bought/sold. Example: for 45% implied volatility , input: 0.45.
-Day of entry: A calendar day of the month that the option bought/sold.
-Month of entry: Calendar month the option bought/sold.
-Year of entry: Calendar year the option bought/sold.
After entering all the inputs, press Ok and you should see “Calculation Complete” on the chart.
The user should not change the entry date and days to expire inputs as time passes after he entered the trade.
How to access the indicator?
Use the link below to obtain access to the indicator

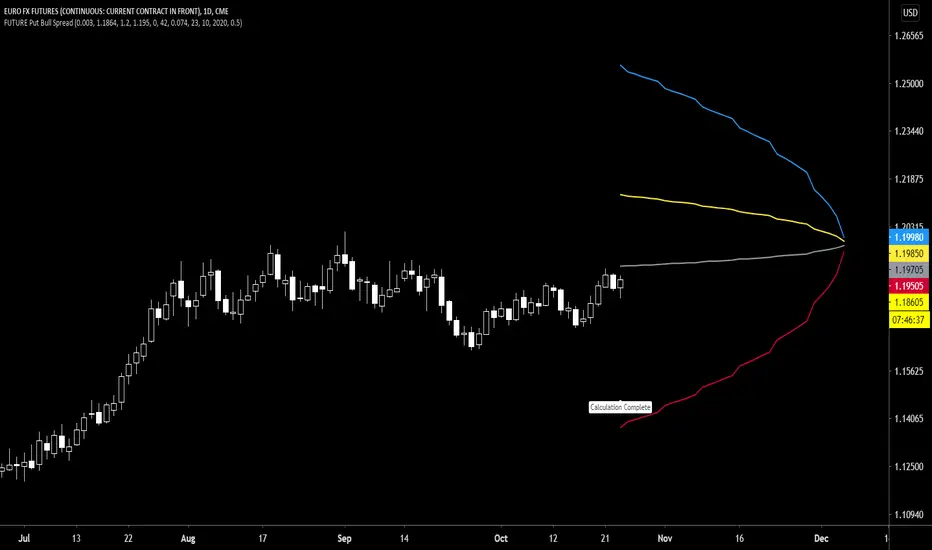
Future Put Bull Spread indicatorFuture Put bull spread indicator developed by Chobotaru Brothers.
You need to have basic knowledge in option trading to use this indicator!
This spread is a CREDIT SPREAD.
The indicator shows P&L lines of the options strategy. Use only for futures since the mathematical model of options for Future instruments is different from stocks. Plus, the days' representation in futures is also different from stocks (stocks have fewer days than futures ).
***Each strategy in options is based on different mathematical equations, use this indicator only for the strategy in the headline.***
What does the indicator do?
The indicator is based on the Black-Scholes model, which uses partial differential equations to determine the option pricing. Due to options non-linear behavior, it is hard to visualize the option price. The indicator calculates the solutions of the Black-Scholes equation and plots them on the chart so traders can view how the option pricing will behave.
How the indicator does it?
The indicator uses five values (four dominants and one less dominant) to solve the Black-Scholes equation. The values are stock price, the strike price of the option, time to expiration, risk-free interest rate, and implied volatility .
How the indicator help the users?
-View the risks and rewards so you can know the profit targets in advance which means you can compare different options in different strikes.
-View the volatility change impact so you can know the risk and the P&L changes in case of a change in the volatility over the life of the option before you enter the trade.
-View the passage of time impact so you can know where and when you could realize a profit.
-Multi-timeframes so you can stay on the same chart (Daily and below).
All these features are to help the user improve his analysis while trading options.
How to use it?
The user needs to obtain from the “option chain” the following inputs:
- Put spread price (Credit): The credit received for one unit of options strategy.
-Instrument price when entered spread: the stock price when you enter the options strategy.
-Upper strike price: the upper strike price of the options strategy.
-Lower strike price: the lower strike price of the options strategy.
-Interest rate: find the risk-free interest rate from the U.S. DEPARTMENT OF THE TREASURY. Example: for 2% interest rate, input: 0.02.
-Days to expire: how many days until the option expires.
-Volatility: the implied volatility of the option bought/sold. Example: for 45% implied volatility , input: 0.45.
-Day of entry: A calendar day of the month that the option bought/sold.
-Month of entry: Calendar month the option bought/sold.
-Year of entry: Calendar year the option bought/sold.
-% of Max Profit/Loss: Profit/loss line defined by the user. Minimum input (-0.95) ; maximum input (0.95).
Example: In this spread, -0.95 means, 95% of the options strategy maximum loss is reached and, 0.95 means, 95% of the options strategy maximum profit is reached.
After entering all the inputs, press Ok and you should see “Calculation Complete” on the chart.
The user should not change the entry date and days to expire inputs as time passes after he entered the trade.
How to access the indicator?
Use the link below to obtain access to the indicator
Future Put bear spread indicatorFuture Put bear spread indicator developed by Chobotaru Brothers.
You need to have basic knowledge in option trading to use this indicator!
This spread is a DEBIT SPREAD.
The indicator shows P&L lines of the options strategy. Use only for futures since the mathematical model of options for Future instruments is different from stocks. Plus, the days' representation in futures is also different from stocks (stocks have fewer days than futures ).
***Each strategy in options is based on different mathematical equations, use this indicator only for the strategy in the headline.***
What does the indicator do?
The indicator is based on the Black-Scholes model, which uses partial differential equations to determine the option pricing. Due to options non-linear behavior, it is hard to visualize the option price. The indicator calculates the solutions of the Black-Scholes equation and plots them on the chart so traders can view how the option pricing will behave.
How the indicator does it?
The indicator uses five values (four dominants and one less dominant) to solve the Black-Scholes equation. The values are stock price, the strike price of the option, time to expiration, risk-free interest rate, and implied volatility .
How the indicator help the users?
-View the risks and rewards so you can know the profit targets in advance which means you can compare different options in different strikes.
-View the volatility change impact so you can know the risk and the P&L changes in case of a change in the volatility over the life of the option before you enter the trade.
-View the passage of time impact so you can know where and when you could realize a profit.
-Multi-timeframes so you can stay on the same chart (Daily and below).
All these features are to help the user improve his analysis while trading options.
How to use it?
The user needs to obtain from the “option chain” the following inputs:
- Put spread price (Debit): The debit paid for one unit of options strategy.
-Instrument price when entered spread: the stock price when you enter the options strategy.
-Upper strike price: the upper strike price of the options strategy.
-Lower strike price: the lower strike price of the options strategy.
-Interest rate: find the risk-free interest rate from the U.S. DEPARTMENT OF THE TREASURY. Example: for 2% interest rate, input: 0.02.
-Days to expire: how many days until the option expires.
-Volatility: the implied volatility of the option bought/sold. Example: for 45% implied volatility , input: 0.45.
-Day of entry: A calendar day of the month that the option bought/sold.
-Month of entry: Calendar month the option bought/sold.
-Year of entry: Calendar year the option bought/sold.
-% of Max Profit/Loss: Profit/loss line defined by the user. Minimum input (-0.95) ; maximum input (0.95).
Example: In this spread, -0.95 means, 95% of the options strategy maximum loss is reached and, 0.95 means, 95% of the options strategy maximum profit is reached.
After entering all the inputs, press Ok and you should see “Calculation Complete” on the chart.
The user should not change the entry date and days to expire inputs as time passes after he entered the trade.
How to access the indicator?
Use the link below to obtain access to the indicator

Future Iron Condor / Butterfly buy or sell indicatorFuture Iron Condor / butterfly indicator developed by Chobotaru Brothers.
You need to have basic knowledge in option trading to use this indicator!
The indicator shows P&L lines of the options strategy. Use only for futures since the mathematical model of options for Future instruments is different from stocks. Plus, the days' representation in futures is also different from stocks (stocks have fewer days than futures ).
***Each strategy in options is based on different mathematical equations, use this indicator only for the strategy in the headline.***
What does the indicator do?
The indicator is based on the Black-Scholes model, which uses partial differential equations to determine the option pricing. Due to options non-linear behavior, it is hard to visualize the option price. The indicator calculates the solutions of the Black-Scholes equation and plots them on the chart so traders can view how the option pricing will behave.
How the indicator does it?
The indicator uses five values (four dominants and one less dominant) to solve the Black-Scholes equation. The values are stock price, the strike price of the option, time to expiration, risk-free interest rate, and implied volatility .
How the indicator help the users?
-View the risks and rewards so you can know the profit targets in advance which means you can compare different options in different strikes.
-View the volatility change impact so you can know the risk and the P&L changes in case of a change in the volatility over the life of the option before you enter the trade.
-View the passage of time impact so you can know where and when you could realize a profit.
-Multi-timeframes so you can stay on the same chart (Daily and below).
All these features are to help the user improve his analysis while trading options.
How to use it?
The user needs to obtain from the “option chain” the following inputs:
-Buy or sell (the strategy)
- Iron Condor price bought/sold: enter the price that you bought/sold one options strategy.
-Instrument price when bought/sold: the stock price when you bought/sold the options strategy.
-Upper strike price Top: the top upper strike price of the options strategy.
-Lower strike price Top: the top lower strike price of the options strategy.
-Upper strike price Bottom: the bottom upper strike price of the options strategy.
-Lower strike price Bottom: the bottom lower strike price of the options strategy.
-Interest rate: find the risk-free interest rate from the U.S. DEPARTMENT OF THE TREASURY. Example: for 2% interest rate, input: 0.02.
-Days to expire: how many days until the option expires.
-Volatility: the implied volatility of the option bought/sold. Example: for 45% implied volatility , input: 0.45.
-Day of entry: A calendar day of the month that the option bought/sold.
-Month of entry: Calendar month the option bought/sold.
-Year of entry: Calendar year the option bought/sold.
-% of Profit/Loss: Profit/loss line defined by the user. Minimum input (-0.95) ; maximum input (0.95).
Example: If the strategy was bought, -0.95 means, 95% of the options strategy maximum loss is reached. : If the strategy was bought, 0.95 means, 95% of the options strategy maximum profit is reached.
After entering all the inputs, press Ok and you should see “Calculation Complete” on the chart.
The user should not change the entry date and days to expire inputs as time passes after he entered the trade.
How to access the indicator?
Use the link below to obtain access to the indicator

Future Straddle / Strangle buy or sell indicatorFuture Straddle / strangle buy or sell indicator developed by Chobotaru Brothers.
You need to have basic knowledge in option trading to use this indicator!
The indicator shows P&L lines of the options strategy. Use only for futures since the mathematical model of options for Future instruments is different from stocks. Plus, the days' representation in futures is also different from stocks (stocks have fewer days than futures ).
***Each strategy in options is based on different mathematical equations, use this indicator only for the strategy in the headline.***
What does the indicator do?
The indicator is based on the Black-Scholes model, which uses partial differential equations to determine the option pricing. Due to options non-linear behavior, it is hard to visualize the option price. The indicator calculates the solutions of the Black-Scholes equation and plots them on the chart so traders can view how the option pricing will behave.
How the indicator does it?
The indicator uses five values (four dominants and one less dominant) to solve the Black-Scholes equation. The values are stock price, the strike price of the option, time to expiration, risk-free interest rate, and implied volatility .
How the indicator help the users?
-View the risks and rewards so you can know the profit targets in advance which means you can compare different options in different strikes.
-View the volatility change impact so you can know the risk and the P&L changes in case of a change in the volatility over the life of the option before you enter the trade.
-View the passage of time impact so you can know where and when you could realize a profit.
-Multi-timeframes so you can stay on the same chart (Daily and below).
All these features are to help the user improve his analysis while trading options.
How to use it?
The user needs to obtain from the “option chain” the following inputs:
-Buy or sell (the strategy)
- Straddle/strangle price bought/sold: enter the price that you bought/sold one options strategy.
-Instrument price when bought/sold: the stock price when you bought/sold the options strategy.
-Upper strike price: the upper strike price of the options strategy.
-Lower strike price: the lower strike price of the options strategy.
-Interest rate: find the risk-free interest rate from the U.S. DEPARTMENT OF THE TREASURY. Example: for 2% interest rate, input: 0.02.
-Days to expire: how many days until the option expires.
-Volatility: the implied volatility of the option bought/sold. Example: for 45% implied volatility , input: 0.45.
-Day of entry: A calendar day of the month that the option bought/sold.
-Month of entry: Calendar month the option bought/sold.
-Year of entry: Calendar year the option bought/sold.
-Risk to reward: Profit/loss line defined by the user. Minimum input (-0.95) ; maximum input (3).
Example: If the strategy was bought, -0.95 means, 95% of the options strategy value is lost (unrealized). If the strategy was bought, 3 means, the risk to reward is 3.
After entering all the inputs, press Ok and you should see “Calculation Complete” on the chart.
The user should not change the entry date and days to expire inputs as time passes after he entered the trade.
How to access the indicator?
Use the link below to obtain access to the indicator
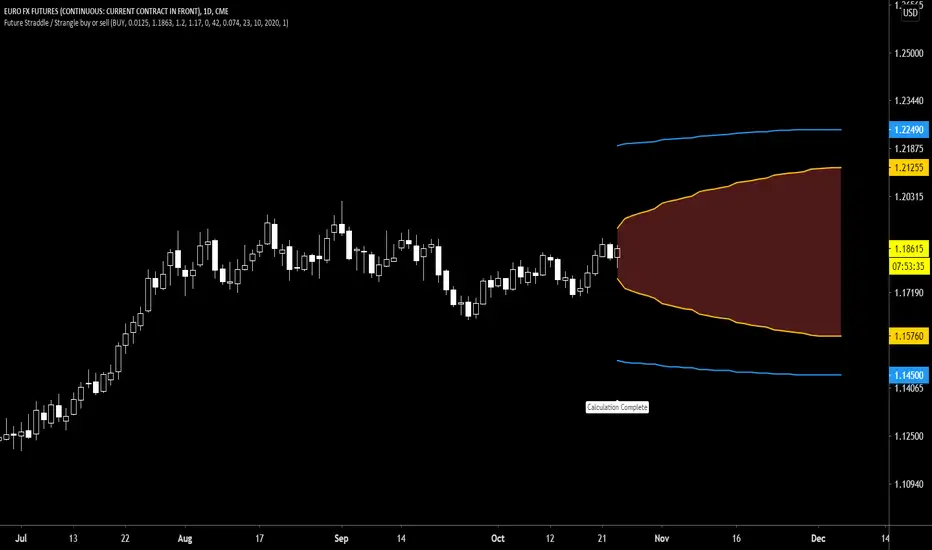
Future Call Bear Spread indicatorFuture Call bear spread indicator developed by Chobotaru Brothers.
You need to have basic knowledge in option trading to use this indicator!
This spread is a CREDIT SPREAD.
The indicator shows P&L lines of the options strategy. Use only for futures since the mathematical model of options for Future instruments is different from stocks. Plus, the days' representation in futures is also different from stocks (stocks have fewer days than futures ).
***Each strategy in options is based on different mathematical equations, use this indicator only for the strategy in the headline.***
What does the indicator do?
The indicator is based on the Black-Scholes model, which uses partial differential equations to determine the option pricing. Due to options non-linear behavior, it is hard to visualize the option price. The indicator calculates the solutions of the Black-Scholes equation and plots them on the chart so traders can view how the option pricing will behave.
How the indicator does it?
The indicator uses five values (four dominants and one less dominant) to solve the Black-Scholes equation. The values are stock price, the strike price of the option, time to expiration, risk-free interest rate, and implied volatility .
How the indicator help the users?
-View the risks and rewards so you can know the profit targets in advance which means you can compare different options in different strikes.
-View the volatility change impact so you can know the risk and the P&L changes in case of a change in the volatility over the life of the option before you enter the trade.
-View the passage of time impact so you can know where and when you could realize a profit.
-Multi-timeframes so you can stay on the same chart (Daily and below).
All these features are to help the user improve his analysis while trading options.
How to use it?
The user needs to obtain from the “option chain” the following inputs:
- Call spread price (Credit): The credit received for one unit of options strategy.
-Instrument price when entered spread: the stock price when you enter the options strategy.
-Upper strike price: the upper strike price of the options strategy.
-Lower strike price: the lower strike price of the options strategy.
-Interest rate: find the risk-free interest rate from the U.S. DEPARTMENT OF THE TREASURY. Example: for 2% interest rate, input: 0.02.
-Days to expire: how many days until the option expires.
-Volatility: the implied volatility of the option bought/sold. Example: for 45% implied volatility , input: 0.45.
-Day of entry: A calendar day of the month that the option bought/sold.
-Month of entry: Calendar month the option bought/sold.
-Year of entry: Calendar year the option bought/sold.
-% of Max Profit/Loss: Profit/loss line defined by the user. Minimum input (-0.95) ; maximum input (0.95).
Example: In this spread, -0.95 means, 95% of the options strategy maximum loss is reached and, 0.95 means, 95% of the options strategy maximum profit is reached.
After entering all the inputs, press Ok and you should see “Calculation Complete” on the chart.
The user should not change the entry date and days to expire inputs as time passes after he entered the trade.
How to access the indicator?
Use the link below to obtain access to the indicator
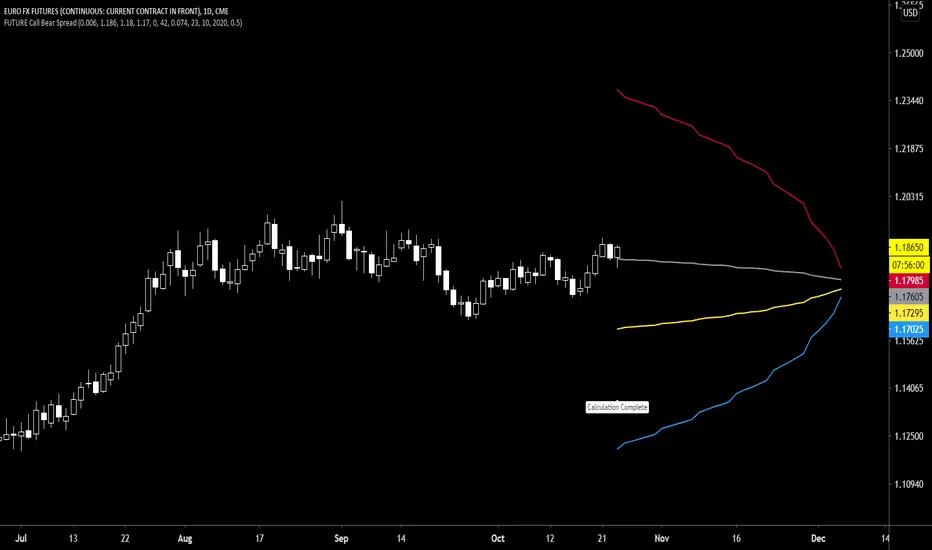
Future Call bull spread indicatorFuture Call bull spread indicator developed by Chobotaru Brothers.
You need to have basic knowledge in option trading to use this indicator!
This spread is a DEBIT SPREAD.
The indicator shows P&L lines of the options strategy. Use only for futures since the mathematical model of options for Future instruments is different from stocks. Plus, the days' representation in futures is also different from stocks (stocks have fewer days than futures ).
***Each strategy in options is based on different mathematical equations, use this indicator only for the strategy in the headline.***
What does the indicator do?
The indicator is based on the Black-Scholes model, which uses partial differential equations to determine the option pricing. Due to options non-linear behavior, it is hard to visualize the option price. The indicator calculates the solutions of the Black-Scholes equation and plots them on the chart so traders can view how the option pricing will behave.
How the indicator does it?
The indicator uses five values (four dominants and one less dominant) to solve the Black-Scholes equation. The values are stock price, the strike price of the option, time to expiration, risk-free interest rate, and implied volatility .
How the indicator help the users?
-View the risks and rewards so you can know the profit targets in advance which means you can compare different options in different strikes.
-View the volatility change impact so you can know the risk and the P&L changes in case of a change in the volatility over the life of the option before you enter the trade.
-View the passage of time impact so you can know where and when you could realize a profit.
-Multi-timeframes so you can stay on the same chart (Daily and below).
All these features are to help the user improve his analysis while trading options.
How to use it?
The user needs to obtain from the “option chain” the following inputs:
- Call spread price (Debit): The debit paid for one unit of options strategy.
-Instrument price when entered spread: the stock price when you enter the options strategy.
-Upper strike price: the upper strike price of the options strategy.
-Lower strike price: the lower strike price of the options strategy.
-Interest rate: find the risk-free interest rate from the U.S. DEPARTMENT OF THE TREASURY. Example: for 2% interest rate, input: 0.02.
-Days to expire: how many days until the option expires.
-Volatility: the implied volatility of the option bought/sold. Example: for 45% implied volatility , input: 0.45.
-Day of entry: A calendar day of the month that the option bought/sold.
-Month of entry: Calendar month the option bought/sold.
-Year of entry: Calendar year the option bought/sold.
-% of Max Profit/Loss: Profit/loss line defined by the user. Minimum input (-0.95) ; maximum input (0.95).
Example: In this spread, -0.95 means, 95% of the options strategy maximum loss is reached and, 0.95 means, 95% of the options strategy maximum profit is reached.
After entering all the inputs, press Ok and you should see “Calculation Complete” on the chart.
The user should not change the entry date and days to expire inputs as time passes after he entered the trade.
How to access the indicator?
Use the link below to obtain access to the indicator

Future Put option buy or sell indicatorFuture Put option indicator developed by Chobotaru Brothers.
You need to have basic knowledge in option trading to use this indicator!
The indicator shows P&L lines of the options strategy. Use only for futures since the mathematical model of options for Future instruments is different from stocks. Plus, the days' representation in futures is also different from stocks (stocks have fewer days than futures ).
***Each strategy in options is based on different mathematical equations, use this indicator only for the strategy in the headline.***
What does the indicator do?
The indicator is based on the Black-Scholes model, which uses partial differential equations to determine the option pricing. Due to options non-linear behavior, it is hard to visualize the option price. The indicator calculates the solutions of the Black-Scholes equation and plots them on the chart so traders can view how the option pricing will behave.
How the indicator does it?
The indicator uses five values (four dominants and one less dominant) to solve the Black-Scholes equation. The values are stock price, the strike price of the option, time to expiration, risk-free interest rate, and implied volatility .
How the indicator help the users?
-View the risks and rewards so you can know the profit targets in advance which means you can compare different options in different strikes.
-View the volatility change impact so you can know the risk and the P&L changes in case of a change in the volatility over the life of the option before you enter the trade.
-View the passage of time impact so you can know where and when you could realize a profit.
-Multi-timeframes so you can stay on the same chart (Daily and below).
All these features are to help the user improve his analysis while trading options.
How to use it?
The user needs to obtain from the “option chain” the following inputs:
-Buy or sell (the strategy)
-The option price bought: at what price did you bought/sold one option.
-Instrument price when bought: the stock price when you bought/sold the option.
-Strike price: the strike price of the option.
-Interest rate: find the risk-free interest rate from the U.S. DEPARTMENT OF THE TREASURY. Example: for 2% interest rate, input: 0.02.
-Days to expire: how many days until the option expires.
-Volatility: the implied volatility of the option bought/sold. Example: for 45% implied volatility , input: 0.45.
-Day of entry: A calendar day of the month that the option bought/sold.
-Month of entry: Calendar month the option bought/sold.
-Year of entry: Calendar year the option bought/sold.
-Risk to reward: Profit/loss line defined by the user. Minimum input (-0.95) ; maximum input (3).
Example: If an option was bought, -0.95 means, 95% of the option value is lost (unrealized). If an option was bought, 3 means, the risk to reward is 3.
After entering all the inputs, press Ok and you should see “Calculation Complete” on the chart.
The user should not change the entry date and days to expire inputs as time passes after he entered the trade.
How to access the indicator?
Use the link below to obtain access to the indicator
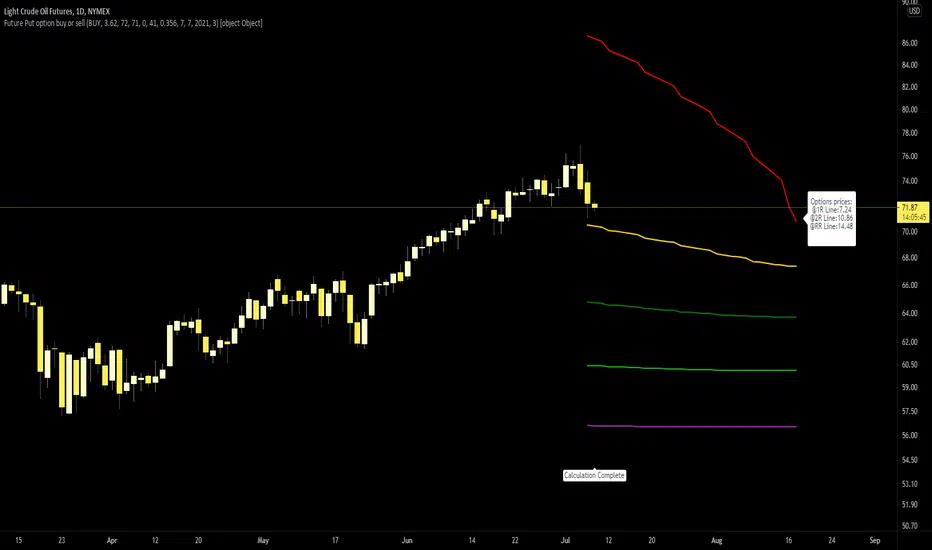
Future Call option buy or sell indicatorFuture Call option indicator developed by Chobotaru Brothers.
You need to have basic knowledge in option trading to use this indicator!
The indicator shows P&L lines of the options strategy. Use only for futures since the mathematical model of options for Future instruments is different from stocks. Plus, the days' representation in futures is also different from stocks (stocks have fewer days than futures ).
***Each strategy in options is based on different mathematical equations, use this indicator only for the strategy in the headline.***
What does the indicator do?
The indicator is based on the Black-Scholes model, which uses partial differential equations to determine the option pricing. Due to options non-linear behavior, it is hard to visualize the option price. The indicator calculates the solutions of the Black-Scholes equation and plots them on the chart so traders can view how the option pricing will behave.
How the indicator does it?
The indicator uses five values (four dominants and one less dominant) to solve the Black-Scholes equation. The values are stock price, the strike price of the option, time to expiration, risk-free interest rate, and implied volatility .
How the indicator help the users?
-View the risks and rewards so you can know the profit targets in advance which means you can compare different options in different strikes.
-View the volatility change impact so you can know the risk and the P&L changes in case of a change in the volatility over the life of the option before you enter the trade.
-View the passage of time impact so you can know where and when you could realize a profit.
-Multi-timeframes so you can stay on the same chart (Daily and below).
All these features are to help the user improve his analysis while trading options.
How to use it?
The user needs to obtain from the “option chain” the following inputs:
-Buy or sell (the strategy)
-The option price bought: at what price did you bought/sold one option.
-Instrument price when bought: the stock price when you bought/sold the option.
-Strike price: the strike price of the option.
-Interest rate: find the risk-free interest rate from the U.S. DEPARTMENT OF THE TREASURY. Example: for 2% interest rate, input: 0.02.
-Days to expire: how many days until the option expires.
-Volatility: the implied volatility of the option bought/sold. Example: for 45% implied volatility , input: 0.45.
-Day of entry: A calendar day of the month that the option bought/sold.
-Month of entry: Calendar month the option bought/sold.
-Year of entry: Calendar year the option bought/sold.
-Risk to reward: Profit/loss line defined by the user. Minimum input (-0.95) ; maximum input (3).
Example: If an option was bought, -0.95 means, 95% of the option value is lost (unrealized). If an option was bought, 3 means, the risk to reward is 3.
After entering all the inputs, press Ok and you should see “Calculation Complete” on the chart.
The user should not change the entry date and days to expire inputs as time passes after he entered the trade.
How to access the indicator?
Use the link below to obtain access to the indicator

Put ratio spread Debit indicatorPut ratio spread debit indicator developed by Chobotaru Brothers.
You need to have basic knowledge in option trading to use this indicator!
This spread is a DEBIT SPREAD.
The indicator shows P&L lines of the options strategy. Use only for stocks since the mathematical model of options for Future instruments is different from stocks. Plus, the days' representation in futures is also different from stocks (stocks have fewer days than futures ).
***Each strategy in options is based on different mathematical equations, use this indicator only for the strategy in the headline.***
What does the indicator do?
The indicator is based on the Black-Scholes model, which uses partial differential equations to determine the option pricing. Due to options non-linear behavior, it is hard to visualize the option price. The indicator calculates the solutions of the Black-Scholes equation and plots them on the chart so traders can view how the option pricing will behave.
How the indicator does it?
The indicator uses five values (four dominants and one less dominant) to solve the Black-Scholes equation. The values are stock price, the strike price of the option, time to expiration, risk-free interest rate, and implied volatility .
How the indicator help the users?
-View the risks and rewards so you can know the profit targets in advance which means you can compare different options in different strikes.
-View the volatility change impact so you can know the risk and the P&L changes in case of a change in the volatility over the life of the option before you enter the trade.
-View the passage of time impact so you can know where and when you could realize a profit.
-Multi-timeframes so you can stay on the same chart (Daily and below).
All these features are to help the user improve his analysis while trading options.
How to use it?
The user needs to obtain from the “option chain” the following inputs:
-Debit paid: The debit paid for one unit of options strategy. Minimum value: 0. 01 .
-Instrument price when entered spread: the stock price when you enter the options strategy.
-Upper strike price: the upper strike price of the options strategy.
-Lower strike price: the lower strike price of the options strategy.
- Upper Strike numbers of puts . This number has to be less than the number of puts that were sold.
- Lower Strike number of puts . This number has to be greater than the number of puts that were bought.
-Interest rate: find the risk-free interest rate from the U.S. DEPARTMENT OF THE TREASURY. Example: for 2% interest rate, input: 0.02.
-Days to expire: how many days until the option expires.
-Volatility: the implied volatility of the option bought/sold. Example: for 45% implied volatility , input: 0.45.
-Day of entry: A calendar day of the month that the option bought/sold.
-Month of entry: Calendar month the option bought/sold.
-Year of entry: Calendar year the option bought/sold.
After entering all the inputs, press Ok and you should see “Calculation Complete” on the chart.
The user should not change the entry date and days to expire inputs as time passes after he entered the trade.
How to access the indicator?
Use the link below to obtain access to the indicator
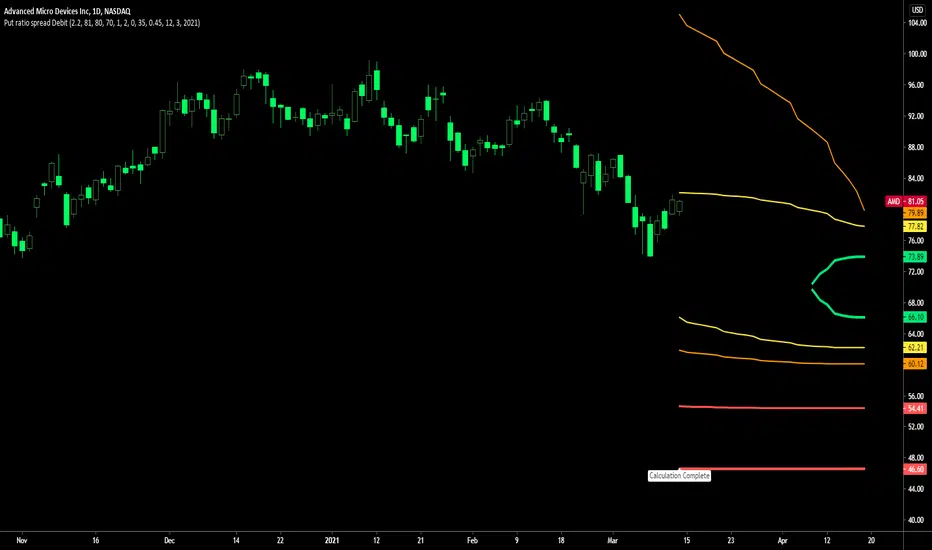
Put ratio spread Credit indicatorPut ratio spread credit indicator developed by Chobotaru Brothers.
You need to have basic knowledge in option trading to use this indicator!
This spread is a CREDIT SPREAD.
The indicator shows P&L lines of the options strategy. Use only for stocks since the mathematical model of options for Future instruments is different from stocks. Plus, the days' representation in futures is also different from stocks (stocks have fewer days than futures ).
***Each strategy in options is based on different mathematical equations, use this indicator only for the strategy in the headline.***
What does the indicator do?
The indicator is based on the Black-Scholes model, which uses partial differential equations to determine the option pricing. Due to options non-linear behavior, it is hard to visualize the option price. The indicator calculates the solutions of the Black-Scholes equation and plots them on the chart so traders can view how the option pricing will behave.
How the indicator does it?
The indicator uses five values (four dominants and one less dominant) to solve the Black-Scholes equation. The values are stock price, the strike price of the option, time to expiration, risk-free interest rate, and implied volatility .
How the indicator help the users?
-View the risks and rewards so you can know the profit targets in advance which means you can compare different options in different strikes.
-View the volatility change impact so you can know the risk and the P&L changes in case of a change in the volatility over the life of the option before you enter the trade.
-View the passage of time impact so you can know where and when you could realize a profit.
-Multi-timeframes so you can stay on the same chart (Daily and below).
All these features are to help the user improve his analysis while trading options.
How to use it?
The user needs to obtain from the “option chain” the following inputs:
-Credit received: The credit received for one unit of options strategy. Minimum value: 0. 01 .
-Instrument price when entered spread: the stock price when you enter the options strategy.
-Upper strike price: the upper strike price of the options strategy.
-Lower strike price: the lower strike price of the options strategy.
- Upper Strike numbers of puts . This number has to be less than the number of puts that were sold.
- Lower Strike number of puts . This number has to be greater than the number of puts that were bought.
-Interest rate: find the risk-free interest rate from the U.S. DEPARTMENT OF THE TREASURY. Example: for 2% interest rate, input: 0.02.
-Days to expire: how many days until the option expires.
-Volatility: the implied volatility of the option bought/sold. Example: for 45% implied volatility , input: 0.45.
-Day of entry: A calendar day of the month that the option bought/sold.
-Month of entry: Calendar month the option bought/sold.
-Year of entry: Calendar year the option bought/sold.
After entering all the inputs, press Ok and you should see “Calculation Complete” on the chart.
The user should not change the entry date and days to expire inputs as time passes after he entered the trade.
How to access the indicator?
Use the link below to obtain access to the indicator
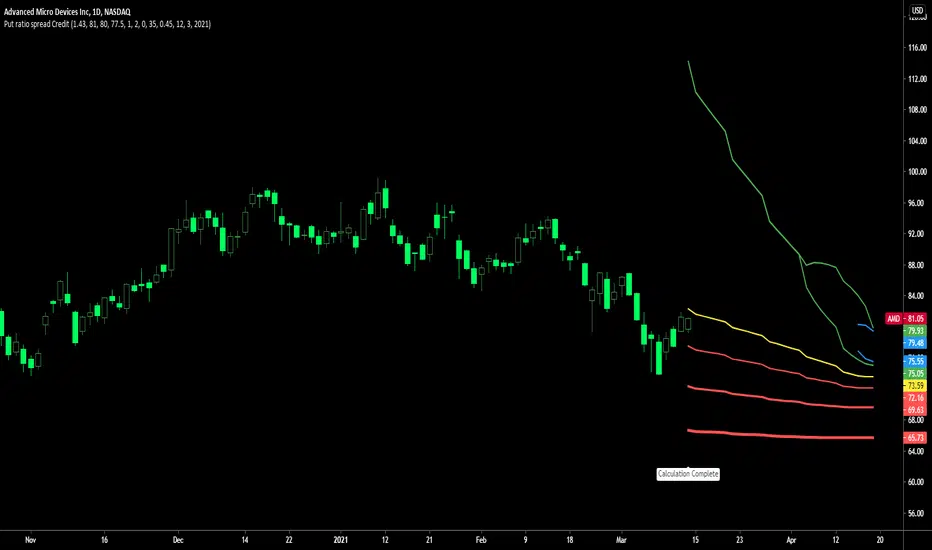
Call ratio spread debit indicatorCall ratio spread debit indicator developed by Chobotaru Brothers.
You need to have basic knowledge in option trading to use this indicator!
This spread is a DEBIT SPREAD.
The indicator shows P&L lines of the options strategy. Use only for stocks since the mathematical model of options for Future instruments is different from stocks. Plus, the days' representation in futures is also different from stocks (stocks have fewer days than futures ).
***Each strategy in options is based on different mathematical equations, use this indicator only for the strategy in the headline.***
What does the indicator do?
The indicator is based on the Black-Scholes model, which uses partial differential equations to determine the option pricing. Due to options non-linear behavior, it is hard to visualize the option price. The indicator calculates the solutions of the Black-Scholes equation and plots them on the chart so traders can view how the option pricing will behave.
How the indicator does it?
The indicator uses five values (four dominants and one less dominant) to solve the Black-Scholes equation. The values are stock price, the strike price of the option, time to expiration, risk-free interest rate, and implied volatility .
How the indicator help the users?
-View the risks and rewards so you can know the profit targets in advance which means you can compare different options in different strikes.
-View the volatility change impact so you can know the risk and the P&L changes in case of a change in the volatility over the life of the option before you enter the trade.
-View the passage of time impact so you can know where and when you could realize a profit.
-Multi-timeframes so you can stay on the same chart (Daily and below).
All these features are to help the user improve his analysis while trading options.
How to use it?
The user needs to obtain from the “option chain” the following inputs:
-Debit paid: The debit paid for one unit of options strategy. Minimum value: 0. 01 .
-Instrument price when entered spread: the stock price when you enter the options strategy.
-Upper strike price: the upper strike price of the options strategy.
-Lower strike price: the lower strike price of the options strategy.
- Upper Strike numbers of calls . This number has to be greater than the number of calls that were bought.
- Lower Strike number of calls . This number has to be less than the number of calls that were sold.
-Interest rate: find the risk-free interest rate from the U.S. DEPARTMENT OF THE TREASURY. Example: for 2% interest rate, input: 0.02.
-Days to expire: how many days until the option expires.
-Volatility: the implied volatility of the option bought/sold. Example: for 45% implied volatility , input: 0.45.
-Day of entry: A calendar day of the month that the option bought/sold.
-Month of entry: Calendar month the option bought/sold.
-Year of entry: Calendar year the option bought/sold.
After entering all the inputs, press Ok and you should see “Calculation Complete” on the chart.
The user should not change the entry date and days to expire inputs as time passes after he entered the trade.
How to access the indicator?
Use the link below to obtain access to the indicator
