ValuationtoolValuation tools, updated version for every asset (vs futures price / vs gold / vs bounds)
In den Scripts nach "GOLD" suchen

Autoback Grid Lab [trade_lexx]Autoback Grid Lab: Your personal laboratory for optimizing grid strategies.
Introduction
First of all, it is important to understand that Autoback Grid Lab is a powerful professional tool for backtesting and optimization, created specifically for traders using both grid strategies and regular take profit with stop loss.
The main purpose of this script is to save you weeks and months of manual testing and parameter selection. Instead of manually testing one combination of settings after another, Autoback Grid Lab automatically tests thousands of unique strategies on historical data, providing you with a comprehensive report on the most profitable and, more importantly, sustainable ones.
If you want to find mathematically sound, most effective settings for your grid strategy on a specific asset and timeframe, then this tool was created for you.
Key Features
My tool has functionality that transforms the process of finding the perfect strategy from a routine into an exciting exploration.
🧪 Mass testing of thousands of combinations
The script is able to systematically generate and run a huge number of unique combinations of parameters through the built-in simulator. You set the ranges, and the indicator does all the work, testing all possible options for the following grid settings:
* Number of safety orders (SO Count)
* Grid step (SO Step)
* Step Multiplier (SO Multiplier) for building nonlinear grids
* Martingale for controlling the volume of subsequent orders
* Take Profit (%)
* Stop Loss (%), with the possibility of calculating both from the entry point and from the dynamic breakeven line
* The volume of the base order (Volume BO) as a percentage of the deposit
🏆 Unique `FinalScore` rating system
Sorting strategies by net profit alone is a direct path to self—deception and choosing strategies that are "tailored" to history and will inevitably fail in real trading. To solve this problem, we have developed FinalScore, a comprehensive assessment of the sustainability and quality of the strategy.
How does it work?
FinalScore analyzes each combination not one by one, but by nine key performance metrics at once, including Net Profit, Drawdown, Profit Factor, WinRate, Sharpe coefficients, Sortino, Squid and Omega. Each of these indicators is normalized, that is, reduced to a single scale. Then, to test the strategy for strength, the system performs 30 iterations, each time assigning random weights to these 9 metrics. A strategy gets a high FinalScore only if it shows consistently high results under different evaluation criteria. This proves her reliability and reduces the likelihood that her success was an accident.
📈 Realistic backtesting engine
The test results are meaningless if they do not take into account the actual trading conditions. Our simulator simulates real trading as accurately as possible, taking into account:
* Leverage: Calculation of the required margin to open and hold positions.
* Commission: A percentage commission is charged each time an order is opened and closed.
* Slippage: The order execution price is adjusted by a set percentage to simulate real market conditions.
* Liquidation model: This is one of the most important functions. The script continuously monitors the equity of the account (capital + unrealized P&L). If equity falls below the level of the supporting margin (calculated from the current value of the position), the simulator forcibly closes the position, as it would happen on a real exchange. This eliminates unrealistic scenarios where the strategy survives after a huge drawdown.
🔌 Integration with external signals
The indicator operates in two modes:
1. `No Signal': Standard mode. The trading cycle starts immediately as soon as the previous one has been closed. Ideal for testing the "pure" mechanics of the grid.
2. `External Signal`: In this mode, a new trading cycle will start only when a signal is received from an external source. You can connect any other indicator (such as the RSI, MACD, or your own strategy) to the script and use it as a trigger to log in. This allows you to combine the power of a grid strategy with your own entry points.
📊 Interactive and informative results panel
Upon completion of the calculations, a detailed table with the TOP N best strategies appears on the screen, sorted according to your chosen criterion. For each strategy in the rating, you will see not only the key metrics (Profit, Drawdown, duration of transactions), but also all the parameters that led to this result. You can immediately take these settings and apply them in your trading.
Application Options: How To Solve Your Problems
Autoback Grid Lab is a flexible tool that can be adapted to solve various tasks, from complete grid optimization to fine—tuning existing strategies. Here are some key scenarios for its use:
1. Complete Optimization Of The Grid Strategy
This is the basic and most powerful mode of use. You can find the most efficient grid configuration for any asset from scratch.
* How to use: Set wide ranges for all key grid parameters ('SO Count`, SO Step, SO Multiplier, Martingale, TP, etc.).
* In the `No Signal` mode: You will find the most stable grid configuration that works as an independent, constantly active strategy, regardless of which-or entrance indicators.
* In the `External Signal` mode: You can connect your favorite indicator for input (for example, RSI, MACD or a complex author's script) and find the optimal grid parameters that best complement your input signals. This allows you to turn a simple signaling strategy into a full-fledged grid system.
2. Selecting the Optimal Take Profit and Stop Loss for Your Strategy
Do you already have an entry strategy, but you are not sure where it is best to put Take Profit and Stop Loss? Autoback Grid Lab can solve this problem as well.
* How to use:
1. Disable optimization of all grid parameters (uncheck SO Count, SO Step, Martingale, etc.). Set the Min value for SO Count to 0.
2. Set the ranges for iteration only for 'Take Profit` and `Stop Loss'.
3. Turn on the External Signal mode and connect your indicator with input signals.
* Result: The script will run your historical entry signals with hundreds of different TP and SL combinations and show you which stop order levels bring maximum profit with minimal risk specifically for your entry points.
3. Building a Secure Network with Risk Management
Many traders are afraid of grid strategies because of the risk of large drawdowns. With the help of the optimizer, you can purposefully find the parameters for such a grid, which includes mandatory risk management through Stop Loss.
* How to use: Enable and set the range for Stop Loss, along with other grid parameters. Don't forget to test both types of SL calculations (`From entry point` and `From breakeven line`) to determine which one works more efficiently.
* Result: You will find balanced strategies in which the grid parameters (number of orders, martingale) and the Stop Loss level are selected in such a way as to maximize profits without going beyond the acceptable risk level for you.
How To Use The Indicator (Step-By-Step Guide)
Working with the Autoback Grid Lab is a sequential process consisting of four main steps: from initial setup to analysis of the finished results. Follow this guide to get the most out of the tool.
Step 1: Initial Setup
1. Add the indicator to the chart of your chosen asset and timeframe.
2. Open the script settings. The first thing you should pay attention to is the ⚙️ Optimization Settings ⚙️ group.
3. Set the `Bars Count'. This parameter determines how much historical data will be used for testing.
* Important: The more bars you specify, the more statistically reliable the backtest results will be. We recommend using the maximum available value (25,000) to test strategies at different market phases.
* Consider: The indicator performs all calculations on the last historical bar. After applying the TradingView settings, it will take some time to load all the specified bars. The results table will appear only after the data is fully loaded. Don't worry if it doesn't appear instantly. And if an error occurs, simply switch the number of combinations to 990 and back to 1000 until the table appears.
Step 2: Optimization Configuration
At this stage, you define the "universe" of parameters that our algorithm will explore.
1. Set the search ranges (🛠 Optimization Parameters 🛠 group).
For each grid parameter that you want to optimize (for example, SO Count or `Take Profit'), you must specify three values:
* Min: The minimum value of the range.
* Max: The maximum value of the range.
* Step: The step with which the values from Min to Max will be traversed.
*Example:* If you set Min=5, Max=10, and Step=1 for SO Count, the script will test strategies with 5, 6, 7, 8, 9, and 10 safety orders.
* Tip for users: To get the first results quickly, start with a larger step (for example, TP from 0.5% to 2.5% in 0.5 increments instead of 0.1). After you identify the most promising areas, you can perform a deeper analysis by expanding the ranges around these values.
2. Set Up Money Management (Group `💰 Money Management Settings 💰`).
Fill in these fields with the values that best match your actual trading conditions. This is critically important for obtaining reliable results.
* Capital: Your initial deposit.
* Leverage: Leverage.
* Commission (%): Your trading commission as a percentage.
* Slippage (%): Expected slippage.
* Liquidation Level (%): The level of the supporting margin (MMR in %). For example, for Binance Futures, this value is usually between 0.4% and 2.5%, depending on the asset and position size. Specify this value for your exchange.
3. Select the Sorting Criterion and the Direction (Group `⚙️ Optimization Settings ⚙️').
* `Sort by': Specify the main criteria by which the best strategies will be selected and sorted. I strongly recommend using finalScore to find the most balanced and sustainable strategies.
* `Direction': Choose which trades to test: Long, Short or Both.
Step 3: Start Testing and Work with "Parts"
The total number of unique combinations generated based on your ranges can reach tens of millions. TradingView has technical limitations on the number of calculations that the script can perform at a time. To get around this, I implemented a "Parts" system.
1. What are `Part` and `Combinations in Part'?
* `Combinations in Part': This is the number of backtests that the script performs in one run (1000 by default).
* `Part`: This is the number of the "portion" of combinations that you want to test.
2. How does it work in practice?
* After you have everything set up, leave Part:1 and wait for the results table to appear. You will see the TOP N best strategies from the first thousand tested.
* Analyze them. Then, to check the next thousand combinations, just change the Part to 2 in the settings and click OK. The script will run a test for the next batch.
* Repeat this process by increasing the Part number (`3`, 4, 5...), until you reach the last available part.
* Where can I see the total number of parts? In the information row below the results table, you will find Total parts. This will help you figure out how many more tests are left to run.
Step 4: Analyze the Results in the Table
The results table is your main decision—making tool. It displays the best strategies found, sorted by the criteria you have chosen.
1. Study the performance metrics:
* Rating: Position in the rating.
* Profit %: Net profit as a percentage of the initial capital.
* Drawdown%: The maximum drawdown of the deposit for the entire test period.
* Max Length: The maximum duration of one transaction in days, hours and minutes.
* Trades: The total number of completed trades.
2. Examine the winning parameters:
* To the right of the performance metrics are columns showing the exact settings that led to this result ('SO Count`, SO Step, TP (%), etc.).
3. How to choose the best strategy?
* Don't chase after the maximum profit! The strategy with the highest profit often has the highest drawdown, which makes it extremely risky.
* Seek a balance. The ideal strategy is a compromise between high profitability, low drawdown (Drawdown) and the maximum length of trades acceptable to you (Max Length).
* finalScore was created to find this balance. Trust him — he often highlights not the most profitable, but the most stable and reliable options.
Detailed Description Of The Settings
This section serves as a complete reference for each parameter available in the script settings. The parameters are grouped in the same way as in the indicator interface for your convenience.
Group: ⚙️ Optimization Settings ⚙️
The main parameters governing the testing process are collected here.
* `Enable Optimizer': The main switch. Activates or deactivates all backtesting functionality.
* `Direction': Determines which way trades will be opened during the simulation.
* Long: Shopping only.
* Short: Sales only.
* Both: Testing in both directions. Important: This mode only works in conjunction with an External Signal, as the script needs an external signal to determine the direction for each specific transaction.
* `Signal Mode`: Controls the conditions for starting a new trading cycle (opening a base order).
* No Signal: A new cycle starts immediately after the previous one is completed. This mode is used to test "pure" grid mechanics without reference to market conditions.
* External Signal: A new cycle begins only when a signal is received from an external indicator connected via the Signal field.
* `Signal': A field for connecting an external signal source (works only in the `External Signal` mode). You can select any other indicator on the chart.
* For Long** trades, the signal is considered received if the value of the external indicator ** is greater than 0.
* For Short** trades, the signal is considered received if the value of the external indicator ** is less than 0.
* `Bars Count': Sets the depth of the history in the bars for the backtest. The maximum value (25000) provides the most reliable results.
* `Sort by`: A key criterion for selecting and ranking the best strategies in the final table.
* FinalScore: Recommended mode. A comprehensive assessment that takes into account 9 metrics to find the most balanced and sustainable strategies.
* Profit: Sort by net profit.
* Drawdown: Sort by minimum drawdown.
* Max Length: Sort by the minimum length of the longest transaction.
* `Combinations Count': Indicates how many of the best strategies (from 1 to 50) will be displayed in the results table.
* `Close last trade`: If this option is enabled, any active trade will be forcibly closed at the closing price of the last historical bar. For grid strategies, it is recommended to always enable this option in order to get the correct calculation of the final profit and eliminate grid strategies that have been stuck for a long time.
Group: 💰 Money Management Settings 💰
The parameters in this group determine the financial conditions of the simulation. Specify values that are as close as possible to your actual values in order to get reliable results.
* `Capital': The initial deposit amount for the simulation.
* `Leverage`: The leverage used to calculate the margin.
* `Slippage` (%): Simulates the difference between the expected and actual order execution price. The specified percentage will be applied to each transaction.
* `Commission` (%): The trading commission of your exchange as a percentage. It is charged at the execution of each order (both at opening and closing).
* `Liquidation Level' (%): Maintenance Margin Ratio. This is a critical parameter for a realistic test. Liquidation in the simulator occurs if the Equity of the account (Capital + Unrealized P&L) falls below the level of the supporting margin.
Group: 🛠 Optimization Parameters 🛠
This is the "heart" of the optimizer, where you set ranges for iterating through the grid parameters.
* `Part`: The portion number of the combinations to be tested. Start with 1, and then increment (`2`, 3, ...) sequentially to check all generated strategies.
* `Combinations in Part': The number of backtests performed at a time (in one "Part"). Increasing the value may speed up the process, but it may cause the script to error due to platform limitations. If an error occurs, it is recommended to switch to the step below and back.
Three fields are available for each of the following parameters (`SO Count`, SO Step, SO Multiplier, etc.):
* `Min`: Minimum value for testing.
* `Max': The maximum value for testing.
* `Step`: The step with which the values in the range from Min to Max will be iterated over.
There is also a checkbox for each parameter. If it is enabled, the parameter will be optimized in the specified range. If disabled, only one value specified in the Min field will be used for all tests.
* 'Stop Loss': In addition to the standard settings Min, Max, Step, it has an additional parameter:
* `Type`: Defines how the stop loss price is calculated.
* From entry point: The SL level is calculated once from the entry price (base order price).
* From breakeven line: The SL level is dynamically recalculated from the average position price after each new safety order is executed.
Group: ⚡️Filters⚡️
Filters allow you to filter out those results from the final table that do not meet your minimum requirements.
For each filter (`Max Profit`, Min Drawdown, `Min Trade Length`), you can:
1. Turn it on or off using the checkbox.
2. Select the comparison condition: Greater (More) or Less (Less).
3. Set a threshold value.
*Example:* If you set Less and 20 for the Min Drawdown filter, only those strategies with a maximum drawdown of less than 20% will be included in the final table.
Group: 🎨 Visual Settings 🎨
Here you can customize the appearance of the results table.
* `Position': Selects the position of the table on the screen (for example, Bottom Left — bottom left).
* `Font Size': The size of the text in the table.
* `Header Background / Data Background`: Background colors for the header and data cells.
* `Header Font Color / Data Font Color`: Text colors for the header and data cells.
Important Notes and Limitations
So that you can use the Autoback Grid Lab as efficiently and consciously as possible, please familiarize yourself with the following key features of its work.
1. It is a Tool for Analysis, not for Signals
It is extremely important to understand that this script does not generate trading signals in real time. Its sole purpose is to conduct in—depth research (**backtesting**) on historical data.
* The results you see in the table are a report on how a particular strategy would have worked in the past.
* The script does not provide alerts and does not draw entry/exit points on the chart for the current market situation.
* Your task is to take the best sets of parameters found during optimization and use them in your real trading, for example, when setting up a trading bot or in a manual trading system.
2. Features Of Calculations (This is not a "Repainting")
You will notice that the results table appears and is updated only once — when all historical bars on the chart are loaded. It does not change in real time with each tick of the price.
This is correct and intentional behavior.:
* To test thousands, and sometimes millions of combinations, the script needs to perform a huge amount of calculations. In the Pine Script™ environment, it is technically possible to do this only once, at the very last bar in history.
* The script does not show false historical signals, which then disappear or change. It provides a static report on the results of the simulation, which remains unchanged for a specific historical period.
3. Past Results do not Guarantee Future Results.
This is the golden rule of trading, and it fully applies to the results of backtesting. Successful strategy performance in the past is not a guarantee that it will be as profitable in the future. Market conditions, volatility and trends are constantly changing.
My tool, especially when sorting by finalScore, is aimed at finding statistically stable and reliable strategies to increase the likelihood of their success in the future. However, it is a tool for managing probabilities, not a crystal ball for predicting the future. Always use proper risk management.
4. Dependence on the Quality and Depth of the Story
The reliability of the results directly depends on the quantity and quality of the historical data on which the test was conducted.
* Always strive to use the maximum number of bars available (`Bars Count: 25,000`) so that your strategy is tested on different market cycles (rise, fall, flat).
* The results obtained on data for one month may differ dramatically from the results obtained on data for two years. The longer the testing period, the higher the confidence in the parameters found.
Conclusion
The Autoback Grid Lab is your personal research laboratory, designed to replace intuitive guesses and endless manual selection of settings with a systematic, data—driven approach. Experiment with different assets, timeframes, and settings ranges to find the unique combinations that best suit your trading style.

Lot Size & Risk Calculator [FunkyMax]🔹 Overview
This script is a lot size and risk management calculator directly integrated into your chart.
It automatically determines the optimal position size based on your account balance, chosen risk percentage, and stop-loss distance.
In addition to risk calculation, the script also displays Entry, Stop-Loss, and Take-Profit levels on the chart, along with a dashboard panel summarizing all key trading information:
Account balance
Selected risk %
Amount at risk
Optimal lot size
Stop & TP distances in pips
Risk/Reward ratios (R:R)
Potential profit for each TP
Contract size & pip size
🔹 Key Features
✅ Automatic lot size calculation based on:
Account balance
Risk %
Stop-Loss distance
✅ Clear visual display:
Dynamic labels for Entry, Stop, and TP (supports 1 or 2 TPs)
Colored lines (green for TP, red for SL, blue for Entry)
Profit/Loss zones filled on the chart
✅ Dashboard panel:
Compact summary displayed on-screen (position customizable)
Real-time automatic updates
✅ Automatic asset detection:
Forex: contract size = 100,000 (pip = 0.0001 or 0.01 for JPY pairs)
Gold (XAUUSD): contract size = 100 (pip = 0.1)
Indices & crypto: contract size = 1 (pip = 1.0)
Manual override available (custom contract & pip size)
✅ Multi-currency support:
Display in USD or EUR
🔹 How to Use
Add the indicator to your chart then define entry price, stop-loss, Take-Profit targets (TP1 & TP2) by clicking directly on chart. Then, configure settings of the indicator as needed :
1. Basic settings (Money Management tab):
Enter your account balance (e.g., $1000).
Select your risk percentage (e.g., 1%, 2%, 3%).
Choose your deposit currency (USD or EUR).
2. Trading levels (Levels tab):
Set your Entry price.
Define your Stop-Loss (SL).
Add up to two Take-Profit targets (TP1 / TP2).
3. Chart display:
Toggle levels on/off with Display TP & SL on chart.
Levels appear automatically with lot size and R:R ratio.
4. Dashboard (Dashboard tab):
Choose text size (Normal / Small).
Position the info panel anywhere (top/bottom/left/right).
🔹 Benefits
Time-saving: no more manual lot size calculations
Risk control: enforces consistent money management
Versatility: works across Forex, Gold, Indices, Crypto
Clarity: instant visualization of risk and potential reward
🔹 Limitations
Pip value may vary depending on your broker (CFDs, Futures, etc.). Double-check with your platform.
Educational purpose only: this script is not financial advice.
🔹 Author
Script developed and optimized by FunkyMax.

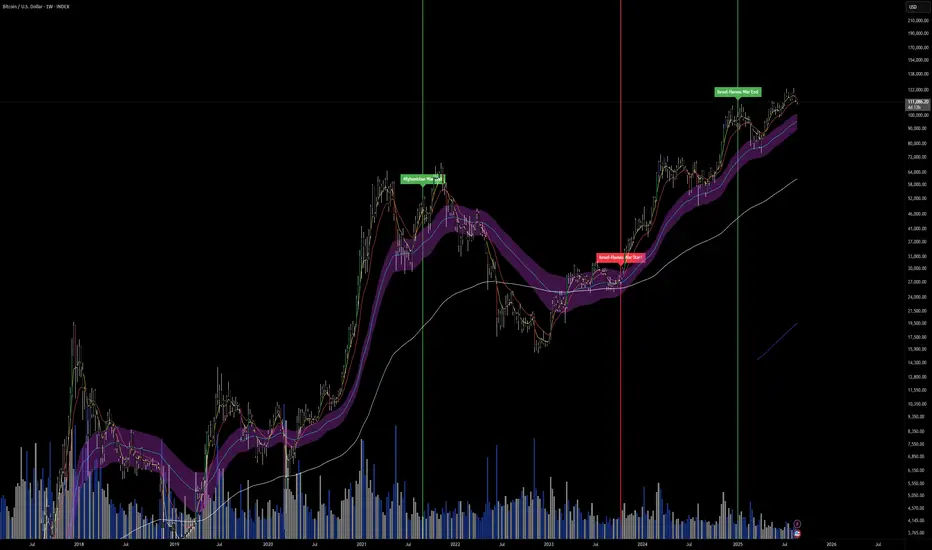
Major & Modern Wars TimelineDescription:
This indicator overlays vertical lines and labels on your chart to mark the start and end dates of major global wars and modern conflicts.
Features:
Displays start (red line + label) and end (green line + label) for each war.
Covers 20th century wars (World War I, World War II, Korean War, Vietnam War, Gulf War, Afghanistan, Iraq).
Includes modern conflicts: Syrian Civil War, Ukraine War, and Israel–Hamas War.
For ongoing conflicts, the end date is set to 2025 for timeline visualization.
Customizable: label position (above/below bar), line width.
Works on any chart timeframe, overlaying events on financial data.
Use case:
Useful for historical market analysis (e.g., gold, oil, S&P 500), helping traders and researchers see how wars and conflicts align with market movements.
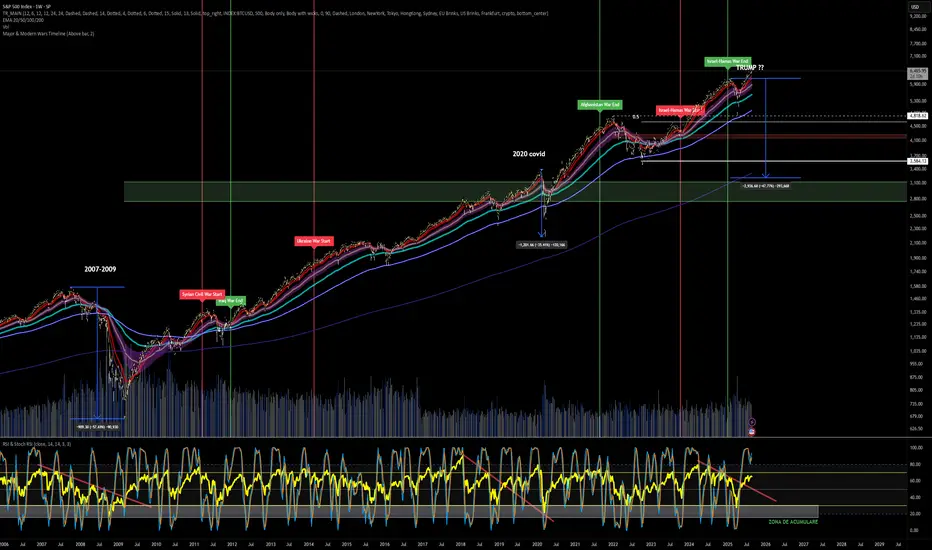
Macro Pulse Dashboard [SwissAlgo]Macro Pulse Dashboard
What is it?
The Macro Pulse Dashboard is a multi-asset performance dashboard designed to give traders and investors a quick snapshot of global market conditions. The indicator tracks price and momentum across crypto, equities, sectors, commodities, bonds, and macro indicators—considering multiple timeframes—in one color-coded table with a trend indication for each asset.
Purpose
Give you a fast, single-glance read of global markets so you can gauge whether conditions are broadly risk-on or risk-off and where strength/weakness clusters across markets.
Who it’s for
Traders and investors who want a clear, beginner-friendly macro overview to frame ideas and risk, without digging through multiple charts.
Why this may help you
Gives context fast : before focusing on one chart, you see the broader environment. This can help avoid trades that fight the macro tide.
Reduces noise : instead of jumping between watchlists and windows, you get a single, consistent view each day.
Improves decision quality : aligning ideas with the table’s short-term and medium-term bias can assist with timing and position sizing.
Builds routine : spend 30 seconds at the open scanning for agreement or conflict across crypto, equities, sectors, commodities, bonds, and macro gauges. If signals are mixed, consider waiting or sizing down; if they align, proceed with your plan.
Beginner-friendly : clear green/red percentages and a simple Trend icon make it easy to interpret without advanced indicators. The trend is determined using a simplified rule in this version.
What’s included
Crypto (BTC/ETH, dominance, total/alt caps), equity indices (US futures, Europe 50, FTSE, HSI, Nikkei, Nifty), US sectors (XLK, SOXX, ARKK, XLY, XLV), commodities (Gold, Silver, WTI, Nat Gas), bonds/credit ETFs (SHY, IEF, TLT, LQD, HYG, AGG, EMB), and macro gauges (US10Y, DXY, EURUSD, VIX).
Columns
Price/Value, % change over 1D, 1W, 2W, 1M, YTD, plus a simple trend glyph (▲ up, ▼ down, ◆ mixed).
Trend logic
The Trend icon is a simple overview (not a signal): ▲ if both short-term (1W) and 1M changes are positive, ▼ if both are negative, ◆ otherwise.
How numbers are computed
All changes use the last completed daily close.
1D = change since the prior daily close.
1W/2W/1M: crypto uses 7/14/30 calendar days; other assets use 5/10/21 trading sessions.
YTD compares to the first daily close of the year.
Prices show a $ prefix where applicable and are compacted (M/B/T).
Repainting
The table uses daily data with lookahead_off and updates only after the daily bar completes. It does not repaint intrabar.
Settings
Anchor (top-left) and Table Size (Small/Normal/Large).
Notes
Informational/educational tool only. Not trading advice. No buy/sell signals or alerts are generated.
Symbols depend on TradingView data availability; if a symbol isn’t accessible on your plan, that row will show “—”.

Canyons Trend Ride SignalTrend alignment signals using 3 EMA's. pre-code written parameters must all be met to throw a signal out. Works best with Heiken ashi candles. Works on Gold, Nas100, S&P 500 and US30


India Nifty Index Performances DashboardSelf explanatory tabular view of Nifty sector performance ranked top & bottom across calendar year vs. financial year — a clear view of market leaders and laggards.
Options available: Day, Week, Month, Quarter, Calendar Year, (India) Financial Year p
performances. Included Gold (from Mcx), Sme (from Bse), 10Y Gsec for comparison.

SMA200 - 400 Cross AlertYou can set the alarm by clicking the three dots on the top left of the main chart.
Alarms for Golden Cross and Dead Cross are available.

VPOC Harmonics - Liquidity-Weighted Price / Time RatiosVPOC Harmonics - Liquidity-Weighted Price / Time Ratios
Summary
This indicator transforms a swing’s price range, duration, and liquidity profile into a structured set of price-per-bar ratios. By anchoring two points and manually entering the swing’s VPOC (highest-volume price), it generates candidate compression values that unify price, time, and liquidity structure. These values can be applied to chart scaling, harmonic testing, and liquidity-aware market geometry.
________________________________________
Overview
Most swing analysis tools only consider price (ΔP) and time (N bars). This script goes further by incorporating the VPOC (Point of Control) — the price with the highest traded volume — directly into swing geometry.
• Anchors define the swing’s Low (L), High (H), and bar count (N).
• The user manually enters the VPOC (highest-volume price).
• The indicator then computes a suite of ratios that integrate range, duration, and liquidity placement.
The output is a table of liquidity-weighted price-per-bar candidates, designed for compression testing and harmonic analysis across swings and instruments.
________________________________________
How to Use
1. Select a Swing
- Place Anchor A and Anchor B to define the swing’s Low, High, and bar count.
2. Find the VPOC
- Apply TradingView’s Fixed Range Volume Profile tool over the same swing.
- Identify the Point of Control (POC) — the price level with the highest traded volume.
3. Enter the VPOC
- Manually input the POC into the indicator settings.
4. Review Outputs
- The table will display candidate ratios expressed mainly as price-per-bar values.
5. Apply in Practice
- Use the ratios as chart compression inputs or as benchmarks for testing harmonic alignments across swings.
________________________________________
Outputs
Swing & Inputs
• Bars (N): total bar count of the swing.
• Low (L): swing low price.
• High (H): swing high price.
• ΔP = H − L: price range.
• Mid = (L + H) ÷ 2: midpoint price.
• VPOC (V): user-entered highest-volume price.
• Base slope s0 = ΔP ÷ N: average change per bar.
• π-adjusted slope sπ = (π × ΔP) ÷ (2 × N): slope adjusted for half-cycle arc geometry.
________________________________________
VPOC Harmony Ratios (L, H, V, N)
• λ = (V − L) ÷ ΔP: normalized VPOC position within the range.
• R = (V − L) ÷ (H − V): symmetry ratio comparing lower vs. upper segment.
• s1 = (V − L) ÷ N: slope from Low → VPOC.
• s2 = (H − V) ÷ N: slope from VPOC → High.
________________________________________
Blended Means (s1, s2)
These combine the two segment slopes in different ways:
• HM(s1,s2) = 2 ÷ (1/s1 + 1/s2): Harmonic mean, emphasizes the smaller slope.
• GM(s1,s2) = sqrt(s1 × s2): Geometric mean, balances both slopes proportionally.
• RMS(s1,s2) = sqrt((s1² + s2²) ÷ 2): Root-mean-square, emphasizes the larger slope.
• L2 = sqrt(s1² + s2²): Euclidean norm, the vector length of both slopes combined.
________________________________________
Slope Blends
• Quadratic weighting: s_quad = s0 × ((V−L)² + (H−V)²) ÷ (ΔP²)
• Tilted slope: s_tilt = s0 × (0.5 + λ)
• Entropy-scaled slope: s_ent = s0 × H2(λ), with H2(λ) = −
________________________________________
Curvature & Liquidity Extensions
• π-arc × λ: s_arc = sπ × λ
• Liquidity-π: s_piV = sπ × (V ÷ Mid)
________________________________________
Scale-Normalized Families
With k = sqrt(H ÷ L):
• k (scale factor) = sqrt(H ÷ L)
• s_comp = s0 ÷ k: compressed slope candidate
• s_exp = s0 × k: expanded slope candidate
• Exponentiated blends:
- s_kλ = s0 × k^(2λ−1)
- s_φλ = s0 × φ^(2λ−1), with φ = golden ratio ≈ 1.618
- s_√2λ = s0 × (√2)^(2λ−1)
________________________________________
Practical Application
All formulas generate liquidity-weighted price-per-bar ratios that integrate range, time, and VPOC placement.
These values are designed for:
• Chart compression settings
• Testing harmonic alignments across swings
• Liquidity-aware scaling experiments
________________________________________

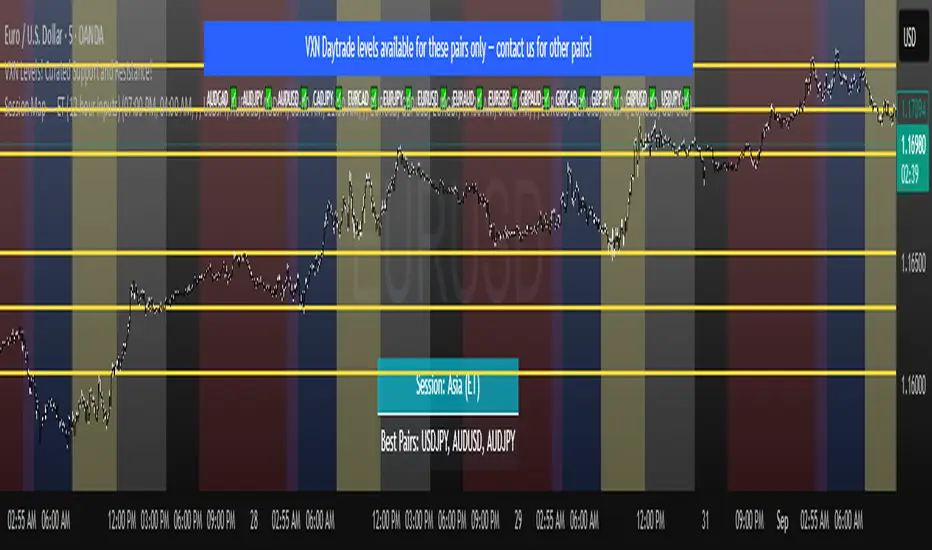
Session Map! This indicator visually highlights the three main Forex trading sessions — Asia, London, and New York — as well as the Power Zone when London and New York overlap.
It also includes a bottom-center dashboard showing the current active session and the best Forex pairs to trade during that session.
Key Features 🚀
Session Background Shading
Asia Session → Aqua
London Session → Teal
New York Session → Blue
Power Zone (London + NY overlap) → Gold ⚡
Dynamic Dashboard (bottom-center)
Displays current active session
Shows best pairs to trade based on session liquidity
Optimized for Forex Trading
Know instantly when to trade and what to trade
Uses session-specific recommendations based on volatility windows
Why This Indicator is Useful
This isn’t just a session visualizer — it’s a trading assistant:
Helps you identify high-liquidity trading windows
Shows you which pairs are most active per session
Highlights the Power Zone ⚡ where volatility peaks
Hassi XAUUSD 15TF BUY/SELL (Anchored, Non-Repainting)What this does
Hassi XAUUSD 15TF BUY/SELL is a non-repainting signal indicator designed for XAUUSD (Gold) on the 15-minute timeframe (also works on BTCUSD). It blends EMA crossover + RSI + MACD with optional volume & volatility filters, and prints anchored BUY/SELL arrows that stay glued to their candle (no visual drifting on zoom/scale/replay). Optional confidence% labels help you judge signal quality at a glance.
Why it’s stable (no repaint)
Signals confirm only on bar close (barstate.isconfirmed).
Arrows/X marks are placed with label.new(x=bar_index, y=high/low, xloc.bar_index, yloc.abovebar/belowbar) so they remain exactly above/below the triggering candle.
No request.security for higher-TF lookaheads; no negative offsets.
How signals are generated
Core trigger: EMA(9) crosses EMA(21)
RSI filter (opt): RSI ≥ RSI Buy Min (default 50) for buys; ≤ RSI Sell Max (default 50) for sells
MACD filter (opt): MACD line crosses its signal or histogram sign matches direction
Volume/ATR filters (opt): require a basic volume spike and above-average ATR volatility (toggleable)
Divergence (opt): lightweight RSI divergence hints (diamond marks)
Anchored markers
BUY: triangle below the signal candle
SELL: triangle above the signal candle
EXIT (❌): small x above (long exit) / below (short exit) when the opposite signal confirms
Nudges: fine-tune vertical placement with tick offsets (inputs) without breaking anchoring
Inputs (defaults)
Fast EMA: 9
Slow EMA: 21
RSI Length: 14
MACD Fast/Slow/Signal: 12 / 26 / 9
Require RSI filter (50 line): ✅
Require MACD cross filter: ✅
RSI Buy Min / RSI Sell Max: 50 / 50
Buy/Sell/Exit Offset (ticks): 0 / 0 / 0
Advanced toggles: Trend Strength ✅, Dynamic Sizing (visual) ✅, Volume Filter ⛔, Volatility Filter ⛔, RSI Divergence ⛔, Show Confidence ✅
Status line/table: ✅
Alerts
Add any of these in Add Alert → Condition: this indicator
Buy Signal → {{ticker}} BUY @ {{close}} - ANCHORED SIGNAL
Sell Signal → {{ticker}} SELL @ {{close}} - ANCHORED SIGNAL
Exit Mark → {{ticker}} EXIT @ {{close}} - ANCHORED EXIT
Recommended use (15-minute XAUUSD)
Use during active sessions (London/NY overlaps).
Keep defaults; enable Volume & Volatility filters in high-noise conditions.
Add confluence (S/R, structure/BOS, session highs/lows, FVG or HTF bias).
Manage risk with structure-based SL or ATR x 1.0–1.5, and partial TP at 1:1–1.5R.
Note: You mentioned it has ~80% win rate on 15TF in your testing. Performance varies by broker feed, session, spread, and risk management. Treat results as educational, not a guarantee.
Non-repainting notes
Signals lock on close; historical arrows are final.
Labels are bar/price anchored (no drift when you zoom or change scale).
Arrays trim old labels automatically to avoid drawing limits.
FAQ
Q: Why don’t past arrows move when I resize the chart?
A: They’re label.new() anchored to bar_index and bar high/low with xloc/yloc, so they stay with the candle.
Q: Can I turn it into a strategy/backtest?
A: Yes—wrap the same signals into strategy.entry/exit, but this release is an indicator by design.
Q: Will it work on BTC or other pairs/timeframes?
A: Yes, but it’s tuned for XAUUSD M15. Adapt filters for other markets.
Changelog
v1.0 — Initial public release: anchored non-repainting arrows, optional RSI/MACD filters, volume/ATR filter, divergence hints, confidence labels, status panel, alerts.
Disclaimer
This tool is for education and analysis only. It is not financial advice. Trading involves risk; do your own research and manage risk responsibly.
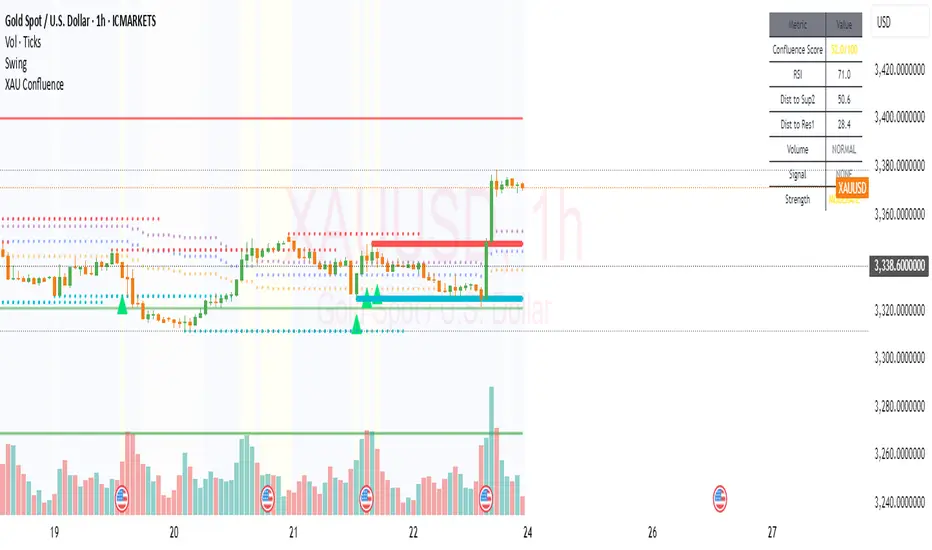
XAUUSD Confluence Analyzer# TradingView Setup Guide - XAUUSD Confluence Indicator
Configuring the Indicator Settings
Once added to your chart, click the **gear icon** next to the indicator name to access settings:
### RSI Settings:
- **RSI Length**: 14 (default)
- **RSI Overbought**: 70
- **RSI Oversold**: 30
### Volume Settings:
- **Volume Multiplier**: 1.5 (signals high volume when 1.5x average)
### Support/Resistance Settings:
- **Lookback Period**: 20
- **S/R Touch Strength**: 3
### Key Levels (Update these based on current market):
- **Key Support 1**: 3269.0
- **Key Support 2**: 3321.0
- **Key Resistance 1**: 3400.0
- **Key Resistance 2**: 3450.0
### Fibonacci Settings:
- **Fibonacci Lookback**: 100 periods
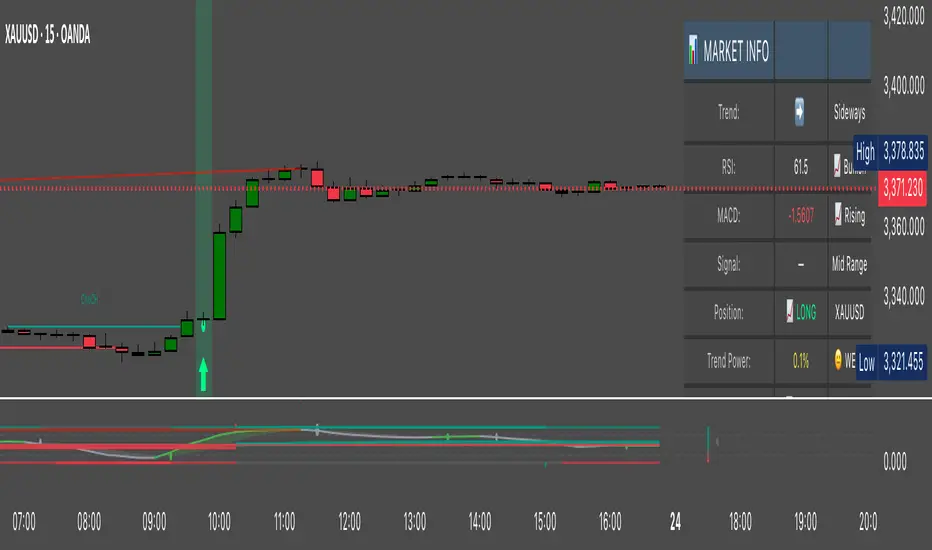
Understanding the Visual Elements
### Lines and Levels:
- **Green Lines**: Support levels (Key Support 1 & 2)
- **Red Lines**: Resistance levels (Key Resistance 1 & 2)
- **Purple/Blue/Orange Dots**: Fibonacci retracement levels (61.8%, 50%, 38.2%)
### Background Colors:
- **Yellow Background**: High confluence (70+ score) - Strong signal
- **Blue Background**: Moderate confluence (40-69 score)
- **Gray Background**: Low confluence (<40 score)
### Signal Arrows:
- **Green Triangle Up**: Buy signal (confluence score 70+ at support)
- **Red Triangle Down**: Sell signal (confluence score 70+ at resistance)
### Information Table (Top Right):
- **Confluence Score**: Current confluence strength (0-100)
- **RSI**: Current RSI value
- **Distance to Levels**: How close price is to key levels
- **Volume**: Current volume status (HIGH/NORMAL)
- **Signal**: Current signal (BUY/SELL/NONE)
- **Strength**: Overall signal strength (STRONG/MODERATE/WEAK)
Setting Up Alerts
1. **Right-click on the chart** and select "Add Alert"
2. **Choose your indicator** from the dropdown
3. **Select alert type**:
- "Confluence Buy Signal" - Alerts when buy conditions met
- "Confluence Sell Signal" - Alerts when sell conditions met
- "High Confluence Alert" - Alerts when score reaches 70+
4. **Configure notification method** (email, SMS, app notification)
5. **Click "Create"**
## Step 5: Additional Setup Recommendations
### Complementary Indicators to Add:
1. **Volume Profile** - Shows volume at price levels
2. **MACD** - Momentum confirmation
3. **Bollinger Bands** - Volatility and mean reversion
4. **200 EMA** - Long-term trend direction
### Chart Setup:
- **Timeframe**: Daily for main signals, 4H for entries/exits
- **Chart Type**: Candlesticks
- **Extended Hours**: Enable for complete price action
### Watchlist Setup:
Create a watchlist with:
- XAUUSD (main)
- DXY (Dollar Index - inverse correlation)
- US10Y (Bond yields - affects gold)
- SPX (Risk sentiment)
Trading Rules Based on Confluence Score
### High Confluence (70+ Score):
- **Entry**: Wait for score 70+ at key levels
- **Stop Loss**: Below nearest support (buy) / Above nearest resistance (sell)
- **Take Profit**: Next resistance level (buy) / Next support level (sell)
- **Position Size**: Full position size
### Moderate Confluence (40-69 Score):
- **Entry**: Wait for additional confirmation (price action, volume)
- **Stop Loss**: Tighter stops
- **Take Profit**: Partial targets
- **Position Size**: Reduced position size
### Low Confluence (<40 Score):
- **Action**: Avoid trading, wait for better setup
- **Use**: Market analysis only
## Step 7: Backtesting Your Strategy
1. **Use TradingView's Strategy Tester**
2. **Convert indicator to strategy** (modify Pine Script)
3. **Test different timeframes** (4H, Daily, Weekly)
4. **Optimize parameters** based on historical performance
5. **Paper trade** before live implementation
## Step 8: Regular Maintenance
### Weekly Tasks:
- Review key support/resistance levels
- Update Fibonacci lookback period if needed
- Check alert functionality
### Monthly Tasks:
- Analyze performance metrics
- Adjust key levels based on new market structure
- Review and optimize parameters
## Troubleshooting Common Issues
### Indicator Not Loading:
- Check Pine Script syntax errors
- Ensure all input values are valid
- Try reducing lookback periods if memory issues
### Signals Not Appearing:
- Verify key levels are current
- Check if confluence score is reaching threshold
- Ensure all conditions are met simultaneously
### Too Many/Few Signals:
- Adjust confluence score threshold
- Modify RSI overbought/oversold levels
- Change volume multiplier sensitivity
## Mobile App Usage
The indicator works on TradingView mobile app:
1. **Sync your account** to access custom indicators
2. **Alerts will work** on mobile notifications
3. **Table display** may be smaller but functional
4. **All signals and levels** display correctly
## Pro Tips
1. **Combine with multiple timeframes**: Use daily for signals, 4H for entries
2. **Watch news events**: Gold is sensitive to economic data
3. **Monitor correlations**: Watch DXY, yields, and equity markets
4. **Use confluence with price action**: Look for engulfing patterns, pin bars at levels
5. **Risk management**: Never risk more than 1-2% per trade
This indicator automates the confluence analysis we identified and provides clear visual signals for XAUUSD trading opportunities.
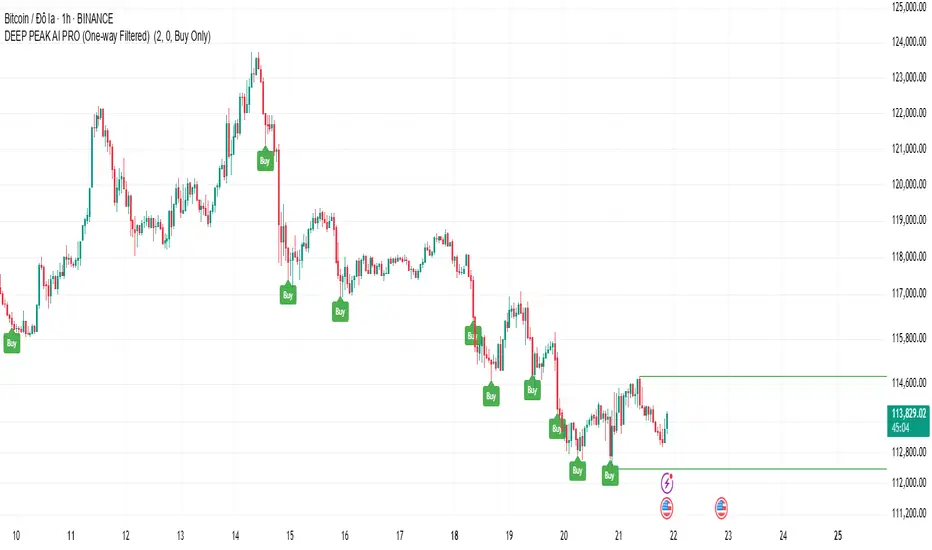
Precision AI Trading Pro🔹 Overview
EN:
Precision AI Trading Pro is an advanced indicator built for adaptability across Crypto, Gold, US Futures, and Forex. Instead of guessing tops and bottoms, it focuses on multi-layer confirmations: higher timeframe alignment, EMA trend structure, momentum filters, and risk-based scoring.
中文:
Precision AI Trading Pro 是一款專為多市場打造的進階版指標,適用於加密貨幣、黃金、美股期貨與外匯。它的重點並非預測轉折,而是透過多層濾網確認進場,結合高階時框共振、EMA 趨勢結構、動能濾網與風險星級評分。
🔹 11 Filter Systems / 11 種過濾系統
HTF Trend Alignment – Confirms higher timeframe direction for stronger bias.
高階時框趨勢共振 – 確認高階時框方向,提高進場可靠度。
Bright Zone (RSI extremes) – Avoids chasing in overbought/oversold extremes.
亮區 (極端 RSI) – 避免在超買/超賣區域追單。
LTF Trend Structure – Ensures local EMAs (3/8/21) align with price action.
低階時框趨勢結構 – 要求 EMA(3/8/21) 與價格方向一致。
MACD Filter – Uses MACD line & signal to confirm momentum strength.
MACD 濾網 – 透過 MACD 快慢線確認動能方向。
Volume Filter – Requires above-average volume to validate signals.
量能濾網 – 必須成交量高於平均,訊號才有效。
ADX Gate – Trades only when ADX shows trend strength, avoids chop.
ADX 閘 – 僅在 ADX 顯示趨勢強度時進場,避免盤整假訊號。
Structure Breakout – Needs breakout of recent swing high/low with buffer.
結構突破 – 需突破近期高低點(含 ATR 緩衝)才允許進場。
Pullback to EMA – Waits for EMA8/21 retest before entry.
回踩 EMA – 僅在回踩 EMA8/21 後才進場。
EMA Band Width – Filters out narrow EMA bands (no clear trend).
EMA 窄帶濾網 – 排除 EMA 過窄的盤整市況。
Peak Guard – Blocks signals during overheated moves, new highs, or surges.
Peak Guard 高位防護 – 避免過熱、新高或急漲時追單。
Trendline / EMA200 Confirmation – Requires EMA200 or pivot-line breakout.
趨勢線 / EMA200 確認 – 僅在突破 EMA200 或樞紐趨勢線後才有效。
(User can define how many filters must be passed, default = 7)
(用戶可自訂需通過幾項濾網才產生訊號,預設為 7 項)
🔹 Features / 功能特色
EN:
Multi-market presets (Crypto, Gold, Futures, Forex)
TP/SL auto-calculation and labels with dynamic R:R
Risk-based star rating system (0★ to 5★)
Optional Peak Guard (avoid chasing extended moves)
Signal modes: Conservative / Balanced / Aggressive
中文:
多市場預設(加密貨幣、黃金、期貨、外匯)
TP/SL 自動計算與標註(動態風報比)
基於風險的星級評分系統(0★ 至 5★)
可選 Peak Guard 功能,避免過度延伸追單
訊號模式:保守 / 平衡 / 積極
🔹 Usage / 操作說明
EN:
Choose your market preset (Crypto, Gold, US Futures, Forex).
Adjust the number of required filters (filterLayers) — default = 7.
TP/SL and risk parameters can be tuned per symbol & timeframe.
Star ratings (0★–5★) help visualize risk level and confluence strength.
Peak Guard and signal modes (Conservative/Balanced/Aggressive) can be toggled based on preference.
中文:
選擇市場預設(加密貨幣、黃金、美股期貨、外匯)。
可調整所需濾網通過數 (filterLayers),預設為 7。
TP/SL 與風險參數可依幣種與時框自行微調。
星級評分(0★–5★)用於直觀顯示風險程度與共振強度。
Peak Guard 以及訊號模式(保守 / 平衡 / 積極)可依需求開關。
⚠️ Disclaimer / 免責聲明
EN:
This indicator is for research and educational purposes only. It is not financial advice and should not be considered a guarantee of profits. Always test responsibly before using it on live markets.
中文:
本指標僅供研究與教育用途。這並非投資建議,也不保證獲利。請務必在實盤使用前,先行測試並謹慎評估風險。

OrderVibe indicator (Invite-Only)What it is
OrderVibe is a closed-source tool that visualizes market structure and volatility. It does not generate trade calls or manage orders. It draws zones/levels and optional alerts so traders can build their own process.
How it works - technical overview (conceptual)
* Trend regime filter (optional). Uses a sloped moving-average baseline to qualify trend and can require higher-timeframe (HTF) agreement.
* Momentum gate. A smoothed, rate-of-change–style momentum must align with the trend and exceed a configurable strength threshold.
* Volatility filter. ATR-based bounds suppress setups when volatility is unusually low or high for the instrument.
* Order-block zones (SMC element). Marks candidate OB zones derived from pre-break structure and uses them for confluence; zones invalidate on decisive closes.
* Support/Resistance. Clusters recent pivots into zones using ATR-relative distance, keeping the most relevant areas by recency/proximity.
* Informational entry label. Prints on controlled retests of active zones when trend/momentum/volatility conditions are met. Labels are informational only.
* Baseline stop suggestion. Suggests a protective distance based on ATR or recent swing, whichever is more conservative.
* ATR TP ladder (TP1-TP10). Optional multi-level targets built from ATR multiples; per-level toggles and alerts.
* Cooldown. After a label, a short cooldown prevents duplicates; invalid zones are removed automatically.
* Alerts (optional). New S/R zone, new OB zone, TP reached, and related events.
Why it’s not a simple mashup
* Dual qualification (trend + momentum) with optional HTF agreement.
* Volatility-aware suppression and ATR-normalized zone clustering.
* Integrated ATR TP ladder with per-level controls and cooldown in one workflow.
* Provides clear value beyond classic MA/ATR combinations by combining HTF-aware gating, ATR-relative zone clustering, and structured multi-target management.
How to use
* Works on any symbol; defaults are calibrated for intraday XAUUSD.
* Adjust ATR lengths/ranges and TP multipliers to your instrument.
* Hide unused TP levels; forward-test before using live.
* Educational analytics only; no signals or advice.
Disclaimer
Analytical tool only. This is not financial advice and outcomes are not guaranteed. Use independent judgment and risk management.
Access
Access is invite-only and granted manually on TradingView. For contact details, see my Signature.

Stella EdgeStella Edge — Quick Guide (EN)
1. What It Does
Stella Edge provides a stellar advantage in the markets by visualizing a key gravitational price level (EMA) and an upper resistance zone based on higher-timeframe volatility (ATR). The system delivers sharp entry signals (▲▼), confirms take-profit targets with a shining star (⭐️), and warns of high-risk "black hole" events (💀), helping you trade with a clear edge.
2. Choosing the Best Markets & Timeframes
This indicator works best in markets that exhibit clear trending and consolidation phases, such as major FX pairs, indices, and cryptocurrencies, especially for scalping and day trading.
Recommended timeframes: 1 minute to 30 minutes.
For high-volatility assets (e.g., BTC, Gold), consider using the higher end of the range (5m to 30m) to focus on more stable zones.
For lower-volatility assets (e.g., major FX pairs), 1m–15m charts can effectively capture shorter-term opportunities.
Tip : Adjust the Higher TF for EMA/ATR setting to match your trading style. A higher TF provides broader, more stable zones, while a lower TF reacts more quickly to price.
3. Building Your Trade Plan
Entry Signals: Look for buy signals (▲) as the price crosses the invisible lower volatility boundary. Look for sell signals (▼) as the price pushes into or crosses the visible upper resistance zone.
Take-Profit Target : The central EMA line is your primary target. The indicator will automatically plot a ⭐️ sign when the price touches this line after an entry signal, indicating a successful exit point.
Stop-Loss Placement : A logical Stop Loss can be placed using a multiple of the ATR or at a recent swing high/low outside the entry band.
Danger Signal (💀): A 💀 icon warns of extreme, news-driven volatility. It is strongly advised to avoid new entries and protect existing positions when this signal appears.
4. Key Parameters
Higher TF for EMA/ATR: The most important setting. This determines the timeframe from which the core EMA/ATR channel is calculated.
ATR Multiplier : Controls the width of the resistance zone and the invisible lower band. Increase for wider zones (fewer signals), decrease for narrower zones (more signals).
Enable Extreme Volatility Filter? : Toggles the 💀 danger signal feature on or off.
ATR & Volume Spike Multiplier : Adjusts the sensitivity of the danger signal. Lower values make the filter more sensitive to spikes.
5. Important Disclaimer
This tool suggests potential trade setups and risk areas; it does not guarantee profit or prevent loss. News shocks, thin liquidity, or abnormal volatility can negate any signal. All trading decisions and resulting P&L are entirely your responsibility. Leveraged trading can exceed your initial deposit—use only risk capital you can afford to lose. We accept no liability for losses or damages arising from the use of this tool.
Stella Edge — クイックガイド (JP)
1. 機能概要
「Stella Edge」は、星の引力のように相場の中心となるEMAラインと、上位足のボラティリティに基づいた抵抗帯(レジスタンスゾーン)を可視化するトレーディングシステムです。
鋭いエントリーサイン(▲▼)、星の輝きのような利確目標(⭐️)、そして危険なブラックホール相場(💀)を知らせる警告で、あなたのトレードに優位性をもたらします。
2. 最適な銘柄・時間軸の選定
スキャルピングやデイトレードなど、短期売買を主体とする銘柄(主要通貨ペア、指数、暗号資産など)と相性◎
推奨時間軸 :1分足~30分足
ボラティリティが高い銘柄(BTC、ゴールドなど)⇒ 5分~30分足で、より安定したゾーンを基準に分析するのがおすすめです。
ボラティリティが低い銘柄(主要通貨ペアなど)⇒ 1分~15分足で、短期的なチャンスを捉えるのに有効です。
ヒント: 設定のHigher TF for EMA/ATRを調整することで、ご自身のスタイルに合った時間軸のゾーンを表示できます。
3. トレードプランの策定
エントリーポイント: 買いサイン(▲)は、価格が目に見えない下限バンドをクロスしたときに出現します。売りサイン(▼)は、価格が紫色の抵抗帯に侵入、または上に抜けたときに出現します。
利食い目標 : 中心に走るEMAラインが、第一の利食い目標です。エントリー後、価格がこのEMAにタッチすると、利確を示す**⭐️**マークが自動で表示されます。
損切り設定 : ATRを基準にするか、直近の高値・安値の外側など、ご自身のルールに基づいて損切りを必ず設定してください。
危険サイン(💀)について : **💀**マークは、指標発表などで突発的なボラティリティが発生したことを示す警告です。このサインが出現した際は、新規エントリーを避け、ポジション管理を徹底することを強く推奨します。
4. 主要パラメーター解説
Higher TF for EMA/ATR: 最も重要な項目。インジケーターの核となるゾーンを、どの時間足を基準に計算するかを設定します。
ATR Multiplier : 抵抗帯の幅を調整します。数値を大きくするとゾーンが広くなりサインが厳選され、小さくするとゾーンが狭まりサインが増加します。
Enable Extreme Volatility Filter? : 危険サイン(💀)機能のON/OFFを切り替えます。
ATR & Volume Spike Multiplier : 危険サインの感度を調整します。数値を下げるほど、より敏感に異常なボラティリティを検知します。
5. 重要なご注意(Disclaimer)
本ツールは相場の反発ポイントやリスクを示唆するものであり、利益を保証するものではありません。ニュースや低流動性などによりサインが機能しない場合があります。取引で発生する損益はすべてご本人の責任となります。レバレッジ取引は証拠金を超える損失リスクを含みます。必ず余裕資金内でご利用ください。本ツールの利用に起因する損失・損害について、制作者は一切責任を負いません。

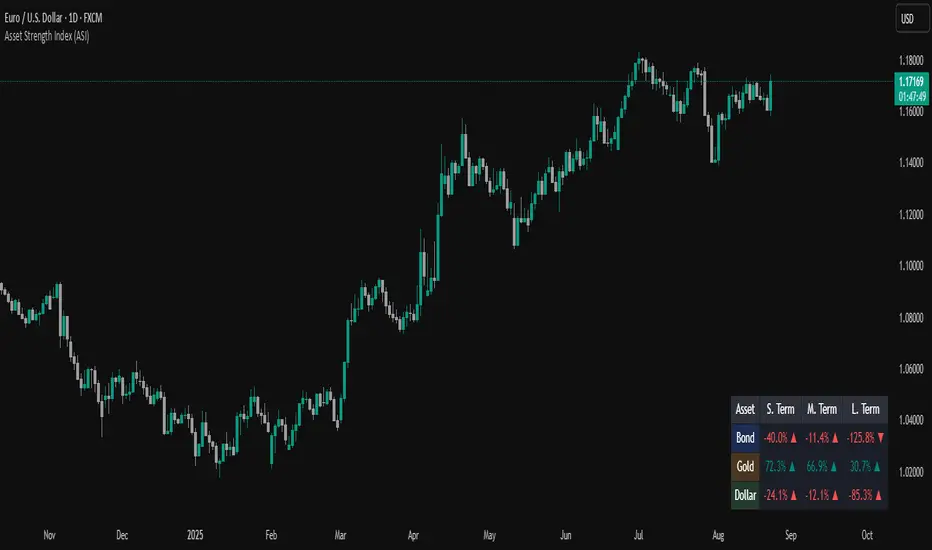
Asset Strength Index <DOSALGO>The Asset Strength Index (ASI) is a comprehensive dashboard indicator designed to provide traders with a broader perspective on market dynamics. Instead of viewing an asset in isolation, the ASI measures its relative strength against a basket of key global assets: Bonds, Gold, and the US Dollar.
This tool is built to give you an immediate, visual understanding of how the asset you are charting is performing in the context of the wider financial landscape. The analysis is presented across three distinct time horizons—Short-Term, Medium-Term, and Long-Term—allowing for a nuanced view of performance.
How It Can Be Useful
The core purpose of the ASI is to serve as a contextual analysis tool. By understanding an asset's strength or weakness relative to others, traders can gain valuable insights that may not be apparent from price action alone.
Inter-Market Confirmation: Use the dashboard to confirm your trading ideas. For example, a bullish outlook on a stock index could be strengthened if it shows increasing strength against safe-haven assets like Gold and Bonds.
Risk Sentiment Barometer: Gauge the prevailing risk-on or risk-off sentiment. If the US Dollar and Bonds are showing strength while your asset is weakening, it could indicate a broader market shift towards safety.
Multi-Term Perspective: Quickly assess if short-term movements are aligned with the longer-term trend. A short-term dip might be less concerning if the asset's long-term relative strength remains high.
How to Use It
The ASI dashboard is displayed directly on your chart. The values are presented as percentages, indicating the relative strength for each term.
Monitor the Readings: Observe the percentage values in the "S. Term," "M. Term," and "L. Term" columns. Positive values suggest relative strength, while negative values indicate relative weakness.
Look for Trends: The arrows (▲ or ▼) next to the percentage show the most recent change, helping you spot developing trends in relative strength.
Combine with Your Strategy: The ASI is not a standalone signal generator. It is most effective when used to supplement your existing trading system, helping you make more informed decisions by adding a layer of sophisticated, inter-market analysis.
The dashboard's appearance is fully customizable, allowing you to adjust its position, size, and colors to fit your chart layout.
Disclaimer
The Asset Strength Index (ASI) is a tool for market analysis and should not be considered financial advice. All trading involves risk, and past performance is not indicative of future results. Always use this indicator in conjunction with your own comprehensive trading plan and risk management strategy.
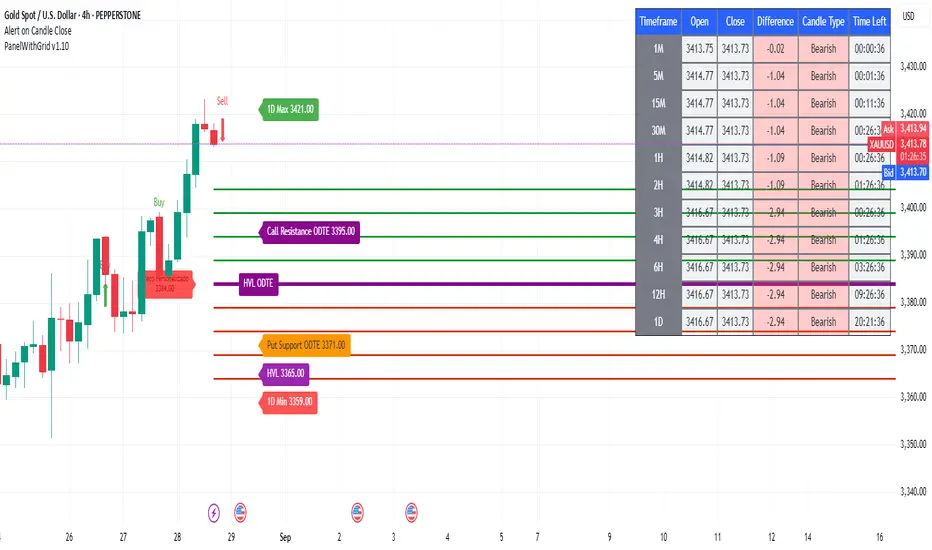
PanelWithGrid v1.7PanelWithGrid v1.7 - Advanced Multi-Timeframe Grid and Panel Indicator
DESCRIPTION:
PanelWithGrid v1.7 is a comprehensive tool for traders who want to monitor multiple timeframes simultaneously while operating based on a customizable price grid. This indicator combines two essential functionalities in a single script:
🎯 MAIN FEATURES:
✅ CUSTOMIZABLE GRID SYSTEM
Configurable timeframe for the grid base (1M to Monthly)
Selection of the reference candlestick level (0 = current, 1 = previous, etc.)
NEW: Custom price as the grid base
Adjustable distance between lines in points
Colored lines (red = base, blue = above, gold = below)
Informative label with the base value
✅ COMPLETE MULTI-TIMEFRAME DASHBOARD
Monitoring of 11 timeframes: 1M, 5M, 15M, 30M, 1H, 2H, 3H, 4H, 6H, 12H, and 1D
Real-time data: open, close, difference, and candlestick type
Countdown to close Each candle
Intuitive colors (green for bullish, red for bearish)
✅ CONFLUENCE SYSTEM
Visual and audio alerts for bullish/bearish confluence on all timeframes
Special confluence analysis for 1H candles after 30 minutes of formation
Buy/sell arrows on the chart for clear signals
⚙️ MAIN SETTINGS:
Grid Settings:
Timeframe for Grid: Select the period for the baseline
Candle Level: 0 (current candle), 1 (last candle), etc.
Grid Distance: Distance between lines in points
NEW: Use Custom Price - Enables manual price as a base
Custom Close Price - Sets the manual value for the grid
🎨 VISUAL:
Grid with lines extended to the right
Panel positioned in the upper left corner
Colors organized for easy interpretation
Informative labels directly on the chart
🔔 ADVANCED FEATURES:
Alerts configured for confluences
Optimized for performance
Real-time updates
Compatible with all pairs and markets
PERFECT FOR:
Scalpers and day traders
Level-based trading
Multiple timeframe analysis
Reversal and breakout strategies
UPDATE v1.7:
Added custom price option for the grid
Improved line stability
Performance optimization
Bug fixes minors
INSTRUCTIONS FOR USE:
Apply the indicator to the chart
Set the desired timeframe and level for the grid
Adjust the distance between lines according to your strategy
Use the custom price if you want a specific basis
Monitor the dashboard to see the convergence between timeframes
Trade based on the identified confluences
NOVA LINE RZNOVA LINE RZ — Quick Guide (EN)
1. What It Does
NOVA LINE with Resistance Zone combines buy/sell signals with a dynamic JLINE (triple EMA) analysis. It automatically detects price consolidation zones where the JLINEs cross and draws them as horizontal support/resistance bands extended into the future. By pairing the reversal arrows with these key price levels, the indicator helps you identify high-probability entry points with greater confidence.
---
2. Choosing the Best Markets & Timeframes
・This indicator works best in markets that exhibit clear trending and consolidation phases, such as major FX pairs, indices, and cryptocurrencies.
・Recommended timeframes: 15 minutes to 4 hours.
・For high-volatility assets (e.g., BTC, Gold), consider using higher timeframes (1h+) to focus on more significant zones.
・For lower-volatility assets (e.g., major FX pairs), 15m–1h charts can effectively capture key consolidation patterns.
Tip: If too many small zones are cluttering your chart, switch to a higher timeframe for a cleaner perspective.
---
3. Building Your Trade Plan
・Use the Zones as Your Primary Reference. The horizontal bands represent powerful support and resistance areas. A buy/sell arrow that appears as price reacts to one of these zones is a much stronger signal.
・Wait for Confirmation. Treat the arrow as a trigger, not a blind command. Wait for price to test a zone and show a clear reaction (e.g., a rejection candle, an engulfing pattern) before entering.
・Leverage the JLINE Filter. In the indicator settings, you can enable the "JLINE Filter" to only show signals that align with the broader trend direction (i.e., buy signals in a bullish perfect order).
・Define Risk First. Always determine your Stop Loss (e.g., on the other side of the zone) and Take Profit levels before entering a trade.
---
4. Key Parameters — JLINE Resistance Zone
Show Resistance Zone
Toggles the visibility of the horizontal price zones.
Max Number of Zones to Display
Sets the maximum number of zones on the chart. Older zones are automatically removed to keep your view clean and focused on the most relevant levels.
Zone Color
Adjusts the color and opacity of the zones to match your chart's theme.
---
5. Important Disclaimer
The indicator suggests potential reaction zones and reversals; it does not guarantee them. News shocks, thin liquidity, or abnormal volatility can negate any signal. All trading decisions and resulting P&L are entirely your responsibility. Leveraged trading can exceed your initial deposit—use only risk capital you can afford to lose. We accept no liability for losses or damages arising from the use of this tool.
---
---
NOVA LINE with Resistance Zone — クイックガイド (JP)
1. 機能概要
NOVA LINE RZ(Resistance Zone)は、転換サインとJLINE(3本のEMA)の動的な分析を組み合わせたインジケーターです。
JLINEが収束する「持ち合い価格帯」を自動で検出し、将来のサポート/レジスタンスとして機能する水平帯を描画します。売買サイン(矢印)とこの水平帯を組み合わせることで、より確信を持ってエントリーポイントを判断できるようサポートします。
---
2. 最適な銘柄・時間軸の選定
トレンドと持ち合いが明確に発生する銘柄(主要通貨ペア、指数、暗号資産など)と相性◎
推奨時間軸:15分足〜4時間足
ボラティリティが高い銘柄(BTC、ゴールドなど)⇒ 1時間足以上で、より重要な価格帯に絞って分析するのがおすすめです。
ボラティリティが低い銘柄(主要通貨ペアなど)⇒ 15分〜1時間足で、短期的な持ち合いパターンを捉えるのに有効です。
ヒント: 水平帯の色が濃いほど抵抗帯として機能する可能性が高くなります。水平帯がチャート上に多発して見にくい場合は、コントロールパネルの「Max Number of Zones to Display」をご調整ください。
---
3. トレードプランの策定
水平帯を最重要の基準とする
描画される水平帯は、強力なサポート/レジスタンスエリアです。価格がこの帯に到達し、反発するタイミングで出現する矢印サインは、信頼性の高いエントリー候補となります。
反発の確認を待つ
矢印を機械的なエントリー指示とせず、あくまで「トリガー」として扱ってください。価格が水平帯に到達し、反発のローソク足(例:ピンバー、包み足など)が確定したのを見てからエントリーすることで、精度が向上します。
JLINEフィルターを活用する。
設定で「JLINE Filter」を有効にすると、長期的なトレンド方向と一致するサインのみを表示させることができます(例:上昇パーフェクトオーダー中は買いサインのみ表示)。ただし、天底でのサインは出にくくなります。(Filterが効きすぎるため、デフォルトではOFF表示)
リスクを先に決める
最も重要な項目です。トレード前に必ず損切りライン(例:水平帯の反対側)と利食い目標を設定しましょう。
---
4. 主要パラメーター解説 — JLINE Resistance Zone
Show Resistance Zone
水平帯の表示 / 非表示を切り替えます。
Max Number of Zones to Display
チャートに表示する水平帯の最大数を設定します。設定した数を超えると、古い帯から自動で削除され、チャートを常にクリーンに保ちます。
Zone Color
お使いのチャートテーマに合わせて、水平帯の色や透明度を自由に調整できます。
---
5. 重要なご注意(Disclaimer)
本ツールは相場の反発ポイントを示唆するものであり、反転を保証するものではありません。ニュースや低流動性などによりサインが機能しない場合があります。取引で発生する損益はすべてご本人の責任となります。レバレッジ取引は証拠金を超える損失リスクを含みます。必ず余裕資金内でご利用ください。本ツールの利用に起因する損失・損害について、制作者は一切責任を負いません。

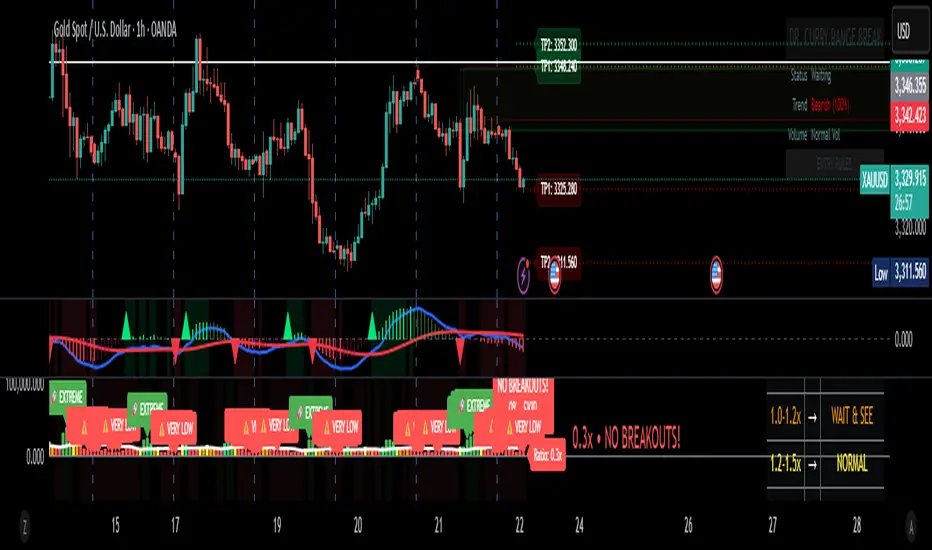
Dr. Curry Range Break# 🚀 DR. CURRY RANGE BREAK - QUICK START CHEAT SHEET
## ⚡ 5-MINUTE SETUP GUIDE
### 1️⃣ **ADD TO CHART**
- Timeframe: **5-MINUTE CHART** (MUST USE!)
- Add indicator: "Dr. Curry Range Break"
- Default settings work great!
### 2️⃣ **WAIT FOR THE BLUE BOX** (9:30-9:45 AM ET)
```
🔵 BLUE BOX = Your Trading Range
- Forms in first 15 minutes
- DO NOT TRADE until box completes!
```
### 3️⃣ **WATCH FOR BREAKOUT SIGNALS**
#### 🟢 **LONG SETUP (BUY)**
- Price CLOSES above blue box
- Look for signal on chart:
- **GREEN = GO!** (★★★ Best)
- **BLUE = GOOD** (★★)
- **GOLD = CAREFUL** (★)
#### 🔴 **SHORT SETUP (SELL)**
- Price CLOSES below blue box
- Look for signal on chart:
- **RED = GO!** (★★★ Best)
- **BLUE = GOOD** (★★)
- **GOLD = CAREFUL** (★)
## 📊 TRADE MANAGEMENT
### **ENTRY CHECKLIST** ✅
1. Blue box complete? ✓
2. Candle CLOSED outside box? ✓
3. Signal appeared? ✓
4. Volume says "HIGH VOL"? (Even better!)
### **WHERE TO EXIT**
- **Take Profit**: Green/Red TP lines on chart
- **Stop Loss**: Opposite side of blue box
- **Quick Rule**: Risk $100 to make $200+
## 🎯 THE ONLY 3 RULES YOU NEED
### RULE 1: **COLOR = ACTION**
```
GREEN/RED Candle = BEST Trade
BLUE Candle = GOOD Trade
GOLD Candle = SKIP (risky)
```
### RULE 2: **STARS = QUALITY**
```
★★★ = Full position size
★★ = Half position size
★ = Don't trade (or tiny size)
```
### RULE 3: **PANEL = CONFIRMATION**
Look for:
- **"HIGH VOL ✓"** = Strong move
- **"Bullish/Bearish"** = With trend
- **Stop Loss price** = Your exit
## 🚦 SIMPLE DECISION TREE
```
Is there a BLUE BOX?
↓ NO → Wait
↓ YES
Did price CLOSE outside box?
↓ NO → Wait
↓ YES
What COLOR is the signal?
↓ GOLD → Skip trade
↓ BLUE → Maybe trade (check stars)
↓ GREEN/RED → TRADE IT!
```
## ⏰ BEST TRADING TIMES
**BEST**: 9:45 AM - 10:30 AM ET
**GOOD**: 10:30 AM - 11:30 AM ET
**AVOID**: After 12:00 PM (lunch chop)
## 💰 POSITION SIZING (Beginners)
- **★★★ Signal**: Risk 1% of account
- **★★ Signal**: Risk 0.5% of account
- **★ Signal**: Don't trade
**Example**: $10,000 account
- ★★★ = Risk $100 per trade
- ★★ = Risk $50 per trade
## 🛑 STOP DOING THIS
❌ Trading before blue box completes
❌ Entering on wick touches (need CLOSE)
❌ Taking ★ trades
❌ Moving your stop loss
❌ Revenge trading after a loss
## ✅ START DOING THIS
✅ Wait for box completion
✅ Only trade ★★ or ★★★
✅ Use the stop loss shown
✅ Take partial profits at TP1
✅ Stop after 2 losses
## 📱 FIRST WEEK GOALS
- **Monday**: Just watch, don't trade
- **Tuesday**: Paper trade only ★★★ signals
- **Wednesday**: Paper trade ★★★ and ★★
- **Thursday**: Small real trades (★★★ only)
- **Friday**: Review and learn
## 🎪 THE "SET IT AND FORGET IT" METHOD
1. **Entry**: Market order on signal
2. **Stop**: Set at opposite box level
3. **Target**: Set at TP1 (first green/red line)
4. **Walk away**: Let it hit stop or target
## 🚨 EMERGENCY RULES
**STOP TRADING IF**:
- Lost 2 trades today
- Feeling emotional
- No clear signals appearing
- Market is choppy (no trend)
---
## 📝 YOUR DAILY ROUTINE
**9:25 AM**: Chart open, indicator on
**9:30 AM**: Watch blue box form
**9:45 AM**: Box complete, watch for breakout
**9:46 AM+**: Take signal if it appears
**10:30 AM**: Review trades, possibly done for day
## 💡 ONE LAST TIP
**Start with SIM/Paper Trading for 1 week minimum!**
The best traders are patient traders. Wait for YOUR setup - the market will always give you another chance tomorrow.
**Remember**: 1 good ★★★ trade > 5 random trades
Good luck! 🍀# Dr. Curry Range Break - Professional Trading Indicator
## Overview
The **Dr. Curry Range Break** is a comprehensive trading system designed to identify high-probability breakout opportunities during the market's opening range period. This professional-grade indicator combines volume analysis, multi-timeframe trend confirmation, and smart money concepts to give traders a complete edge in range breakout trading.
## 🎯 Key Features
### 1. **Opening Range Detection**
- Automatically identifies and marks the opening range (5, 15, or 30-minute options)
- Clear visual box showing the range high and low
- Professional blue color scheme for easy identification
### 2. **Smart Breakout Signals**
- **GREEN CANDLE + "STRONG BUY ★★★"** = High probability setup (with trend + high volume)
- **BLUE CANDLE + "BUY SIGNAL ★★"** = Good setup (with trend, normal volume)
- **GOLD CANDLE + "RISKY BUY ★"** = Caution (against trend)
### 3. **Automatic Target Levels**
- Displays TP1, TP2, TP3 levels based on previous swing points
- Clear price labels showing exact target levels
- Green lines for long targets, red lines for short targets
### 4. **Multi-Timeframe Trend Analysis**
- Analyzes 15m, 60m, and 240m timeframes simultaneously
- Shows trend strength percentage in the panel
- Confirms if your trade aligns with the bigger picture
### 5. **Volume Confirmation**
- Identifies high-volume breakouts automatically
- "HIGH VOL ✓" indicator in panel when volume exceeds threshold
- Helps filter out false breakouts
### 6. **Advanced Features**
- Fair Value Gaps (FVG) detection
- Order Block identification
- Stop loss levels clearly marked
- Professional trading panel with all key information
## 📖 How to Use
### Setup
1. **Best Timeframe**: Use on 5-minute chart (also works on 1m and 15m)
2. **Market Open**: Indicator activates at 9:30 AM ET (configurable)
3. **Range Duration**: Default 15 minutes (9:30-9:45 AM)
### Entry Rules
1. **Wait for Range Lock**: Let the opening range complete (default 15 minutes)
2. **Watch for Breakout**: Price must CLOSE above/below the range
3. **Check the Signal**:
- ★★★ = Take the trade with confidence
- ★★ = Good setup, normal position size
- ★ = Risky, reduce size or skip
### Exit Strategy
- **Take Profit**: Use the TP levels shown on chart
- **Stop Loss**: Opposite side of the range (shown in panel)
- **Trail Stop**: Move to breakeven after TP1
## 🔍 What to Look For
### Best Setups (★★★)
- Green/Red candle on breakout
- "HIGH VOL ✓" in panel
- Trend aligned (Bullish/Bearish in panel)
- Clear TP levels above/below
### Good Setups (★★)
- Blue candle on breakout
- Normal volume
- With trend direction
- Multiple TP levels available
### Avoid These (★)
- Gold/Yellow candle (against trend)
- Low volume breakouts
- Choppy market conditions
- No clear TP levels
## ⚙️ Customization Options
### Visual Settings
- **Minimal Mode**: Reduces clutter for experienced traders
- **Show/Hide**: Targets, FVG, Order Blocks, Swing Points
- **Panel Position**: Choose corner placement
### Range Settings
- **Timezone**: Adjust for your market
- **Duration**: 5, 15, or 30-minute ranges
- **Market Open**: Customize start time
### Advanced Settings
- **Volume Multiplier**: Adjust high volume threshold
- **Target Count**: Show 1-3 TP levels
- **EMA Length**: Trend calculation period
## 💡 Pro Tips
1. **Best Days**: Monday-Thursday typically have cleaner breakouts
2. **Avoid Fridays**: Often choppy with less follow-through
3. **News Days**: Check economic calendar - avoid FOMC days
4. **Time It**: Best breakouts often occur 30-60 minutes after open
5. **Volume Matters**: Never take a ★ trade on low volume
## 🚨 Risk Management
- **Position Size**: Risk 1-2% per trade maximum
- **Stop Loss**: Always use the opposite range level
- **Scaling**: Take partial profits at each TP level
- **Daily Max**: Stop after 2-3 losses in a day
## 📊 Success Metrics
This indicator helps identify:
- High probability breakouts with 60-70% win rate on ★★★ setups
- Clear risk/reward with defined stops and targets
- Optimal entry timing with volume confirmation
- Trend alignment for higher probability trades
---
**Remember**: No indicator is perfect. Always use proper risk management and combine with your market knowledge. The Dr. Curry Range Break is a tool to enhance your decision-making, not replace it.
*Happy Trading! 📈*## 📦 Box Color Guide - Dr. Curry Range Break
### 🔵 **BLUE BOX - Opening Range**
- **What it means**: This is your main trading range (first 15/30 minutes)
- **How to use**: Wait for price to break above/below this box
- **Key levels**: Top = Range High (Long entry above), Bottom = Range Low (Short entry below)
### 🟢 **GREEN BOXES - Bullish Zones**
1. **Light Green Transparent Box (FVG - Fair Value Gap)**
- **What it means**: Bullish imbalance/gap in price
- **How to use**: Acts as support on pullbacks
- **Trading tip**: If price returns to this box after breakout, it's a good re-entry zone
2. **Very Light Green Box (Order Block)**
- **What it means**: Last bearish candle before a strong move up
- **How to use**: Major support zone
- **Trading tip**: Great area to add to positions or enter if missed initial breakout
### 🔴 **RED BOXES - Bearish Zones**
1. **Light Red Transparent Box (FVG - Fair Value Gap)**
- **What it means**: Bearish imbalance/gap in price
- **How to use**: Acts as resistance on pullbacks
- **Trading tip**: If price returns to this box after breakdown, it's a good re-entry zone for shorts
2. **Very Light Red Box (Order Block)**
- **What it means**: Last bullish candle before a strong move down
- **How to use**: Major resistance zone
- **Trading tip**: Great area to add to short positions or enter if missed initial breakdown
### 🟠 **ORANGE BOX - Breaker Block**
- **What it means**: Failed support/resistance that flipped
- **How to use**: Strong reversal zone
- **Trading tip**: Often marks the end of a move - consider taking profits
## 🎯 Quick Reference
```
BLUE = Your main range to trade
GREEN = Support zones (buy/hold)
RED = Resistance zones (sell/short)
ORANGE = Reversal warning
```
## 💡 Pro Tips for Using Boxes
1. **Multiple Green Boxes** = Stronger bullish bias
2. **Multiple Red Boxes** = Stronger bearish bias
3. **Price respecting boxes** = Higher probability trades
4. **Price ignoring boxes** = Potential trend change
### Box Stacking Priority
1. **Most Important**: Blue Opening Range
2. **Very Important**: Order Blocks (light green/red)
3. **Important**: FVG boxes
4. **Warning**: Orange breaker blocks
**Remember**: The more boxes align in one direction, the stronger the move typically is!
SMT for Time-Based Sessions [ufo]SMT for Time-Based Sessions identifies when one asset breaks a session’s high/low while another correlated asset fails to do so. This imbalance often signals engineered liquidity grabs, reversals, or continuation setups. By focusing on divergences within specific trading sessions (London, New York AM, Lunch, New York PM, Asia, Daily or your own custom windows), the tool filters out noise and pinpoints only the most meaningful SMT divergences across multiple symbols in real-time.
Core Concept:
SMT (Smart Money Technique/Tool/Time) is a concept popularized by Inner Circle Trader (ICT) that suggests that when correlated or inversely correlated instruments fail to confirm each other's price movements (e.g., one breaks a high/low while the other doesn’t), it often indicates:
Liquidity manipulation by institutional players
Potential reversal points in the market
Weakness or strength in the current trend
Stop hunt operations before significant moves
This indicator identifies these divergences by comparing your chart symbol against up to two comparison symbols across different sessions and timeframes.
How Time-Based SMT Works:
Unlike basic divergence tools, this indicator is built specifically for Session-Based and Timeframe-Based SMT tracking. It continuously monitors intraday sessions and higher timeframes, then plots divergences the moment they occur.
Time-Based Session SMT
Session Tracking: Monitors highs and lows during each session
Post-Session Analysis: After a session ends, tracks whether price breaks session levels
Divergence Detection: When the main symbol breaks a high/low but comparison symbols don’t (or vice versa), an SMT signal is triggered
(e.g. Nasdaq traded above London high while S&P500 does not)
Visual Confirmation: Lines connect the session reference to the current extreme, with labels showing the diverging session, high/low, and symbol, this information is also displayed in the Info Panel
This will update if a new high/low extreme is made while the SMT is still valid, if invalidated these will be removed from the chart
Example:
This NQ chart includes ES and YM as comparison symbols. At 03:20 AM New York time, both ES and YM broke the Asia session low (20:00 – 00:00), while NQ did not. This creates a bullish session divergence , which the indicator immediately detects and plots.
Although the chart shows three symbols for illustration, you don’t need to manually monitor comparison charts when using this indicator, the SMT divergence will be plotted automatically as soon as it occurs
Consecutive Candle SMT (CC SMT)
Previous Candle Reference: Uses the previous candle's high/low from the selected timeframe
Real-Time Comparison: Monitors if current price breaks these levels across all symbols
Instant Detection: Triggers SMT immediately when divergence occurs
Dynamic Updates: Lines and labels update in real-time as new extremes form and are automatically removed if invalidated
Example:
Here I configured CC SMT Timeframe 1 to monitor the previous 4-hour candle’s high/low. On this NQ chart with ES as a comparison symbol, ES broke above the prior 4-hour high at 14:00 New York time, while NQ did not, showing relative weakness creating a bearish CC SMT divergence
This chart is just an illustration. The indicator will automatically plot SMT divergences on your main chart, regardless of the timeframe you’re viewing
How To Use:
This indicator is not a buy/sell signal on its own. Instead, it is designed to highlight Time-Based SMT divergences so you can combine them with your existing trading strategy or model. It should be used as an extra layer of confluence, helping you confirm trade ideas.
Select your comparison symbols
For example:
Futures: NQ vs ES/YM
Forex: EURUSD vs GBPUSD/DXY(inversely)
Crypto: BTC vs ETH
Commodities: Gold vs Silver
Choose which sessions or candle timeframes you want the indicator to monitor
Watch for divergences the indicator plots when one symbol breaks a high/low while the other does not
Use these divergences as confluence, alongside your own strategy and risk management rules
Key Features:
Multiple Comparison Symbols
Symbol 1 & Symbol 2: Compare your main chart against up to 2 correlated instruments
Symbol Inversion: Perfect for inversely correlated pairs (e.g., EURUSD vs DXY)
Session-Based SMT Tracking
Monitors 7 fully customizable trading sessions with the default being:
London Session (2:00-5:00 NY time)
NY AM Session (9:30-12:00 NY time)
Lunch Session (12:00-13:00 NY time)
NY PM Session (13:00-16:00 NY time)
Asia Session (20:00-00:00 NY time)
Custom Session 6 (if you want to add an extra session)
Daily Session (18:00-18:00 NY time)
Fully customizable session times and names
Automatically detects when the main symbol breaks a session high/low while comparison symbols don't (and vice versa)
Consecutive Candle SMT (CC SMT)
Monitors 3 customizable timeframes
Tracking of divergences based on specific timeframe candles (15min, 60min, 4 hour, weekly, etc.)
Identifies when the current price breaks the previous candle's high/low differently than comparison symbols
Maintains history of past SMTs (configurable)
Timeframe 3 supports custom time shifts for non-standard candle boundaries
Example: 90min timeframe with a +60 shift changes the candle range from:
00:00-01:30, 01:30-03:00 etc
to:
01:00-02:30, 02:30-04:00 etc
Visual Customization
Line Styles: Customize the line styles for different symbols
Colors: Unique color schemes for instant session identification
Adjustable Offsets: Fine-tune label positions with multiplier settings
Show/Hide Controls: Complete control over visual elements
Custom Labels: Customize the SMT labels for highs and lows
Information Panel
Active SMT Conditions: Live tracking of all current divergences
Session Names: Clear identification of which session created the SMT
Symbol Information: Shows which comparison symbol is diverging
Timestamps: Optional time display showing when SMT was first detected
Flexible Positioning: 8 different panel positions
Smart Display Modes: Options to hide inactive sessions/timeframes
Alert System
Configurable alerts for specific sessions or timeframes
Get notified when new divergences appear instantly
Clear, informative alert descriptions
How To Setup Alerts:
Enable the "Enable Alerts" in the settings
Choose which sessions/timeframes to receive alerts for by choosing it in the setting below
(If you select "All Sessions" you will only be alerted for all the sessions you have enabled in the indicator settings)
Create an alert (ALT+A shortcut) or click the the 3 dots on the indicator "Add alert on Session SMT "
- Condition = Session SMT
- Function = Any alert() function call
- Alert name (Message) = Anything you prefer (e.g. SMT Alert)
If you want to create another alert for different settings, first input the new settings in the indicator, then create a new alert.
Note: Previous alerts will continue to notify you based on the settings they were originally set for, even if you change the indicator setting.
How This Helps Your Trading:
This tool automates the heavy lifting of tracking divergences across multiple markets and sessions, continuously monitoring highs and lows in real time and plotting only the most meaningful SMT signals so you can focus on execution, not chart-watching.

DEEP PEAK AI PRO (One-way Filtered) 🧠 Introducing DeepPeak AI
An intelligent indicator designed to detect price peaks and bottoms, helping modern investors optimize entry and exit points.
🌟 What is DeepPeak AI?
DeepPeak AI is a smart technical analysis indicator powered by artificial intelligence (AI). It identifies potential peak and bottom zones on price charts and provides timely buy-the-dip and sell-the-peak signals.
Built on historical market data, machine learning models, and real-world price behavior, DeepPeak AI allows users to make fast, emotion-free decisions and maximize trading efficiency.
⚙️ How does DeepPeak AI work?
✅ Bottom Detection:
Recognizes oversold zones, bullish reversals, or positive divergences between price and momentum indicators.
→ Suggests BUY in low-risk, high-reward areas.
❌ Peak Detection:
Analyzes when the price hits strong resistance, becomes overbought, or shows signs of weakening bullish momentum.
→ Suggests SELL or TAKE PROFIT in high-risk reversal zones.
🤖 AI Intelligence:
DeepPeak AI continuously learns from thousands of historical price patterns to improve the accuracy of its peak/bottom detection algorithm.
💡 Key Features:
📊 Real-time detection of peaks and bottoms.
📈 Suggested Buy/Sell zones with Take Profit (TP) and Stop Loss (SL) levels.
🔔 Signal alerts via chart and webhook (TradingView integration).
🔄 Self-learning AI that adapts to evolving market behavior.
🔍 Compatible with multiple timeframes and asset types: crypto, stocks, forex, gold, etc.
🧠 Who is DeepPeak AI for?
🧩 New investors who need clear, beginner-friendly signals.
⚔️ Pro traders looking for tools to filter noise and spot ideal trade zones.
🤖 Developers integrating AI-based analysis into trading bots.
⚠️ Usage Notes:
This is not a guaranteed signal tool — use in combination with risk management and overall market analysis.
Works best in trending markets or tight consolidation ranges.