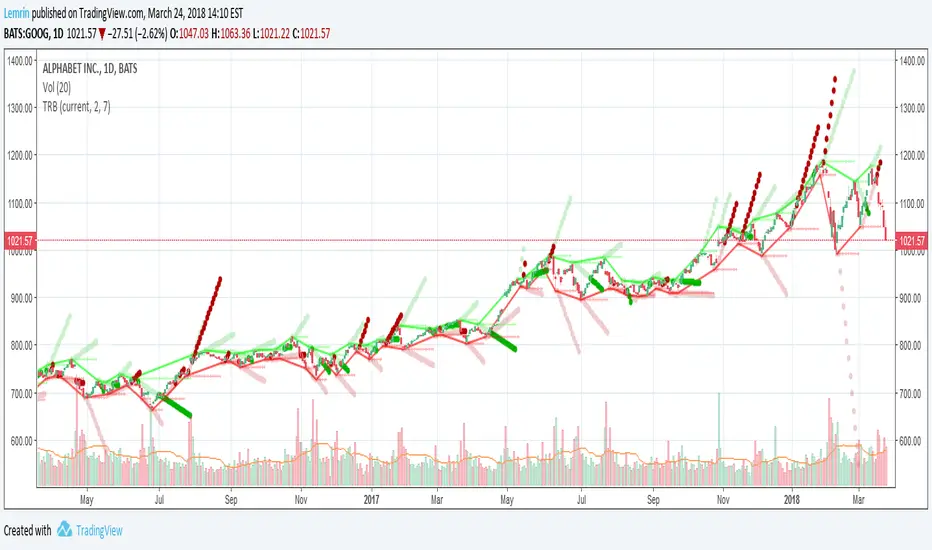
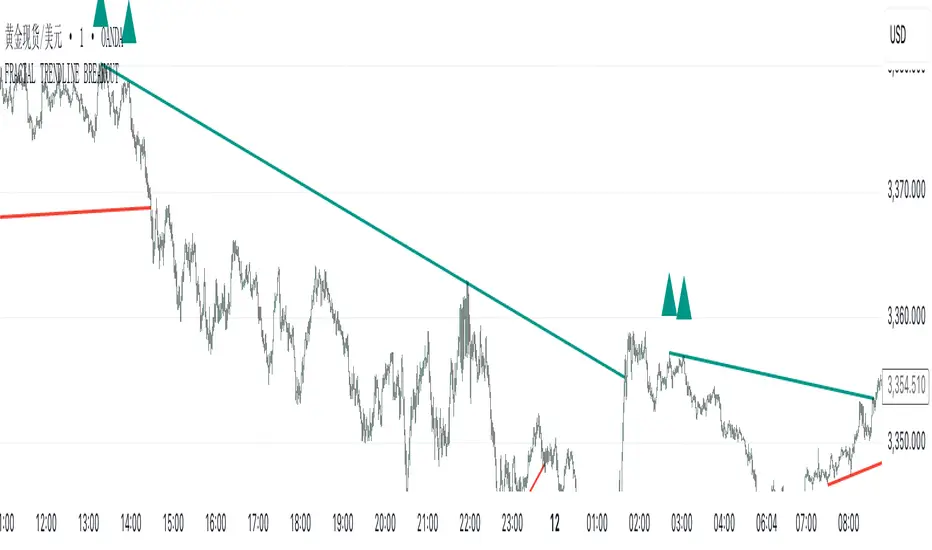
Fractal BreakoutFirst of all, huge credit to synapticEx , whose brilliant use of the security function inspired me to figure out a way to get quasi-shape boundaries automatically drawn on a chart.
This study draws upper and lower trend lines, based on configurable fractal*** reversal detection, calculates slope from the last two upper or lower reversal points, and then extends a dotted line along the same slope...until the next upper (or lower) reversal occurs. If the high (or low) breaks this extension, the dotted line becomes solid to aid visibility. Reversal detection is configurable to use any number of ticks, but probably four to eight will work best.
I made the inclusion of volume in the reversal logic optional (off by default) and left the existing SMA input found in synapticEx's code intact, albeit with a lower default. With the addition of trend lines, I found volume hindered identification of reversals, although I could try various other filters than the SMA included originally.
I have also left intact the very nice ability to change the period and use the requested period identify reversals, courtesy of synapticEx.
This could be used in a strategy, as the values plotted are actual values that are available to include in logic and do not include knowledge of the future. However , information is not available until the floor of half the number of ticks used in reversal detection (I then offset by that number to line things up visually). Having never heard of it until now, I just Googled the Bill Williams Alligator strategy, which looks interesting, so maybe I could see how this could be ported to that.
***As I typed this, I remembered that while making reversal detection configurable, I changed the detection logic simply to look for highest (or lowest) of the desired length of ticks. I don't know whether this is not strictly fractal anymore, but if desired, with a little work, I could make it require consecutive, consistent changes before and after each reversal again.
Here are a few screenshots from hourly ticks, using the "current" (hourly) period, with and without volume, and playing with the number of points used to identify reversals.
Not using volume
Using volume
In den Scripts nach "Fractal" suchen
Candlestick Trend Indicator v0.5 by JustUncleLRequested Update to this Indicator alert project. In this update I have added the option to be able select which Price Action candles you want included in the display and the generated alarm Alert. Other changes also included in this update:
Also added a Price Action candle for "Last Fractal S/R Break", this also a good continuation indication.
Added option to select a different moving average types for directional MA line.
Modified some default settings, using HullMA instead of Zero Lag EMA and standard MACD settings(12,26,9).
Description:
This is a trend following indicator and alert for Binary Options based on Candlestick patterns and trend line -
NOTE: original system was a forex trading system.
This code combines a number of indicators to create an overall trading strategy.
The indicator recognises and displays some useful candle named defined patterns that are used to support trend continuation:
Bearish + Bullish PinBars
Dark Cloud Cover
Piecing Line
Bullish + Bearish Harami
Bullish + Bearish Engulfing Candle
Bullish + Bearish Last Fractal S/R break
Also recognises main Price Action candles from ChrisMoody (CM), the four(4) price action patterns are colored coded bars:
Yellow = Inside Bar - breakout/continuance
Orange = Outside Bar - breakout/continuance
Aqua/Fuschia = Up/Down Shaved Bars - Buying/Selling pressure
Red/Green = Possible reversal PinBars - Reverse Down / reverse Up
The highlighted candles (maroon and darker green) represent the defined PA patterns that have been confirmed following the current trend direction that is indicated by the Hull MA(20) line (can select a different type of MA, or even disable) and confirmed by MACD direction (can be disabled). The confirmed Alerts are indication by green (buy) and red (sell) dots at the bottom of the chart. An alert is generated from this selection for the alert condition of the alarming system.
The fractal upper/lower break lines are also draw, if the (optional) last fractal break line is broken by a highlighted bar then this indicates a stronger trend conformation.
The MACD indicator MACD DEUTER 2 colour(12,26,9) you can visually see the MACD histogram colours with MACD direction - needs "MACD DEUTER 2 colour" indicator.
This multi-indicator set up is suitable for 1hr, 4hr and daily charts with 1-4 candle expiry.
References and Inspiration from:
Fractal Levels by RicardoSantos
Almost Zero Lag EMA
Candlestick Patterns With EMA by rmwaddelljr
CM_Price-Action-Bars by ChrisMoody
www.forexstrategiesresources.com
"Scalp Jockey - MTF MA Cross Visual Strategizer by JayRogers"

Fractal Dimension (Katz, Quant Lab)This indicator estimates the Katz Fractal Dimension of the price series over a rolling window.
It computes:
• L = sum of absolute price changes within the window
• d = maximum distance between any point and the first point in the window
• n = window length
Then applies Katz’s formula:
FDI = ln(n) / (ln(n) + ln(d / L))
The resulting Fractal Dimension typically lies between 1.0 and 2.0:
• FDI ≈ 1.0–1.3 → Strong, directional trend (low randomness)
• FDI ≈ 1.3–1.5 → Mixed / transitional behavior
• FDI ≈ 1.5–2.0 → Noisy, choppy, mean-reverting / range market

Fractal MTF MA System Overview Unlock the fractal nature of the market with a single, clean indicator. This tool allows you to visualize the exact same Moving Average length (default: 50) across 5 different timeframes simultaneously. By comparing "apples to apples" across time dimensions, you get a clear, immediate view of the overall market trend and momentum health.
No more switching charts or manually adding 5 different indicators. This script does it all with a single global setting.
Key Features
🧩 Fractal Logic: Applies one consistent calculation (e.g., 50 Period) to 15m, 30m, 1H, 2H, and 4H timeframes.
🎛️ Global Control: Change the Length or MA Type once, and it instantly updates all 5 lines. No need to adjust each line individually.
🚀 3 Calculation Modes: Switch between DEMA (Double Exponential - Default/Fast), EMA (Standard), or SMA (Smooth) to fit your trading style.
🎨 Visual Clarity: Choose between Step mode (for precise MTF levels) or Line mode (for a smoother, cleaner look).
How to Use This Indicator
1. Trend Following (The Fan) When the market is trending strongly, the lines will stack in perfect order:
Bullish: Price > 15m > 30m > 1H > 2H > 4H.
Bearish: Price < 15m < 30m < 1H < 2H < 4H.
Strategy: Ride the trend as long as the "Fan" is open and orderly.
2. Mean Reversion (The Snap-Back) When the price moves too far from the anchor line (the 4H line) and the gaps between the lines become extreme, the market is "overextended" (like a stretched rubber band).
Strategy: Watch for price to stall and cross back over the fastest line (15m) as an early sign of a correction towards the slower averages.
3. Dynamic Support & Resistance During a trend, price often pulls back to test the 1H or 2H lines before continuing. These lines act as dynamic support zones.
Settings
Global Length: Sets the lookback period for ALL lines (Default: 50).
MA Type: Select DEMA, EMA, or SMA.
Line Style: Toggle between Step (precise) or Line (smooth).
Individual Toggles: You can hide specific timeframes via the settings menu if you want a cleaner chart.
Enjoy the clean charts! Feedback and likes are appreciated. 🚀

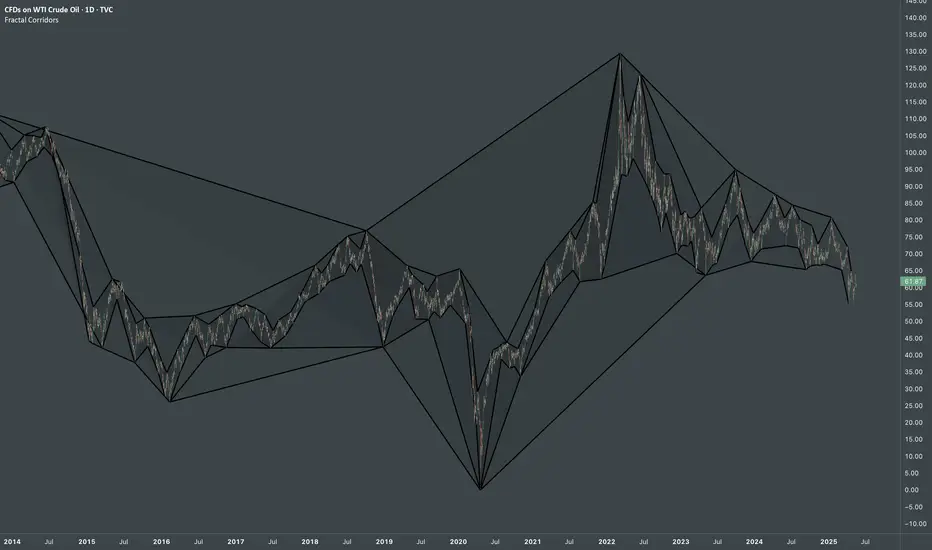
Fractal CorridorsFractal Corridors - visual tool that maps market structure through a multi-scale lens, revealing the underlying architecture of price action across time. By processing pivot points at multiple depths, it constructs a layered geometric corridors that reflects the self-similar, scalable nature of financial markets. Each pivot scale connects successive highs and lows with lines, and when both sides are present, fills the space between them, forming polygonal bands that shift in shape and density as volatility and trend evolve.
Inputs
Base Depth: Number of bars for the smallest pivot
Factor: Multiplier between small, medium and large depths
Selectable color of components
The real value of this indicator lies not in generating executive signals, but in offering a structural perspective that blends short-term fluctuations with longer-term market cycles. The output allows to visually assess trends in terms of shapes, detect compression zones, and identify multi-timeframe confluence areas where price is likely to react. Whether used for macro trend confirmation or pattern evaluation, this indicator transforms raw price data into a clear, fractal-informed map of market behavior, helping the user navigate the complexity of emerging price through the language of geometry.
Fractal Trend continuation / reversalWhen the value of the Fractal indicator reaches 1 we might expect a minor or significant trend a reversal soon. On the contrary, trend continuation is more likely for higher indicator values.
The indicator is derived from Hurst fractal analysis.
It works best with lower tf data, e.g. hourly.
Fractal SL OverlayThis Fractal Stop-Loss Overlay sets a trailing fractal top and bottom to help identify the support and resistances for the current candle.
Use the link below to obtain access to this indicator

Fractal Framer added buy sellThis script was written by Brobear and published. I only modified by adding buy and sell signal when price crossover fractal channel.
buy_breakout=crossover(close,fracLevelHigh) and OsMA >OsMA and emaRSI >emaRSI
sell_breakout=crossunder(close,fracLevelLow) and OsMA
Fractal Regression Channel V0.1Port of @RicardoSantos' Fractal Regression Channel V0 from pinescript 2 to pinescript 3.
// Source:
// Original Author: @RicardoSantos

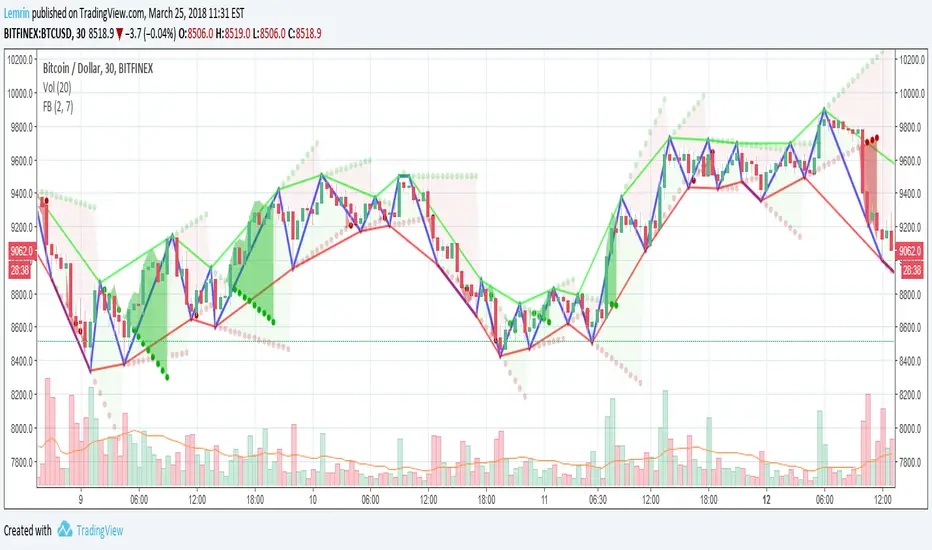
Fractal Breakout V2Version 2 of my fractal pattern aid ( Version 1 ).
I added a bouncing line between the high and low trend lines, connecting consecutive extreme points. I also chased down a pesky bug in the slope calculation...and for now I have disabled the ability to change resolution basis for extreme detection (e.g. 30m on a 1hr chart).
For fun, I added some shading to make it more apparent at a glance what is happening, but if you find it gimmicky, there's an option to turn that off.
I am inexperienced with pattern recognition, so please send feedback if you have any ideas that would make this more useful.
Thanks!
Lemrin
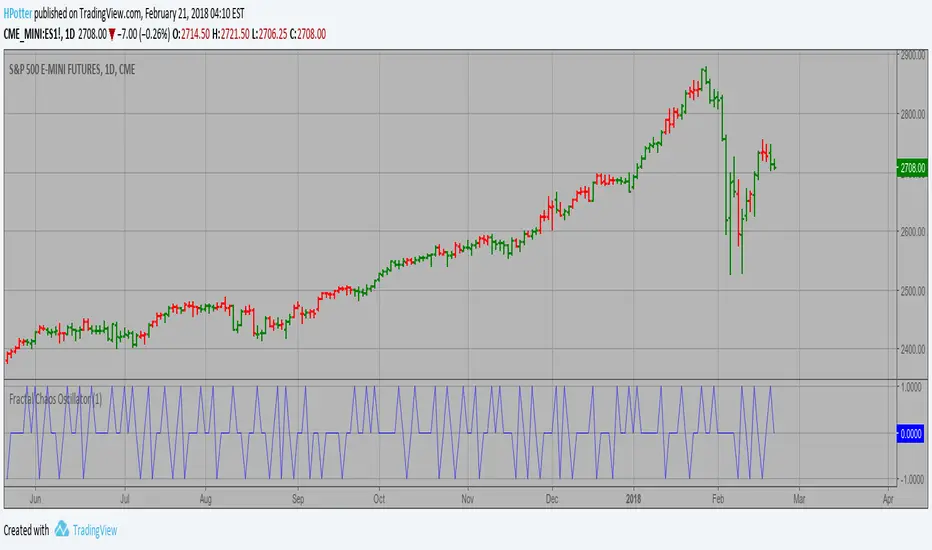
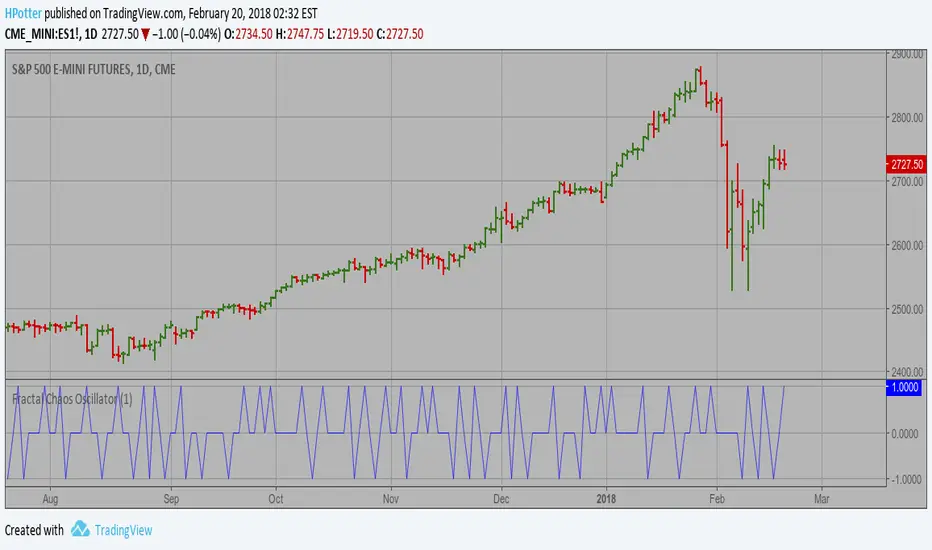
Fractal Chaos Oscillator Strategy The value of Fractal Chaos Oscillator is calculated as the difference between
the most subtle movements of the market. In general, its value moves between
-1.000 and 1.000. The higher the value of the Fractal Chaos Oscillator, the
more one can say that it follows a certain trend – an increase in prices trend,
or a decrease in prices trend.
Being an indicator expressed in a numeric value, traders say that this is an
indicator that puts a value on the trendiness of the markets. When the FCO reaches
a high value, they initiate the “buy” operation, contrarily when the FCO reaches a
low value, they signal the “sell” action. This is an excellent indicator to use in
intra-day trading.
WARNING:
- This script to change bars colors.
Fractal Chaos Oscillator The value of Fractal Chaos Oscillator is calculated as the difference between
the most subtle movements of the market. In general, its value moves between
-1.000 and 1.000. The higher the value of the Fractal Chaos Oscillator, the
more one can say that it follows a certain trend – an increase in prices trend,
or a decrease in prices trend.
Being an indicator expressed in a numeric value, traders say that this is an
indicator that puts a value on the trendiness of the markets. When the FCO reaches
a high value, they initiate the “buy” operation, contrarily when the FCO reaches a
low value, they signal the “sell” action. This is an excellent indicator to use in
intra-day trading.
HM2 - Murrey Math Levels# Murrey Math Indicator - Comprehensive Description
## **What is Murrey Math?**
Murrey Math is a trading system developed by T.H. Murrey that divides price action into 8 equal segments (octaves) based on Gann and geometry principles. It automatically identifies key support and resistance levels where price is likely to react, making it a powerful tool for determining entry/exit points and price targets.
## **How It Works**
The indicator:
1. **Analyzes price history** over a lookback period (default 64-200 bars)
2. **Finds the highest high and lowest low** in that period
3. **Calculates a "fractal"** - a geometric scaling factor based on price magnitude
4. **Creates 8 equal divisions** between key levels, plus 4 overshoot levels (total 13 levels)
5. **Labels each level** from -2/8 to +2/8 with their trading significance
## **The 13 Murrey Math Levels**
### **Core Levels (0/8 to 8/8):**
- ** - Ultimate Support** (Blue)
- Extreme oversold condition
- Strong buying opportunity
- Price rarely breaks below this
- ** - Weak, Stall & Reverse** (Orange)
- Weak support level
- Price often stalls and reverses here
- ** - Pivot/Reverse Level** (Red)
- Major support that can become resistance
- Important reversal zone
- ** - Bottom of Trading Range - BUY Zone** (Green)
- Bottom boundary of normal trading
- **Premium BUY zone** - 40% of trading happens between 3/8 and 5/8
- ** - Major Support/Resistance** (Blue)
- **THE MOST IMPORTANT LEVEL**
- The midpoint - best entry/exit level
- Strong pivot point that price respects
- ** - Top of Trading Range - SELL Zone** (Green)
- Top boundary of normal trading
- **Premium SELL zone**
- ** - Pivot/Reverse Level** (Red)
- Major resistance that can become support
- Important reversal zone
- ** - Weak, Stall & Reverse** (Orange)
- Weak resistance level
- Price often stalls and reverses here
- ** - Ultimate Resistance** (Blue)
- Extreme overbought condition
- Strong selling opportunity
- Price rarely breaks above this
### **Overshoot Levels:**
- ** & ** (Gray) - Extreme downside overshoot zones
- ** & ** (Gray) - Extreme upside overshoot zones
- These indicate extreme moves beyond normal trading ranges
## **Trading Zones (from your diagram)**
1. **Consolidation Trading Area** (0/8 to 3/8)
- Price is in a bearish zone
- Look for BUY opportunities near support levels
2. **Normal Trading Area** (3/8 to 5/8)
- **40% of trading occurs here**
- Price oscillates between these boundaries
- Range-bound trading strategies work best
3. **Premium Trading Area** (5/8 to 8/8)
- Price is in a bullish zone
- Look for SELL opportunities near resistance levels
## **Trading Strategies**
### **Buy Signals:**
- Price bounces off 0/8 (ultimate support)
- Price pulls back to 3/8 in an uptrend
- Price breaks above 4/8 after consolidation
### **Sell Signals:**
- Price rejects at 8/8 (ultimate resistance)
- Price rallies to 5/8 in a downtrend
- Price breaks below 4/8 after consolidation
### **Range Trading:**
- Buy near 3/8, sell near 5/8 when price is ranging
- Use 4/8 as the pivot to determine trend direction
## **Key Advantages**
✅ **Objective levels** - No subjective placement
✅ **Self-adjusting** - Automatically recalculates based on recent price action
✅ **Clear trading zones** - Easy to identify support/resistance
✅ **Works on all timeframes** - From 1-minute to monthly charts
✅ **Combines with other indicators** - Works well with RSI, MACD, etc.
## **Important Notes**
- The indicator is **dynamic** - levels update as new highs/lows form
- **4/8 is the most critical level** - price above = bullish, below = bearish
- When price reaches overshoot levels (±1/8, ±2/8), expect strong reversals
- Works best in trending markets; can give false signals in choppy conditions
This geometric approach to support/resistance has been used by traders for decades and remains popular due to its objective, mathematical nature!

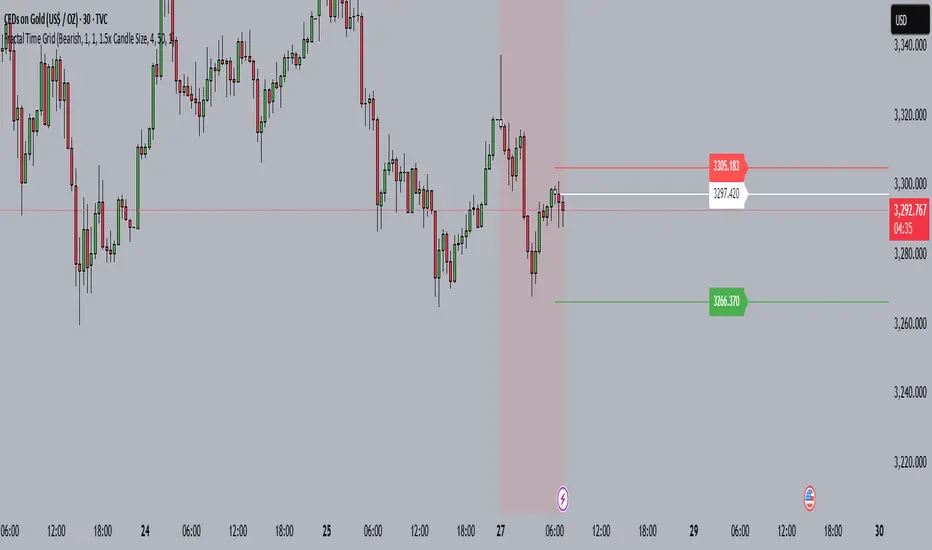
Fractal Time GridOverview
The Fractal Time Grid is a Pine-Script v5 TradingView indicator designed to automate session-based entries, stops, and targets. It overlays on your chart, shading trading “quarters” of any chosen timezone, highlighting bullish or bearish bias zones, and marking up to N entries per quarter with on-chart signals. Optional SL/TP rays and built-in alerts make it a one-stop tool for disciplined session trading.
1. User Inputs
All inputs appear in the indicator’s Settings panel:
Category Input Description
Trend & History Trend Source („Auto“, Bull, Bear) Auto-detects daily bias or forces Bull/Bear
History (days) (≥1) How far back (in days) to keep session shading active
Session Limits Max Entries per 6H Quarter (1–10) Caps how many signals you’ll get in each 6-hour window
Risk Management & Visuals Show Entry/SL/TP Rays (On/Off) Toggles horizontal lines and price labels
SL Method („Bar High/Low“ or „1.5× Candle“) How the stop-loss distance is calculated
Risk:Reward Ratio (e.g. 4.0) Multiplier applied to SL distance to plot TP
Ray Length (bars) (≥1) How far right SL/TP rays extend
Session Timing Timezone Offset (hours, –12 to +14) Shifts session shading to your local clock
Colors Bullish/Bearish Session BG opacity Semi-transparent fill for bias zones
Entry candle colors (Bull/Bear) Highlights actual entry bars
2. Bias Determination
Daily Close vs. Open
Fetches prior-day open/close via request.security(..., "D", …)
If close > open → bullish bias; close < open → bearish
Manual Override
“Bullish” or “Bearish” mode forces one direction
“Auto” follows daily bias
3. Time-Grid Logic
Timezone Handling
Converts UTC bar timestamps by your tzOffset input
Quarter Windows (6H each)
Q1: 23:00–05:00 local
Q2: 05:00–11:00
Q3: 11:00–17:00
Q4: 17:00–23:00
Session Shading
During Q1–Q3 (configurable days back), background colored to match bias
4. Entry Logic
Conditions:
Within an active quarter, bias must match candle direction (bullish candle in bullish quarter, etc.)
Entry count for the quarter must be below your maximum
Counters:
Automatically resets on quarter switch
Tracks how many entries you’ve taken, preventing over-trading
5. Visual Signals
Bar Coloring: Flags entry bars green/red
Shape Markers:
BUY label below bar for long entries
SELL label above bar for shorts
6. Optional SL/TP Rays
When “Show Entry/SL/TP Rays” is enabled:
Computes SL distance either from bar high/low or a multiple of candle size
TP = SL × R:R ratio
Draws three horizontal rays (entry, SL, TP) with end-of-ray price labels
7. Alerts
Pre-built alertcondition calls let you create TradingView alerts instantly:
Names: “BUY Alert” and “SELL Alert”
Messages:
arduino
Copy
Edit
BUY {{ticker}} at {{close}} – Q{{quarter}} – {{entryCount}}/{{maxEntriesQuarter}} entries
(same format for SELL)
8. Why Publish This?
Discipline Built-In: Caps over-trading per session
Timezone-Agnostic: Works equally for NY, London, Tokyo sessions
All-in-One: Bias, timing, entries, risk and alerts in one script
Fully Customizable: Colors, risk settings, time windows, and more
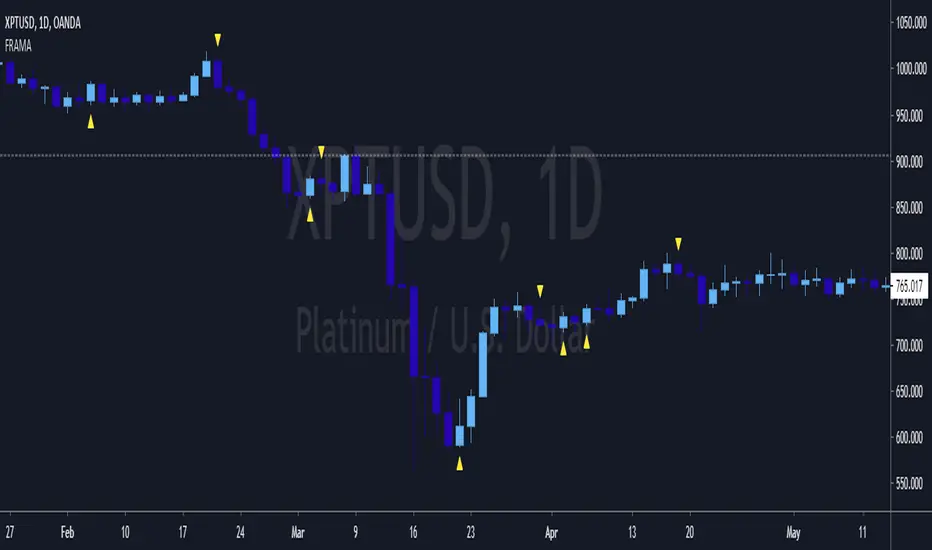
FRAMA and Candlestick Patterns [CSM]FRAMA (Fractal Adaptive Moving Average) is a technical analysis indicator that adapts its smoothing period according to the market's volatility, allowing it to provide accurate signals in all market conditions. This indicator script plots the FRAMA on a chart and generates buy and sell signals based on the FRAMA and candlestick patterns. It also includes an option to filter signals based on bullish and bearish engulfing patterns.
To detect candlestick patterns, the script imports the "BankNifty_CSM" library from the creator's public library on TradingView. The FRAMA calculation is done using a loop that iterates over the last "length" number of bars, with the smoothing factor adjusted based on the "fracDim" parameter.
The buy and sell signals are generated based on the position of the current price relative to the FRAMA line. If the "engulfing" parameter is set to true, the signals are further filtered based on bullish and bearish engulfing patterns.
Overall, this script combines various technical indicators and candlestick pattern recognition to provide a complete trading strategy. However, as with any trading strategy, it should be thoroughly backtested and evaluated before using it in a live trading environment.

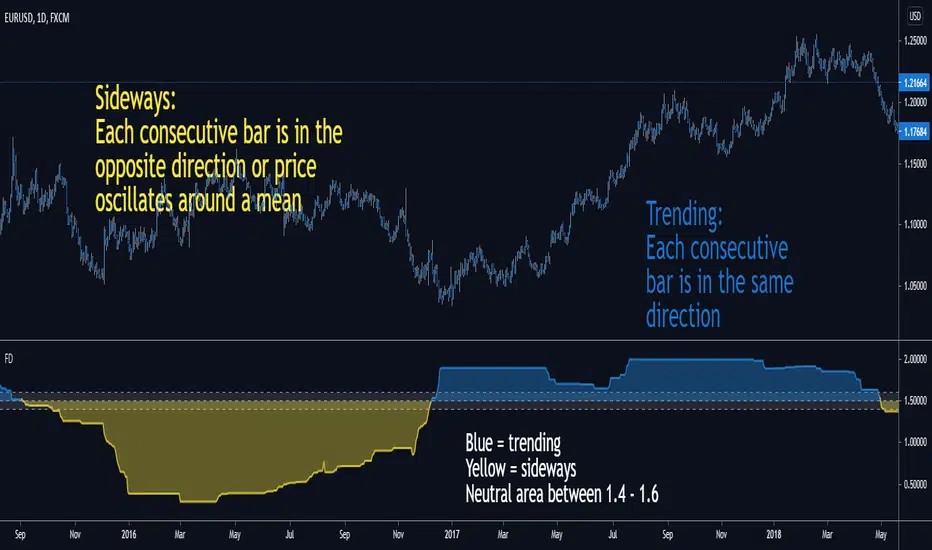
Fractal DimensionThis indicator is used with your trend following or mean reverting strategy.
You only want to trend trade when the Fractal Dimension says the market is trending.
You only want to counter trend/scalp when the FD says the market is sideways.
It's simple to interpret:
Yellow means sideways
Blue means trending
Neutral area in the middle means "random"
You can hide the fill/painting in the Indicator settings.
Fractal Dimension Indicator - FDIThis script adds two hline parameters to an existing Fractal Dimension Indicator:
New Trend and End of Trend Line
When the FDI value goes above 1.55 a new trend is starting (either bullish or bearish).
When the FDI value goes below 1.35 an existing trend is ending (either bullish or bearish).
The FDI does not tell us which way prices will break, only that a break should be coming soon.

FRACTAL-TREND-MTF-GRIDFractal Trend - Multi Time Frame
Toggle time frame 3 on/off (When on, time frame 3 is set to the chart time frame)
Toggle ticker selection on/off
Toggle time frame header on/off
To configure grid see grid instructions below (the indicator in the gif is the SMT but same concept applies)
***** Make sure all instances of the indicator are pinned to the same scale *****
gifyu.com

Fractal Adaptive Entry IndicatorThis entry indicator was inspired by John Ehle'rs "Fractal Adaptive Moving Average"
It's a very sensitive entry indicator that must be paired with a long-term trend detector in order to filter false positives.
Warning I have not backtested this indicator and will not make any claims to its performance.
Visually, it looks promising, however, backtesting and statistical analysis takes time.
Happy trading
<3
Fractal Resonance Super Guppy v1!!!!!!! SUPER NOTICE !!!!!!
This script is not my work. It is a combination of
Pythagoras_Fractal Resonance Bar
and
JustUncleL Super Guppy
!!!!!!! SUPER NOTICE !!!!!!
The idea was, I like the two indicators and wanted to combine them to see what it looked like. It's an experimental script made years ago that am posting now because people were interested after seeing how pretty it made some charts. Intend to make a version 2 of this script with some added context to the EMA to give it a better looking 3D effect.

Fractal Adaptive Moving Averagewww.stockspotter.com
www.stockspotter.com
www.stockspotter.com
Here we measure the "fractal dimension" in order to differentiate periods of consolidation and trend. The trendline will run relatively flat during ranging price movement and quickly follow trending price action.

Fractal HelperA spinoff from a previous script I published, this configurable indicator also selects highs and lows and then plots a trend line that bounces between them. In addition, it also iterates this up to two more times in a quasi-fractal manner, on larger time scales, and plots them on the same graph.
Of course this will not spit out Elliott waves, but with adjusting, it could aid in discerning one wave from another.
I may experiment with the security function again to get a better, longer L3 plot, although charts are limited in duration anyway.
