MTF DPO-RSI IndicatorThis indicator uses the principle of taking the RSI of DPO readings across multiple time frames in order to provide trade signals and an overarching view of market conditions to the trader. My hope with creating this indicator was to present more divergence based signals than your typical indicator, while still keeping those signals at a high quality.
In the settings menu, you may specify:
Indicator Timeframe - the chart resolution that is used to calculate values.
Source DPO Length - the number of bars used to calculate the Detrended Price Oscillator value. The DPO value is the source for the RSI calculations.
DPO Hull Smoothing - how much smoothing is applied to the DPO . Smoothing is accomplished by taking a Hull Moving Average of the closing price, and using this to calculate the DPO value.
RSI Length - the number of bars used to calculate the RSI of the DPO value.
Time Multipliers 1 through 6 - use this to define what resolution each plot will represent. A value of 1 will represent the current Indicator Timeframe. A value of 3 will represent 3 times the current Indicator Timeframe, etc.
Show Plot 1 through 6 - toggles the display of plots.
How I trade with this indicator:
A value of under 30 represents an over sold state for that particular plot. A value of over 70 represents an overbought state for that plot.
Identify divergences on a lower timeframe plot which are apparent in overbought or oversold conditions, and confirm the signal with an overbought or oversold condition, or a divergence on a higher timeframe plot. Divergences which begin in oversold or overbought territory and end inside the 30-70 range tend to be more reliable signals, in my experience. Like all indicators, this is best when used in conjunction with other indicators. Trend indicators, such as double EMA's and Supertrend are my favorite pairing, and a stochastic RSI is a good tool to have as well.
This is my first published indicator! If you find unique ways to use it, drop me a message. I'd love to know what you find. :)
In den Scripts nach "Divergence" suchen

MACD including 6-period Forecast and Divergences█ OVERVIEW
This is my personal interpretation of the classic MACD Indicator. I am using the MACD as part of my analysis, and often I was wondering when I can expect the next signal (e.g. a Histogram cross). As I had come across some EMA forecast logics on tradingview, my goal was to use the EMA forecast calculation as basis to come to a complete MACD forecast. Here is the result.
Starting point is the classic MACD which is then plotted with MACD-Line, Signal Line and Histogram. In addition to the classic MACD, a 6 period Forecast for MACD, Signal and Histogram is available and divergences can be displayed on either the Histogram or the MACD Line.
Important:
As I am considering the closing price of the current candle as the basis for the calculation, the forecast values will REPAINT. But in my opinion this is fine as this indicator will not provide direct trading signals, but more an outlook into a potential future.
█ CALCULATION LOGIC
Below some details regarding the additional functionalities:
MACD Forecast:
The MACD Forecast is mainly based on a combination of EMA Forecasts. The inspiration for this basic forecast calculation is taken from the below tradingview members:
--> EMA Forecast input taken from "Triple MA Forecast" by yatrader2
--> Forecast Bias input taken from "Fancy Bollinger Bands" by BigBitsIO
When showing the forecast, the following options are available:
- Forecast Type: Determines if the Forecast is assuming a Flat price (last values of the MA calculation are replaced by current value) or if a Linear Regression is taken
- Number of candles taken for Linear Regression Calculation
- Bias of Forecast (Based on the recent Average True Range, the forecast values are either more bullish or more bearish calculated. "Neutral" turns off this function)
- Number of ATR Periods used to calculate Bias adjustment value
- Possibility to weight the Bias via a Multiplier - Default value is 1
Based on the above inputs, the forecasted values for MACD, Signal Line and Histogram are calculated and plotted for the next 6 periods.
Divergence Detection:
Based on the default tradingview divergence script with some adjustments:
- User can select to use either Histogram or MACD Line as basis for Divergence detection (Histogram by default)
- User can select if Divergence detection should be based on the candles including Wicks or only the Candle Bodies (Wicks by default)
█ DISCLAIMER
This is an experimental indicator and I do not know if my theory works in real life. So treat this not as financial advise, but purely for entertainment and educational purposes.
I publish this code open so that everyone can re-use it or hopefully even improve it.
Let me know if you have any ideas for improvement and if it is within my coding capabilities (which to be honest are quite limited), I will try to accomodate it.
Have fun.

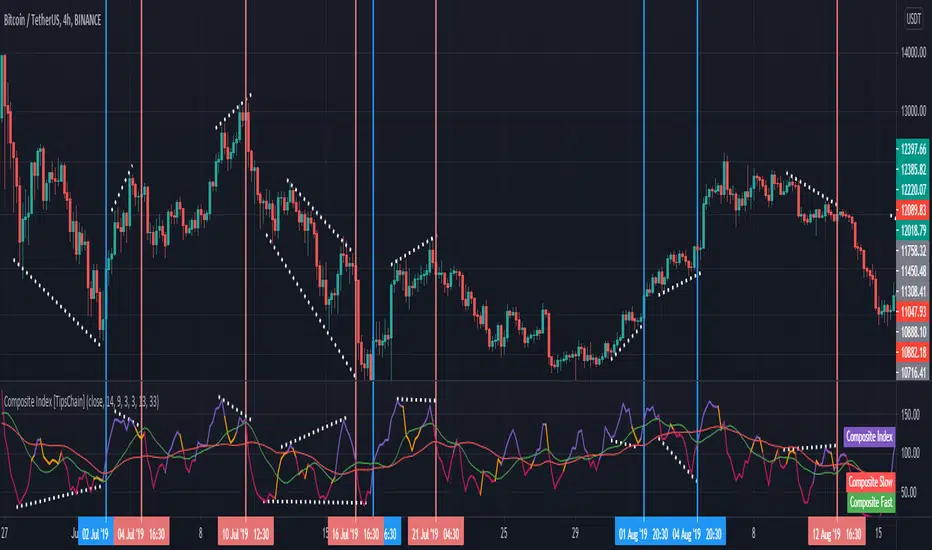
Composite Index [TipsChain]This is a formula Ms Brown developed to identify divergence failures with in the RSI . This also highlights the horizontal support levels with in the indicator area.
The Composite Index study comprises 2 momentum indicators on the RSI which are smoothed using a moving average. Control of the upper and lower indicators can be used to adjust the periods represented by each through the Object Properties dialog box for the study.
The Composite Index is an oscillator that will warn when the RSI is failing to detect a price trend reversal by forming divergences with the RSI. It can be used in any time frame or market.
Usage:
1. Check hidden and regular divergences on RSI+COMPOSITE_INDEX and PRICE+COMPOSITE_INDEX.
2. After finding divergence wait for COMPOSITE_INDEX to cross under/over it's moving averages to trigger.
RSI Divergence (Pine v4)Summary
Script highlights the divergences in RSI worth taking notice of. By comparing current envionment to relative sample we can see more than
the standard divergences that many catch through analysis. This framework aims to remove the bias or noise many see when looking for any supporting
evidence to their given emotion on a market.
Step-by-Step Walkthrough
Calculates RSI
Sets Divergence Framework
-------> a. Defining variable values, mandatory in Pine 4)
-------> b. Identify Divergences --> "If bar with lowest / highest is current bar, use it's value"
Compare high of current bar being examined with previous bar's high --> "If curr bar high is higher than the max bar high in the lookback window range"
Finds pivot point with at least 2 right candles with lower value
Finds pivot point with at least 2 right candles with lower value
Plot
Set Alerts
This RSI Script is intended for public use and can be shared / implemented as needed
Questions? I do not monitor my TradingView inbox. See email address in signature at the bottom of this page for contact information.

Bull Bear Divergence IndicatorFor Constance Brown-like analysis with divergence signals between price and indicator (i.e. stock close / RSI divergence)
Using two different lines: an indicator high line for bearish, and an indi low line for bullish divergences
For your individual studies, choose your indicator and replace rsi in line 10 with it, any thing else is auto. Script bottom: optional comparison linse addable
Note1: The script only shows divergences to recent pivots, not between actual pivot and one "a few pivots ago"
Note2: Though reversal predictions with the example of SPLK here are quite good, in general better results are obtained with un-normalized indicators.

Relative Strength Index, Divergences, color and more lines.Modified RSI technical indicator with divergences. Additional colors and more lines have been added.

Relative Strength Index - More Lines, Color and Divergence.Modified RSI technical indicator with divergences. Additional colors and more lines have been added.Enjoy.

RSI Divergence LiquidityRSI Divergence Liquidity is an indicator designed to help you catch high-probability BUY reversals by combining two powerful concepts:
OANDA:XAUUSD
Liquidity Sweep / Swing Low: automatically marks swing-low levels and tracks when price sweeps below them and reacts back.
Bullish RSI Divergence: filters noise by comparing RSI at the swing area versus RSI at the retest, favoring reversals with stronger momentum confirmation.
How it works
The script draws Swing Low lines using Pivot Lows. When a new Swing Low forms, the previous one is cut/frozen .
When price retests a Swing Low and the candle conditions are met (bar n bullish, bar n-1 bearish), the script checks:
Whether RSI at n/n-1 is higher than the RSI at the swing (bullish divergence logic)
Whether min RSI at the swing is below a threshold (default < 36) to focus on oversold swing areas
If all conditions pass, the indicator prints an upward triangle right when bar n closes → a potential BUY signal.
How to use
Enter BUY when an up triangle appears at/near the Swing Low (liquidity sweep zone).
Stop Loss idea: below the most recent swing low / below the sweep wick.
Take Profit idea: nearest supply zone, prior high, or fixed RR such as 1:2 / 1:3 depending on your system.
Recommended settings
Best on: M5–H1 (depending on your style), especially effective when price is trending down and performs a clear sweep.
For stricter filtering: lower Max minRSI at Swing (x) to only take signals from deeper RSI lows.
Smaller Pivot Lookback → more swings/signals; larger values → fewer but cleaner swings.
Note: This tool improves probability, not certainty. Combine it with market structure / key levels and proper risk management for best results.

Volume Weighted Price OscillatorThis indicator calculates the Percentage Price Oscillator (PPO), a momentum oscillator similar to the MACD. It displays the distance between two moving averages as a percentage, making it comparable across different assets. This implementation enhances the PPO with optional volume weighting and a built-in divergence engine.
Key Features:
Customizable MA & Volume Weighting: Both the fast and slow moving averages (and the signal line) can be customized using different MA types (e.g., EMA, SMA, WMA). An option (Volume weighted) applies volume weighting to all three MAs.
MACD-Style Display: Provides the three core components: the PPO line (momentum), a signal line (trigger), and a histogram (momentum acceleration). The histogram is color-coded to show increasing or decreasing momentum.
Full Divergence Suite (Class A, B, C): A built-in divergence engine automatically detects and plots all three major divergence classes between price and the PPO line:
Regular (A): Signals potential trend reversals.
Hidden (B): Signals potential trend continuations.
Exaggerated (C): Signals weakness at double tops/bottoms.
Divergence Filtering and Visualization:
Price Tolerance Filter: Divergence detection is enhanced with a percentage-based price tolerance (pivPrcTol) to filter out insignificant market noise.
Persistent Visualization: Divergence markers are plotted for the entire duration of the signal and are visually anchored to the PPO level of the confirming pivot.
Note on Confirmation (Lag): Divergence signals rely on a pivot confirmation method to ensure they do not repaint.
The Start of a- divergence is only detected after the confirming pivot is fully formed (a delay based on Pivot Right Bars).
The End of a divergence is detected either instantly (if the signal is invalidated by price action) or with a delay (when a new, non-divergent pivot is confirmed).
Multi-Timeframe (MTF) Capability:
MTF PPO Lines: The PPO, signal line, and histogram can be calculated on a higher timeframe, with standard options to handle gaps (Fill Gaps) and prevent repainting (Wait for...).
Limitation: The Divergence detection engine (pivDiv) is disabled if a timeframe other than the chart's timeframe is selected. Divergences are only calculated on the active chart timeframe.
Integrated Alerts: Includes 18 comprehensive alerts for:
The start and end of all 6 divergence types.
The PPO line crossing its signal line.
The PPO line crossing the zero line.
The histogram changing direction (reverting).
DISCLAIMER
For Informational/Educational Use Only: This indicator is provided for informational and educational purposes only. It does not constitute financial, investment, or trading advice, nor is it a recommendation to buy or sell any asset.
Use at Your Own Risk: All trading decisions you make based on the information or signals generated by this indicator are made solely at your own risk.
No Guarantee of Performance: Past performance is not an indicator of future results. The author makes no guarantee regarding the accuracy of the signals or future profitability.
No Liability: The author shall not be held liable for any financial losses or damages incurred directly or indirectly from the use of this indicator.
Signals Are Not Recommendations: The alerts and visual signals (e.g., crossovers) generated by this tool are not direct recommendations to buy or sell. They are technical observations for your own analysis and consideration.

Relative Distance to Moving AverageThis indicator calculates the Relative Distance to a Moving Average (RDMA), a momentum oscillator that measures how overextended a price is from its moving average baseline. It expresses this distance as a percentage, oscillating around a zero line. High positive values may indicate overbought conditions, while large negative values may suggest oversold conditions.
Key Features:
Customizable MA Baseline: The oscillator's baseline is a moving average. Users can select from a wide range of MA types (e.g., EMA, SMA, WMA) and apply volume weighting (Volume weighted) for enhanced responsiveness.
Normalization (Geometric Average): Includes an optional 'Normalize' mode. When enabled, the indicator uses a Geometric Moving Average (GMA) as its baseline and measures the percentage distance from this compound growth average, making it suitable for exponential markets.
Full Divergence Suite (Class A, B, C): The indicator's primary feature is its integrated divergence engine. It automatically detects and plots all three major divergence classes between price and the RDMA:
Regular (A): Signals potential trend exhaustion and reversals.
Hidden (B): Signals potential trend continuations during pullbacks.
Exaggerated (C): Signals weakness at double tops/bottoms.
Divergence Filtering and Visualization:
Price Tolerance Filter: Divergence detection is enhanced with a percentage-based price tolerance (pivPrcTol) to filter out insignificant market noise.
Persistent Visualization: Divergence markers are plotted for the entire duration of the signal and are visually anchored to the RDMA level of the confirming pivot.
Note on Confirmation (Lag): Divergence signals rely on a pivot confirmation method to ensure they do not repaint.
The Start of a- divergence is only detected after the confirming pivot is fully formed (a delay based on Pivot Right Bars).
The End of a divergence is detected either instantly (if the signal is invalidated by price action) or with a delay (when a new, non-divergent pivot is confirmed).
Multi-Timeframe (MTF) Capability:
MTF RDMA Line: The RDMA oscillator itself can be calculated on a higher timeframe, with standard options to handle gaps (Fill Gaps) and prevent repainting (Wait for...).
Limitation: The Divergence detection engine (pivDiv) is disabled if a timeframe other than the chart's timeframe is selected. Divergences are only calculated on the active chart timeframe.
Integrated Alerts: Includes 14 comprehensive alerts for:
The start and end of all 6 divergence types.
The RDMA oscillator crossing the zero line.
DISCLAIMER
For Informational/Educational Use Only: This indicator is provided for informational and educational purposes only. It does not constitute financial, investment, or trading advice, nor is it a recommendation to buy or sell any asset.
Use at Your Own Risk: All trading decisions you make based on the information or signals generated by this indicator are made solely at your own risk.
No Guarantee of Performance: Past performance is not an indicator of future results. The author makes no guarantee regarding the accuracy of the signals or future profitability.
No Liability: The author shall not be held liable for any financial losses or damages incurred directly or indirectly from the use of this indicator.
Signals Are Not Recommendations: The alerts and visual signals (e.g., crossovers) generated by this tool are not direct recommendations to buy or sell. They are technical observations for your own analysis and consideration.

MACD (classic) + Divergences (wicks & bodies, fast/slow)macd with divergences. Wicks + bodies. Two settings for right bar

Volume-Price Divergence Indicator V3Description:
This indicator helps you identify volume-price divergences and potential trend weakness across any specified timeframe.
Features:
Volume bars with moving average – green for bullish, red for bearish, with orange SMA to detect low-volume situations.
Custom OBV calculation with divergence detection – highlights when price makes new highs/lows but OBV does not.
VWAP deviation alerts – signals when price moves far from VWAP while volume remains low, indicating potential fake breakouts.
Fully configurable – select any reference timeframe, adjust volume MA, OBV period, and VWAP deviation threshold.
Visual markers – easily spot bullish/bearish divergences and volume-price mismatches directly on your chart.
Use case:
Spot early trend exhaustion points.
Identify fake breakouts or weak rallies/drops.
Combine with your existing trading strategy for more informed entries and exits.
Volume-Price Divergence Indicator V2Description:
This indicator helps you identify volume-price divergences and potential trend weakness across any specified timeframe.
Features:
Volume bars with moving average – green for bullish, red for bearish, with orange SMA to detect low-volume situations.
Custom OBV calculation with divergence detection – highlights when price makes new highs/lows but OBV does not.
VWAP deviation alerts – signals when price moves far from VWAP while volume remains low, indicating potential fake breakouts.
Fully configurable – select any reference timeframe, adjust volume MA, OBV period, and VWAP deviation threshold.
Visual markers – easily spot bullish/bearish divergences and volume-price mismatches directly on your chart.
Use case:
Spot early trend exhaustion points.
Identify fake breakouts or weak rallies/drops.
Combine with your existing trading strategy for more informed entries and exits.
Volume-Price Divergence Indicator (OBV + VWAP, Multi-Timeframe)Description:
This indicator helps you identify volume-price divergences and potential trend weakness across any specified timeframe.
Features:
Volume bars with moving average – green for bullish, red for bearish, with orange SMA to detect low-volume situations.
Custom OBV calculation with divergence detection – highlights when price makes new highs/lows but OBV does not.
VWAP deviation alerts – signals when price moves far from VWAP while volume remains low, indicating potential fake breakouts.
Fully configurable – select any reference timeframe, adjust volume MA, OBV period, and VWAP deviation threshold.
Visual markers – easily spot bullish/bearish divergences and volume-price mismatches directly on your chart.
Use case:
Spot early trend exhaustion points.
Identify fake breakouts or weak rallies/drops.
Combine with your existing trading strategy for more informed entries and exits.
Apex Edge - RSI Trend LinesThe Apex Edge - RSI Trend Lines indicator is a precision tool that automatically draws real-time trendlines on the RSI oscillator using confirmed pivot highs and lows. These dynamic trendlines track RSI structure in motion, helping you anticipate breakout zones, reversals, and hidden divergences.
Every time a new pivot forms, the indicator automatically re-draws the RSI trendline between the two most recent pivots — giving you an always-current view of momentum structure. You’ll instantly see when RSI begins compressing or expanding, long before price reacts.
Key Features: • Dynamic RSI trendlines drawn from the last 2 pivots
• Auto re-draws in real-time as new pivots form
• Optional "Full Extend" or "Pivot Only" modes
• Slope color-coded: green = support, red = resistance
• Built-in dotted RSI levels (30/70 default)
• Alert conditions for RSI trendline breakout signals
• Ideal for spotting divergence, compression, and early SMC confluence
This is not your average RSI — it’s a fully reactive momentum edge overlay designed to give you clarity, structure, and timing from within the oscillator itself. Perfect for traders using Smart Money Concepts, divergence setups, or algorithmic trend tracking.
⚔️ Built for precision. Built for edge. Built for Apex.

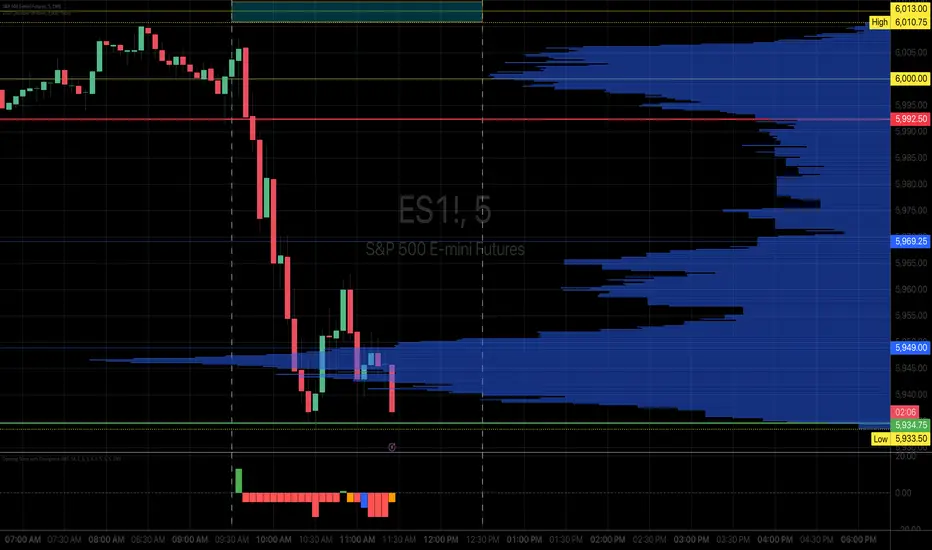
Opening Score with DivergenceOverview
The Opening Score Indicator is a versatile tool designed to help traders assess market sentiment, trend direction, and potential reversals. By combining Opening Range Breakout (ORB), VWAP, Trend, Volatility, and Divergence Detection, this indicator provides a composite score that adapts to different market conditions.
This version includes divergence detection between the Opening Score and price, which highlights potential trend reversals or continuations before they happen. When a regular divergence occurs, the histogram bar turns orange, signaling an increased probability of a trend change.
Best for Both Intraday & Longer-Term Charts
📊 Optimized for intraday trading → Works well on 1m to 30m timeframes for short-term strategies.
📈 Also effective on longer-term charts → Can be used on 1-hour, 4-hour, daily, or weekly charts to identify macro trends and momentum shifts.
🕰️ Adapts to different market conditions → Whether you’re a day trader, swing trader, or position trader, the Opening Score helps you track trend health and reversals.
How It Works
📊 Composite Opening Score Calculation
• ORB Signal → Detects bullish/bearish breakouts based on the opening range.
• VWAP Signal → Measures price positioning relative to VWAP for trend confirmation.
• Trend Signal → Uses a moving average to determine market direction.
• Volatility Signal → Tracks ATR changes to assess market strength.
• Divergence Detection → Identifies regular and hidden divergences for potential reversals or trend continuation.
🔹 Reversal Alerts with Color-Coded Histogram
• Green Bars → Normal bullish Opening Score.
• Red Bars → Normal bearish Opening Score.
• Orange Bars → Warning! Regular Divergence detected → Possible trend reversal.
🔹 Hidden & Regular Divergence Detection
• Regular Divergence (Reversal Signals)
• 📉 Bearish Regular Divergence → Price makes a Higher High, but Opening Score makes a Lower High → 🔻 Possible Downtrend Reversal.
• 📈 Bullish Regular Divergence → Price makes a Lower Low, but Opening Score makes a Higher Low → 🔼 Possible Uptrend Reversal.
• Hidden Divergence (Trend Continuation Signals)
• 📉 Bearish Hidden Divergence → Price makes a Lower High, but Opening Score makes a Higher High → 🔻 Trend Likely to Continue Down.
• 📈 Bullish Hidden Divergence → Price makes a Higher Low, but Opening Score makes a Lower Low → 🔼 Trend Likely to Continue Up.
How to Use It
✅ Watch for Reversal Alerts (Orange Bars) → These highlight potential market turning points.
✅ Use the Zero Line as a Trend Filter → A score above 0 suggests bullish conditions, while below 0 signals bearish conditions.
✅ Combine with Market Structure & Volume Profile → Works well when paired with support/resistance levels, liquidity zones, and order flow data.
✅ Adjust settings based on timeframe → Increase moving average length & lookback periods for longer-term analysis.
Why Use This Indicator?
🚀 Works for both short-term and long-term traders → Adapts to intraday and higher timeframes.
📊 Multi-Factor Analysis → Combines multiple key market indicators for better accuracy.
🎯 Customizable Weighting → Adjust the influence of each signal to suit your trading style.
✅ No Clutter – Only the Opening Score is plotted → Keeps your chart clean & efficient.
🔔 Recommended for Intraday Trading (1m – 30m) AND Longer-Term Analysis (1H – Weekly) → Use this indicator to enhance your trend detection & reversal strategy! 🚀
MegaGas Bollinger Bands with Divergence and Circle SignalsIndicator: MegaGas Bollinger Bands with Divergence and Circle Signals
This script provides a powerful combination of Bollinger Bands, RSI Divergence detection, and signal visualization tools. Designed with flexibility and precision in mind, it aims to assist traders in identifying trend reversals, volatility zones, and divergence-based trading opportunities. The script is well-suited for swing trading, momentum trading, and even scalping when adapted to lower timeframes.
How It Works:
Bollinger Bands:
Bollinger Bands are used to detect price volatility and overbought/oversold conditions. The script calculates:
Basis Line: A 34-period Simple Moving Average (SMA) as the core trend line.
Upper Bands: Bands positioned 1x and 2x the standard deviation above the SMA.
Lower Bands: Bands positioned 1x and 2x the standard deviation below the SMA. These levels provide dynamic support and resistance zones, highlighting breakout and reversion opportunities.
RSI Divergence Detection:
The indicator detects bullish divergence (when RSI forms a higher low while price forms a lower low) and bearish divergence (when RSI forms a lower high while price forms a higher high). These divergences often precede significant reversals or momentum shifts.
Bullish divergence is displayed with blue triangles (up).
Bearish divergence is displayed with orange triangles (down).
Buy and Sell Signals:
Circle Signals are generated when price crosses key Bollinger Bands levels:
A green circle appears when the price crosses above the lower band (potential buy signal).
A red circle appears when the price crosses below the upper band (potential sell signal).
These signals help identify potential entry and exit points for trades, particularly in trend-following or mean-reversion strategies.
Trend Reference (Moving Average):
A 50-period Simple Moving Average (SMA) is included as a trend reference, helping traders gauge the overall market direction. Use this to confirm divergence signals and avoid trades against the prevailing trend.
Why This Indicator Is Unique:
This script integrates multiple tools in a meaningful way, emphasizing contextual trading signals. Unlike standalone Bollinger Bands or RSI indicators, it introduces:
Advanced Divergence Analysis: Enhancing traditional RSI with divergence-based alerts.
Dynamic Signal Filtering: Preventing repetitive signals by introducing state-based logic for circles and divergence signals.
Trend Alignment: Combining Bollinger Bands with an SMA to filter trades based on the prevailing trend.
How to Use:
Setup:
Apply the indicator to any chart and timeframe. For swing trading, higher timeframes like 4H or 1D are recommended.
Adjust the RSI, Bollinger Bands, and Moving Average lengths to match your strategy and asset.
Signals:
Look for divergence signals (triangles) as early warnings of trend reversals. Confirm these with price action or other tools.
Use circle signals (green/red) to time potential entries/exits around Bollinger Band extremes.
Confirmation:
Combine divergence and circle signals with the SMA line to avoid counter-trend trades. For example, take bullish signals when the price is above the SMA and bearish signals when it is below.
Chart Clarity:
The script is published with a clean chart for clarity. It visualizes all signals with distinct shapes (triangles and circles) and colors, ensuring they are easily recognizable. Bollinger Bands and the SMA are plotted with transparency to avoid clutter.
Originality:
This script is a thoughtful blend of Bollinger Bands and RSI divergence detection, carefully designed to provide traders with actionable insights. It introduces state-based logic to manage repetitive signals and seamlessly integrates trend filtering, making it a valuable tool for both novice and experienced traders.

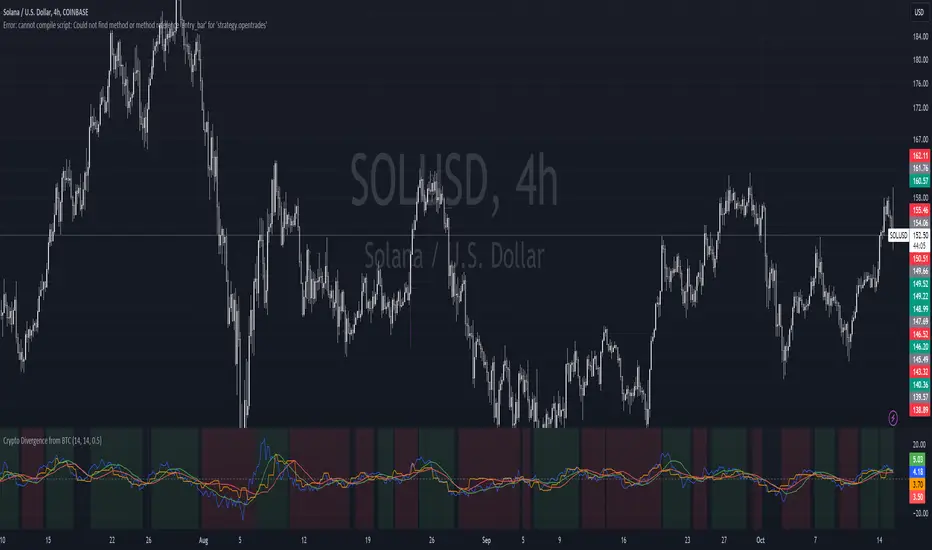
Crypto Divergence from BTCThis script is used to indicate when price action of a crypto coin is diverging significantly from that of BTC.
Explanation of the Script:
Inputs:
roc_length: The period used for calculating the Rate of Change.
ma_length: The period used for the moving average of the ROC.
threshold: The percentage difference that indicates a divergence.
Price Data:
The script retrieves the current asset's price and Bitcoin's price.
ROC Calculation:
The ROC for both the current asset and BTC is calculated based on the defined roc_length.
Moving Averages:
Simple moving averages (SMA) of the ROC values are calculated to smooth out the data.
Divergence Detection:
The indicator checks if the current asset's ROC MA is significantly higher or lower than Bitcoin's ROC MA based on the specified threshold.
Plotting:
The script plots the ROC values and their moving averages.
It also highlights the background in green when a bullish divergence is detected (when the asset is moving up while BTC is lagging) and in red for a bearish divergence.
BTC x M2 Divergence (Weekly)### Why the "M2 Money Supply vs BTC Divergence with Normalized RSI" Indicator Should Work
IMPORTANT
- Weekly only indicator
- Combine it with BTC Halving Cycle Profit for better results
The "M2 Money Supply vs BTC Divergence with Normalized RSI" indicator leverages the relationship between macroeconomic factors (M2 money supply) and Bitcoin price movements, combined with technical analysis tools like RSI, to provide actionable trading signals. Here's a detailed rationale on why this indicator should be effective:
1. **Macroeconomic Influence**:
- **M2 Money Supply**: Represents the total money supply, including cash, checking deposits, and easily convertible near money. Changes in M2 reflect liquidity in the economy, which can influence asset prices, including Bitcoin.
- **Bitcoin Sensitivity to Liquidity**: Bitcoin, being a digital asset, often reacts to changes in liquidity conditions. An increase in money supply can lead to higher asset prices as more money chases fewer assets, while a decrease can signal tightening conditions and lower prices.
2. **Divergence Analysis**:
- **Economic Divergence**: The indicator calculates the divergence between the percentage changes in M2 and Bitcoin prices. This divergence can highlight discrepancies between Bitcoin's price movements and broader economic conditions.
- **Market Inefficiencies**: Large divergences may indicate inefficiencies or imbalances that could lead to price corrections or trends. For example, if M2 is increasing (indicating more liquidity) but Bitcoin is not rising proportionately, it might suggest a potential upward correction in Bitcoin's price.
3. **Normalization and Smoothing**:
- **Normalized Divergence**: Normalizing the divergence to a consistent scale (-100 to 100) allows for easier comparison and interpretation over time, making the signals more robust.
- **Smoothing with EMA**: Applying Exponential Moving Averages (EMAs) to the normalized divergence helps to reduce noise and identify the underlying trend more clearly. This double-smoothed divergence provides a clearer signal by filtering out short-term volatility.
4. **RSI Integration**:
- **RSI as a Momentum Indicator**: RSI measures the speed and change of price movements, indicating overbought or oversold conditions. Normalizing the RSI and incorporating it into the divergence analysis helps to confirm the strength of the signals.
- **Combining Divergence with RSI**: By using RSI in conjunction with divergence, the indicator gains an additional layer of confirmation. For instance, a bullish divergence combined with an oversold RSI can be a strong buy signal.
5. **Dynamic Zones and Sensitivity**:
- **Good DCA Zones**: Highlighting zones where the divergence is significantly positive (good DCA zones) indicates periods where Bitcoin might be undervalued relative to economic conditions, suggesting good buying opportunities.
- **Red Zones**: Marking zones with extremely negative divergence, combined with RSI confirmation, identifies potential market tops or bearish conditions. This helps traders avoid buying into overbought markets or consider selling.
- **Peak Detection**: The sensitivity setting for detecting upside down peaks allows for early identification of potential market bottoms, providing timely entry points for traders.
6. **Visual Cues and Alerts**:
- **Clear Visualization**: The plots and background colors provide immediate visual feedback, making it easier for traders to spot significant conditions without deep analysis.
- **Alerts**: Built-in alerts for key conditions (good DCA zones, red zones, sell signals) ensure traders can act promptly based on the indicator's signals, enhancing the practicality of the tool.
### Conclusion
The "M2 Money Supply vs BTC Divergence with Normalized RSI" indicator integrates macroeconomic data with technical analysis to offer a comprehensive view of Bitcoin's market conditions. By analyzing the divergence between M2 money supply and Bitcoin prices, normalizing and smoothing the data, and incorporating RSI for momentum confirmation, the indicator provides robust signals for identifying potential buying and selling opportunities. This holistic approach increases the likelihood of capturing significant market movements and making informed trading decisions.

RSI MTF [Market Yogi]The Multi-Time Frame RSI with Money Flow Index and Average is a powerful trading indicator designed to help traders identify overbought and oversold conditions across multiple time frames. It combines the Relative Strength Index (RSI) with the Money Flow Index (MFI) and provides an average value for better accuracy.
The Relative Strength Index (RSI) is a popular momentum oscillator that measures the speed and change of price movements. It oscillates between 0 and 100 and is used to identify overbought and oversold conditions in an asset. By incorporating the RSI across multiple time frames, this indicator offers a broader perspective on market sentiment.
In addition to the RSI, this indicator also includes the Money Flow Index (MFI). The MFI is a volume-based oscillator that measures the inflow and outflow of money into an asset. It takes into account both price and volume, providing insights into the strength and direction of buying and selling pressure.
By combining the RSI and MFI across multiple time frames, traders gain a comprehensive understanding of market dynamics. The indicator allows for comparing the RSI and MFI values across different time frames, enabling traders to identify divergences and potential trend reversals.
Furthermore, this indicator provides an average value of the multi-time frame RSI, offering a consolidated signal that helps filter out noise and enhance the accuracy of trading decisions.
Key Features:
1. Multi-Time Frame RSI: Combines the RSI across different time frames to provide a comprehensive view of market sentiment.
2. Money Flow Index (MFI): Incorporates the MFI to gauge buying and selling pressure based on both price and volume.
3. Average Calculation: Computes the average value of the multi-time frame RSI to generate a consolidated trading signal.
4. Divergence Detection: Enables traders to spot divergences between the RSI and MFI values, indicating potential trend reversals.
5. Overbought and Oversold Levels: Highlights overbought and oversold levels on the RSI, aiding in timing entry and exit points.
The Multi-Time Frame RSI with Money Flow Index and Average is a versatile tool that can be applied to various trading strategies, including trend following, swing trading, and mean reversion. Traders can adjust the time frame settings to suit their preferences and trading style.
Note: It's important to use this indicator in conjunction with other technical analysis tools and indicators to validate signals and make informed trading decisions.

RSI Divergence Strategywhat is "RSI Divergence Strategy"?
it is a RSI strategy based this indicator:
what it does?
it gives buy or sell signals according to RSI Divergences. it also has different variables such as "take profit", "stop loss" and trailing stop loss.
how it does it?
it uses the "RSI Divergence" indicator to give signal. For detailed information on how it works, you can visit the link above. The quantity of the inputs is proportional to the rsi values. Long trades are directly traded with "RSI" value, while short poses are traded with "100-RSI" value.
How to use it?
The default settings are for scalp strategy but can be used for any type of trading strategy. you can develop different strategies by changing the sections. It is quite simple to use.
RSI length is length of RSİ
source is source of RSİ
RSİ Divergence lenght is length of line on the RSI
The "take profit", "stop" and "trailing stop" parts used in the "buy" group only affect buys. The "sell" group is similarly independent of the variables in the "buy" group.
The "zoom" section is used to enlarge or reduce the indicator. it only changes the appearance, it does not affect the results of the strategy.

Wavetrend in Dynamic Zones with Kumo Implied VolatilityI was asked to do one of those, so here we go...
As always free and open source as it should be. Do not pay for such indicators!
A WaveTrend Indicator or also widely known as "Market Cipher" is an Indicator that is based on Moving Averages, therefore its an "lagging indicator". Lagging indicators are best used in combination with leading indicators. In this script the "leading indicator" component are Daily, Weekly or Monthly Pivots . These Pivots can be used as dynamic Support and Resistance , Stoploss, Take Profit etc.
This indicator combination is best used in larger timeframes. For lower timeframes you might need to change settings to your liking.
The general Wavetrend settings are the same that are used in Market Cipher, Market Liberator and such popular indicators.
What are these circles?
-These are the WaveTrend Divergences. Red for Regular-Bearish. Orange for Hidden-Bearish. Green for Regular-Bullish. Aqua for Hidden-Bullish.
What are these white, orange and aqua triangles?
-These are the WaveTrend Pivots. A Pivot counter was added. Every time a pivot is lower than the previous one, an orange triangle is printed, every time a pivot is higher than the previous one an aqua triangle is printed. That mimics a very common way Wavetrend is being used for trading when using those other paid Wavetrend indicators.
What are these Orange and Aqua Zones?
-These are Dynamic Zones based on the indicator itself, they offer more information than static zones. Of course static lines are also included and can be adjusted.
What are the lines between the waves?
-This is a Kumo Cloud Implied Volatility indicator. It is color coded and can be used to indicate if a major market move/bottom/top happened.
What are those numbers on the right?
-The first number is a Bollinger Band indicator that shows if said Bollinger Band is in a state of Oversold/Overbought, the second number is the actual Bollinger Band Width that indicates if the Bollinger Band squeezes, normally that happens right before the market makes an explosive move.
Please keep in mind that this indicator is a tool and not a strategy, do not blindly trade signals, do your own research first! Use this indicator in conjunction with other indicators to get multiple confirmations.

PivotsLibrary "Pivots"
This Library focuses in functions related to pivot highs and lows and some of their applications (i.e. divergences, zigzag, harmonics, support and resistance...)
pivots(srcH, srcL, length) Delivers series of pivot highs, lows and zigzag.
Parameters:
srcH : Source series to look for pivot highs. Stricter applications might source from 'close' prices. Oscillators are also another possible source to look for pivot highs and lows. By default 'high'
srcL : Source series to look for pivot lows. By default 'low'
length : This value represents the minimum number of candles between pivots. The lower the number, the more detailed the pivot profile. The higher the number, the more relevant the pivots. By default 10
Returns:
zigzagArray(pivotHigh, pivotLow) Delivers a Zigzag series based on alternating pivots. Ocasionally this line could paint a few consecutive lows or highs without alternating. That happens because it's finding a few consecutive Higher Highs or Lower Lows. If to use lines entities instead of series, that could be easily avoided. But in this one, I'm more interested outputting series rather than painting/deleting line entities.
Parameters:
pivotHigh : Pivot high series
pivotLow : Pivot low series
Returns:
zigzagLine(srcH, srcL, colorLine, widthLine) Delivers a Zigzag based on line entities.
Parameters:
srcH : Source series to look for pivot highs. Stricter applications might source from 'close' prices. Oscillators are also another possible source to look for pivot highs and lows. By default 'high'
srcL : Source series to look for pivot lows. By default 'low'
colorLine : Color of the Zigzag Line. By default Fuchsia
widthLine : Width of the Zigzag Line. By default 4
Returns: Zigzag printed on screen
divergence(h2, l2, h1, l1, length) Calculates divergences between 2 series
Parameters:
h2 : Series in which to locate divs: Highs
l2 : Series in which to locate divs: Lows
h1 : Series in which to locate pivots: Highs. By default high
l1 : Series in which to locate pivots: Lows. By default low
length : Length used to calculate Pivots: By default 10
Returns:
