Edufx AMD~Accumulation, Manipulation, DistributionEdufx AMD Indicator
This indicator visualizes the market cycles using distinct phases: Accumulation, Manipulation, Distribution, and Reversal. It is designed to assist traders in identifying potential entry points and understanding price behavior during these phases.
Key Features:
1. Phases and Logic:
-Accumulation Phase: Highlights the price range where market accumulation occurs.
-Manipulation Phase:
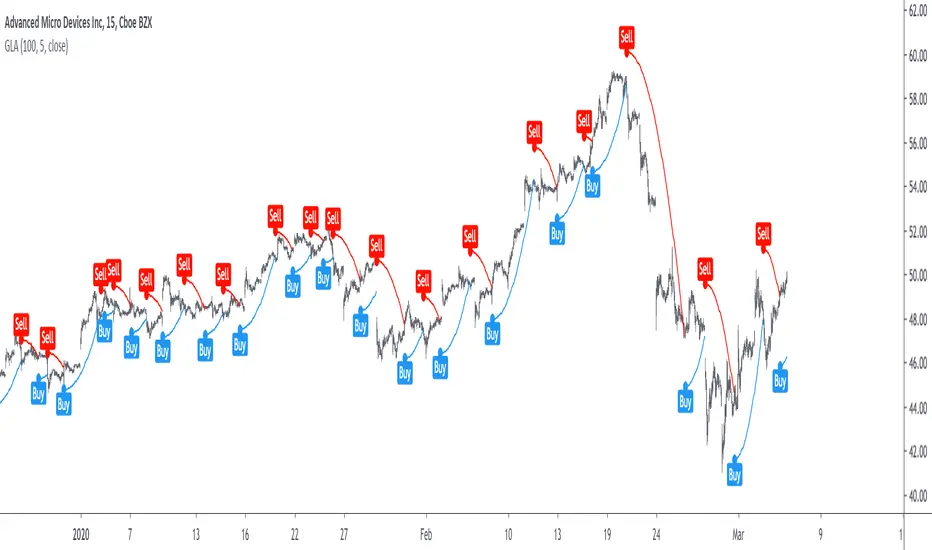
- If the price sweeps below the accumulation low, it signals a potential "Buy Zone."
- If the price sweeps above the accumulation high, it signals a potential "Sell Zone."
-Distribution Phase: Highlights where price is expected to expand and establish trends.
-Reversal Phase: Marks areas where the price may either continue or reverse.
2. Weekly and Daily Cycles:
- Toggle the visibility of Weekly Cycles and Daily Cycles independently through the settings.
- These cycles are predefined with precise timings for each phase, based on your selected on UTC-5 timezone.
3. Customizable Appearance:
- Adjust the colors for each phase directly in the settings to suit your preferences.
- The indicator uses semi-transparent boxes to represent the phases, allowing easy visualization without obstructing the chart.
4. Static Boxes:
- Boxes representing the phases are drawn only once for the visible chart range and do not dynamically delete, ensuring important consistent reference points.
Pine Script® Indikator