In den Scripts nach "BTC" suchen
BTC Volume Index [v2018-11-21] @ LekkerCryptisch.nlIndicates the volume trend:
~50 = short term volume is the same as long term volume
> 50 = short term volume is higher than long term volume (i.e. trend is rising volume)
< 50 = short term volume is lower than long term volume (i.e. trend is declining volume)

BTC Volume Lines [v2018-11-17] @ LekkerCryptisch.nlCombine the volume of 8 BTCUSD exchanges in one graph.
Three use cases:
1) See the absolute volumes in one graph
2) See the relative volumes in one graph
3) See the deviation of the EMA the volumes in one graph
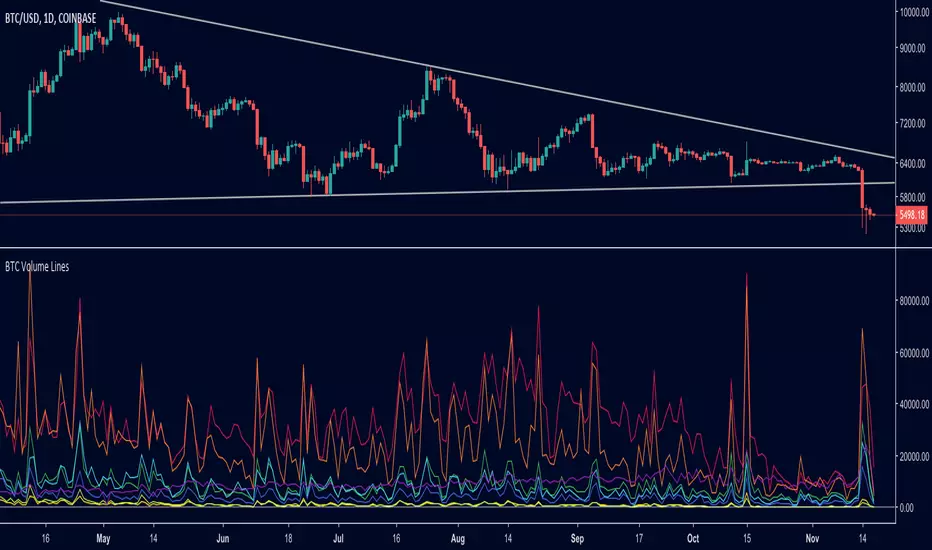
BTC Combined VolumeI edited an existing script to include Bitmex volume. I'm no expert at this but I hope it works!
Cheers,
G

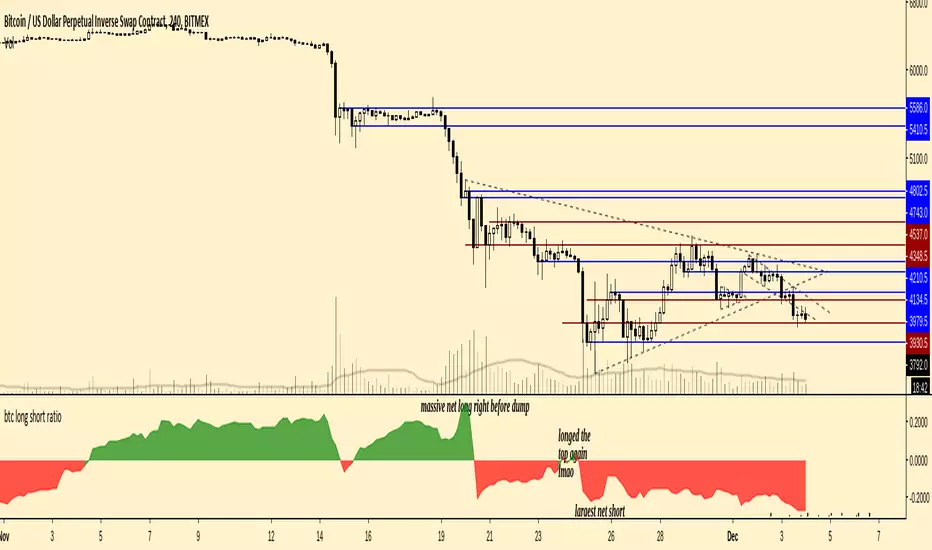
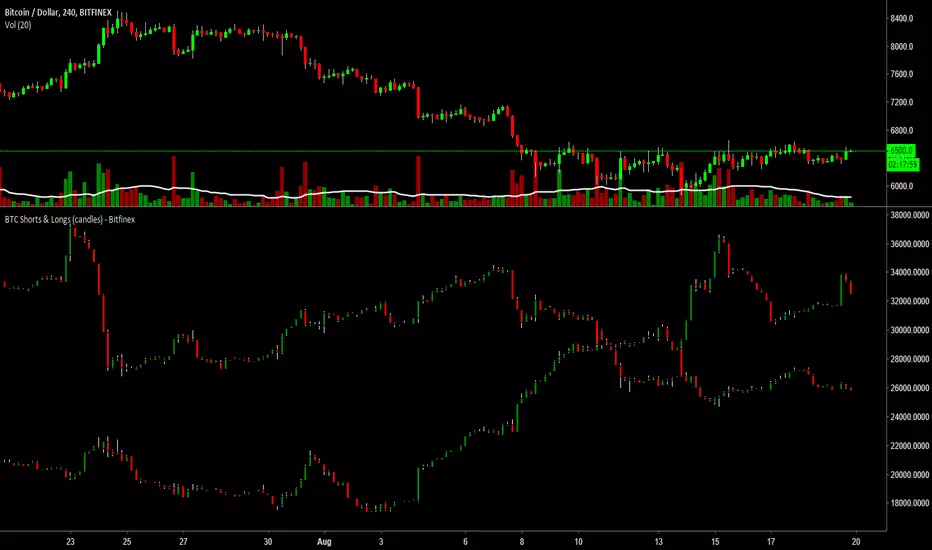
BTC longs n' shortsA indicator that neatly shows you BitFinex margin longs and shorts that can be put on any chart!

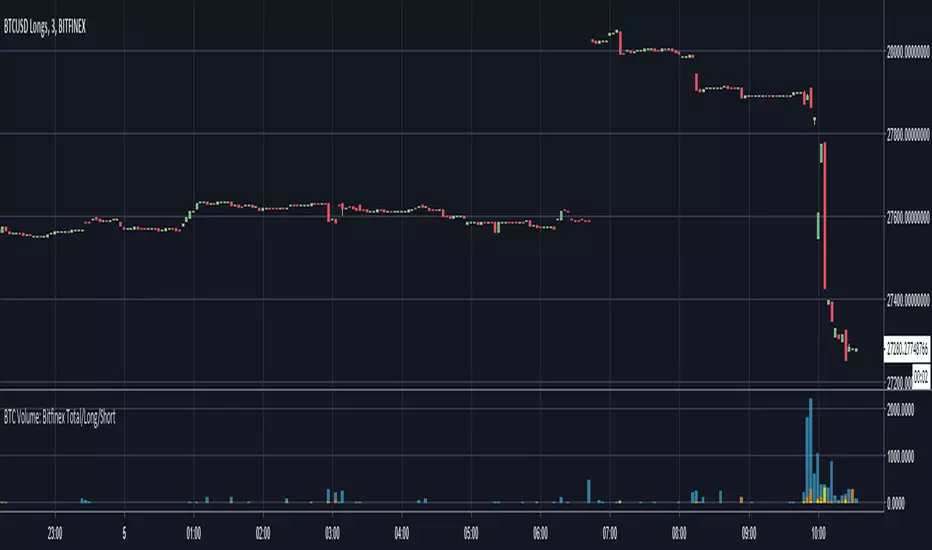
BTC Volume: Bitfinex Total/Long/ShortQuick little script to show Bitfinex LONG/SHORT positions in context to overall volume on the TF. Works best on small TFs to eliminate fluctuation in margin positions impacting the 'accuracy' of volume.
Base Color Scheme
Blue: Total Bitfinex traded volume
Yellow: Assumed Volume of BTCUSDLONGS (Close Position - Open Position)
Orange: Assumed Volume of BTCUSDSHORTS (Close Position - Open Position)
Work is based on conversations and community interaction through Crypto Traders Pro.
BTC Turn Over Rate (Multi-Exchange) [v2018-08-22]Turnover rate is used to judge the period when the main chip is concentrated and dispersed.
BTC Shorts & Longs (candles) - BitfinexBTCUSDLONGS and BTCUSDSHORTS indicator people like to use but I combined them into one chart/indicator to make them easier to see how the longs or shorts may be building.
Please give it a like if you use or enjoy the indicator.


BTC SpreadThis Indicator shows you the BTCUSD Price Spread based on following Exchanges:
Bitfinex
Bitmex
Coinbase
Bitstamp
Poloniex
Binance
Select your Main Exchange in the Settings.
The Price Average of all Exchanges is subtracted from your selected Exchange. If the Price is lower/higher the Color of the Line changes.
The Background Steplines show the Price of each Exchange subtracted from your selection.

BTC Prices (BFX,BITS,CB,BINANCE)Minimal price tracker. Publishing just in case it deletes itself two times. Haha.
Color coded. It will be easy to add other exchanges if need be.

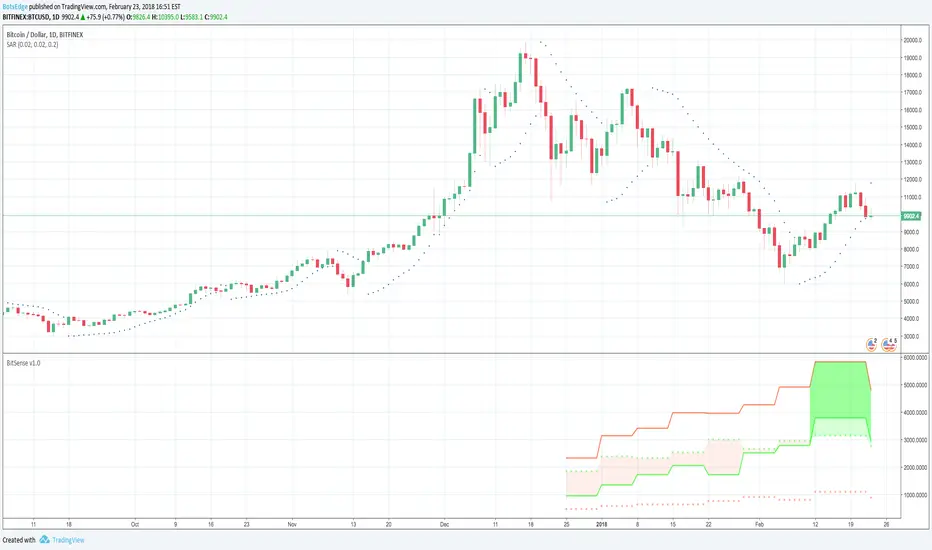
BTC-USD Commitment of Traders Bitsense v1.0INDICATOR EXPLANATION
The main data from the COT report is plotted using 4 lines. These are
The solid red line shows the commercial short (hedge) positions
The solid green line shows the commercial long positions
The dotted red line shows the non commercial short (not hedging) positions
The dotted green line shows the non commercial long positions
The shaded areas show the long and short situation in the bitcoin market as weak and strong
The lighter the color, the weaker the market is. So for example for Jan 2018 the first full month with the new futures we see a light red color between the commercial (solid green) and the noncommercial (dotted green) positioning line. This means that the market is weakening but on a longer timeframe still on an upward move. So this is a possible launchzone for any short trade but it is weak
The darker the color, the stronger the market. So for example in the middle of Feb 2018 we see a bigger area with different shades of green. There is a light green color shown between the commercial long (solid green) and the non commercial long (dotted green) line and a darker green color between the commercial long (solid green) and the commercial short (solid red) line. So this is a possible and strong launchzone for a long trade in bitcoin
HOW TO USE
Whenever Bitsense shows a light shaded colored area, that area then can be used as a launchzone for trades in the direction of the market but one needs to know that the light colors represent weak market conditions. So a light shaded red area represents a possible launchzone for a short trade but it is a very weak short market (no matter how many points the market moves in that direction it is still a weak condition)
Whenever Bitsense shows a darker shaded colored area, that area then can be used as a launchzone for trades in the direction of the market. The same goes for areas where light and darker shaded areas are together. These represent strong market conditions
As can be seen (mid feb 2018), even though the commercial shorts stay on top, Bitsense shows a strong long situation and the market starts rising. The COT report is different from traditional indicators and Bitsense shows this clearly. To explain, both of the dotted lines show the non commercial positions either long or short. These positions are traded in the direction of their color, so if the non commercial dotted green line stays on top of the non commercial red dotted line there are more long positions on bitcoin futures out there than there are short positions. But this is not that easy with the commercial positions. These are usually hedging positions which means a high commercial solid red line represents the commercial traders hedging a market that they think i a) high and b) can rise more, so they sell short positions to lock in gains from the market position, whereas solid green line commercial positions start rising only when markets are low because these traders usually lock in cheap market prices with buying long positions
Since there is just a very short accumulation of data since the inception of both bitcoin futures the indicator still might not work correctly and you have to be very careful in using it. It is published here as an information tool only and should not be used for any real trading without other means of information about the market
By using this indicator you acknowledge that you have read and understood that this is for research purposes only and I am not responsible for any financial losses you may incur by using this indicator. All trading involves high risk and past performance is not necessarily an indication of future results
BTC Approximation (BETI) - Bitcoin Exponential Trend//based on
//https://www.wolframalpha.com/input/?i=e+%5E+(+0.00331836433279664++(+number+of+seconds+since+jul+17,+2010+12pm+UTC%2F86400%2Fseconds+)+-0.120774828196607+)
//https://bitcointalk.org/index.php?topic=470453.680
BTC Price Spread - Coinbase & Futs - Premiums & DiscountsThis indicator takes the price of Bitcoin on Coinbase and the futures price on Mex, and compares it the average price of Bitcoin across other major exchanges.
This essentials give us a spread at which Bitcoin is going for.
In turn, this could be a possible tool to help determine market sentiment.
This indicator was created for experimental purposes.
Use at your own digression.

BTC Futures Settlement DatesShows the CBOE and CME settlement dates as horizontal lines, with the option to show a 7 day warning in the background. This should hopefully give ample warning.
I intend to update the script as new dates become available but please PM if I've forgotten.

BTC: CME Futures vs. Exchange SpreadsAs you can see, this script plots the current (10-min. delayed) CME Futures price versus Bitfinex, Bitstamp, and Coinbase prices.
It's displayed here on a 30 minute view because at the time of writing the futures have been alive for approximately one day. The script will likely be more useful on longer time frames as a macro-level indicator.
It's pretty simple to adapt this to additional exchanges
