Multi SMA EMA WMA HMA BB (5x8 MAs Bollinger Bands) MAX MTF - RRBMulti SMA EMA WMA HMA 4x7 Moving Averages with Bollinger Bands MAX MTF by RagingRocketBull 2019
Version 1.0
All available MAX MTF versions are listed below (They are very similar and I don't want to publish them as separate indicators):
ver 1.0: 4x7 = 28 MTF MAs + 28 Levels + 3 BB = 59 < 64
ver 2.0: 5x6 = 30 MTF MAs + 30 Levels + 3 BB = 63 < 64
ver 3.0: 3x10 = 30 MTF MAs + 30 Levels + 3 BB = 63 < 64
ver 4.0: 5(4+1)x8 = 8 CurTF MAs + 32 MTF MAs + 20 Levels + 3 BB = 63 < 64
ver 5.0: 6(5+1)x6 = 6 CurTF MAs + 30 MTF MAs + 24 Levels + 3 BB = 63 < 64
ver 6.0: 4(3+1)x10 = 10 CurTF MAs + 30 MTF MAs + 20 Levels + 3 BB = 63 < 64
Fib numbers: 8, 13, 21, 34, 55, 89, 144, 233, 377
This indicator shows multiple MAs of any type SMA EMA WMA HMA etc with BB and MTF support, can show MAs as dynamically moving levels.
There are 4 MA groups + 1 BB group, a total of 4 TFs * 7 MAs = 28 MAs. You can assign any type/timeframe combo to a group, for example:
- EMAs 9,12,26,50,100,200,400 x H1, H4, D1, W1 (4 TFs x 7 MAs x 1 type)
- EMAs 8,13,21,30,34,50,55,89,100,144,200,233,377,400 x M15, H1 (2 TFs x 14 MAs x 1 type)
- D1 EMAs and SMAs 8,13,21,30,34,50,55,89,100,144,200,233,377,400 (1 TF x 14 MAs x 2 types)
- H1 WMAs 13,21,34,55,89,144,233; H4 HMAs 9,12,26,50,100,200,400; D1 EMAs 12,26,89,144,169,233,377; W1 SMAs 9,12,26,50,100,200,400 (4 TFs x 7 MAs x 4 types)
- +1 extra MA type/timeframe for BB
There are several versions: Simple, MTF, Pro MTF, Advanced MTF, MAX MTF and Ultimate MTF. This is the MAX MTF version. The Differences are listed below. All versions have BB
- Simple: you have 2 groups of MAs that can be assigned any type (5+5)
- MTF: +2 custom Timeframes for each group (2x5 MTF) +1 TF for BB, TF XY smoothing
- Pro MTF: 4 custom Timeframes for each group (4x3 MTF), 1 TF for BB, MA levels and show max bars back options
- Advanced MTF: +4 extra MAs/group (4x7 MTF), custom Ticker/Symbols, Timeframe <>= filter, Remove Duplicates Option
- MAX MTF: +2 subtypes/group, packed to the limit with max possible MAs/TFs: 4x7, 5x6, 3x10, 4(3+1)x10, 5(4+1)x8, 6(5+1)x6
- Ultimate MTF: +individual settings for each MA, custom Ticker/Symbols
MAX MTF version tests the limits of Pinescript trying to squeeze as many MAs/TFs as possible into a single indicator.
It's basically a maxed out Advanced version with subtypes allowing for mixed types within a group (i.e. both emas and smas in a single group/TF)
Pinescript has the following limits:
- max 40 security calls (6 calls are reserved for dupe checks and smoothing, 2 are used for BB, so only 32 calls are available)
- max 64 plot outputs (BB uses 3 outputs, so only 61 plot outputs are available)
- max 50000 (50kb) size of the compiled code
Based on those limits, you can only have the following MAs/TFs combos in a single script:
1. 4x7, 5x6, 3x10 - total number of MTF MAs must always be <= 32, and you can still have BB and Num Levels = total MAs, without any compromises
2. 5(4+1)x8, 6(5+1)x6, 4(3+1)x10 - you can use the Current Symbol/Timeframe as an extra (+1) fixed TF with the same number of MTF MAs
- you don't need to call security to display MAs on the Current Symbol/Timeframe, so the total number of MTF MAs remains the same and is still <= 32
- to fit that many MAs into the max 64 plot outputs limit you need to reduce the number of levels (not every MA Group will have corresponding levels)
Features:
- 4x7 = 28 MAs of any type
- 4x MTF groups with XY step line smoothing
- +1 extra TF/type for BB MAs
- 2 MA subtypes within each group/TF
- 4x7 = 28 MA levels with adjustable group offsets, indents and shift
- supports any existing type of MA: SMA, EMA, WMA, Hull Moving Average (HMA)
- custom tickers/symbols for each group
- show max bars back option
- show/hide both groups of MAs/levels/BB and individual MAs
- timeframe filter: show only MAs/Levels with TFs <>= Current TF
- hide MAs/Levels with duplicate TFs
- support for custom TFs that are not available in free accounts: 2D, 3D etc
- support for timeframes in H: H, 2H, 4H etc
Notes:
- Uses timeframe textbox instead of input resolution dropdown to allow for 240 120 and other custom TFs
- Uses symbol textbox instead of input symbol to avoid establishing multiple dummy security connections to the current ticker - otherwise empty symbols will prevent script from running
- Possible reasons for missing MAs on a chart:
- there may not be enough bars in history to start plotting it. For example, W1 EMA200 needs at least 200 bars on a weekly chart.
- for charts with low/fractional prices i.e. 0.00002 << 0.001 (default Y smoothing step) decrease Y smoothing as needed (set Y = 0.0000001) or disable it completely (set X,Y to 0,0)
- for charts with high price values i.e. 20000 >> 0.001 increase Y smoothing as needed (set Y = 10-20). Higher values exceeding MAs point density will cause it to disappear as there will be no points to plot. Different TFs may require diff adjustments
- TradingView Replay Mode UI and Pinescript security calls are limited to TFs >= D (D,2D,W,MN...) for free accounts
- attempting to plot any TF < D1 in Replay Mode will only result in straight lines, but all TFs will work properly in history and real-time modes. This is not a bug.
- Max Bars Back (num_bars) is limited to 5000 for free accounts (10000 for paid), will show error when exceeded. To plot on all available history set to 0 (default)
- Slow load/redraw times. This indicator becomes slower, its UI less responsive when:
- Pinescript Node.js graphics library is too slow and inefficient at plotting bars/objects in a browser window. Code optimization doesn't help much - the graphics engine is the main reason for general slowness.
- the chart has a long history (10000+ bars) in a browser's cache (you have scrolled back a couple of screens in a max zoom mode).
- Reload the page/Load a fresh chart and then apply the indicator or
- Switch to another Timeframe (old TF history will still remain in cache and that TF will be slow)
- in max possible zoom mode around 4500 bars can fit on 1 screen - this also slows down responsiveness. Reset Zoom level
- initial load and redraw times after a param change in UI also depend on TF. For example: D1/W1 - 2 sec, H1/H4 - 5-6 sec, M30 - 10 sec, M15/M5 - 4 sec, M1 - 5 sec. M30 usually has the longest history (up to 16000 bars) and W1 - the shortest (1000 bars).
- when indicator uses more MAs (plots) and timeframes it will redraw slower. Seems that up to 5 Timeframes is acceptable, but 6+ Timeframes can become very slow.
- show_last=last_bars plot limit doesn't affect load/redraw times, so it was removed from MA plot
- Max Bars Back (num_bars) default/custom set UI value doesn't seem to affect load/redraw times
- In max zoom mode all dynamic levels disappear (they behave like text)
- Dupe check includes symbol: symbol, tf, both subtypes - all must match for a duplicate group
- For the dupe check to work correctly a custom symbol must always include an exchange prefix. BB is not checked for dupes
Good Luck! Feel free to learn from/reuse the code to build your own indicators.
In den Scripts nach "20日线角度大于0的股票" suchen

Multi SMA EMA WMA HMA BB (4x5 MAs Bollinger Bands) Adv MTF - RRBMulti SMA EMA WMA HMA 4x5 Moving Averages with Bollinger Bands Advanced MTF by RagingRocketBull 2019
Version 1.0
This indicator shows multiple MAs of any type SMA EMA WMA HMA etc with BB and MTF support, can show MAs as dynamically moving levels.
There are 4 MA groups + 1 BB group, a total of 4 TFs * 5 MAs = 20 MAs. You can assign any type/timeframe combo to a group, for example:
- EMAs 12,26,50,100,200 x H1, H4, D1, W1 (4 TFs x 5 MAs x 1 type)
- EMAs 8,10,13,21,30,50,55,100,200,400 x M15, H1 (2 TFs x 10 MAs x 1 type)
- D1 EMAs and SMAs 8,10,12,26,30,50,55,100,200,400 (1 TF x 10 MAs x 2 types)
- H1 WMAs 7,77,89,167,231; H4 HMAs 12,26,50,100,200; D1 EMAs 89,144,169,233,377; W1 SMAs 12,26,50,100,200 (4 TFs x 5 MAs x 4 types)
- +1 extra MA type/timeframe for BB
There are several versions: Simple, MTF, Pro MTF, Advanced MTF and Ultimate MTF. This is the Advanced MTF version. The Differences are listed below. All versions have BB
- Simple: you have 2 groups of MAs that can be assigned any type (5+5)
- MTF: +2 custom Timeframes for each group (2x5 MTF) +1 TF for BB, TF XY smoothing
- Pro MTF: 4 custom Timeframes for each group (4x3 MTF), 1 TF for BB, MA levels and show max bars back options
- Advanced MTF: +2 extra MAs/group (4x5 MTF), custom Ticker/Symbols, Timeframe <>= filter, Remove Duplicates Option
- Ultimate MTF: +individual settings for each MA, custom Ticker/Symbols
Features:
- 4x5 = 20 MAs of any type
- 4x MTF groups with XY step line smoothing
- +1 extra TF/type for BB MAs
- 4x5 = 20 MA levels with adjustable group offsets, indents and shift
- supports any existing type of MA: SMA, EMA, WMA, Hull Moving Average (HMA)
- custom tickers/symbols for each group - you can compare MAs of the same symbol across exchanges
- show max bars back option
- show/hide both groups of MAs/levels/BB and individual MAs
- timeframe filter: show only MAs/Levels with TFs <>= Current TF
- hide MAs/Levels with duplicate TFs
- support for custom TFs that are not available in free accounts: 2D, 3D etc
- support for timeframes in H: H, 2H, 4H etc
Notes:
- Uses timeframe textbox instead of input resolution dropdown to allow for 240 120 and other custom TFs
- Uses symbol textbox instead of input symbol to avoid establishing multiple dummy security connections to the current ticker - otherwise empty symbols will prevent script from running
- Possible reasons for missing MAs on a chart:
- there may not be enough bars in history to start plotting it. For example, W1 EMA200 needs at least 200 bars on a weekly chart.
- price << default Y smoothing step 5. For charts with low/fractional prices (i.e. 0.00002 << 5) adjust X Y smoothing as needed (set Y = 0.0000001) or disable it completely (set X,Y to 0,0)
- TradingView Replay Mode UI and Pinescript security calls are limited to TFs >= D (D,2D,W,MN...) for free accounts
- attempting to plot any TF < D1 in Replay Mode will only result in straight lines, but all TFs will work properly in history and real-time modes. This is not a bug.
- Max Bars Back (num_bars) is limited to 5000 for free accounts (10000 for paid), will show error when exceeded. To plot on all available history set to 0 (default)
- Slow load/redraw times. This indicator becomes slower, its UI less responsive when:
- Pinescript Node.js graphics library is too slow and inefficient at plotting bars/objects in a browser window. Code optimization doesn't help much - the graphics engine is the main reason for general slowness.
- the chart has a long history (10000+ bars) in a browser's cache (you have scrolled back a couple of screens in a max zoom mode).
- Reload the page/Load a fresh chart and then apply the indicator or
- Switch to another Timeframe (old TF history will still remain in cache and that TF will be slow)
- in max possible zoom mode around 4500 bars can fit on 1 screen - this also slows down responsiveness. Reset Zoom level
- initial load and redraw times after a param change in UI also depend on TF. For example:
D1/W1 - 2 sec, H1/H4 - 5-6 sec, M30 - 10 sec, M15/M5 - 4 sec, M1 - 5 sec.
M30 usually has the longest history (up to 16000 bars) and W1 - the shortest (1000 bars).
- when indicator uses more MAs (plots) and timeframes it will redraw slower. Seems that up to 5 Timeframes is acceptable, but 6+ Timeframes can become very slow.
- show_last=last_bars plot limit doesn't affect load/redraw times, so it was removed from MA plot
- Max Bars Back (num_bars) default/custom set UI value doesn't seem to affect load/redraw times
- In max zoom mode all dynamic levels disappear (they behave like text)
1. based on 3EmaBB, uses plot*, barssince and security functions
2. you can't set certain constants from input due to Pinescript limitations - change the code as needed, recompile and use as a private version
3. Levels = trackprice implementation
4. Show Max Bars Back = show_last implementation
5. swma has a fixed length = 4, alma and linreg have additional offset and smoothing params
6. Smoothing is applied by default for visual aesthetics on MTF. To use exact ma mtf values (lines with stair stepping) - disable it
Good Luck! You can explore, modify/reuse the code to build your own indicators.

ADX +- DiThis Adx +-Di is just a complete version of what the ADX is supposed to signal.
So you have:
15 (contraction), 20 (threshold), 30 (expansion), 40 (resistance) levels.
Below 20 the price is not trending
Above 30 the price is trending
Below 15 price has been in contraction for too long
Between 20 and 30 price is in a "transition zone".
I finally added a "Resistance" level (40), which has to be adapted to best represent the historical levels where price usually encounters resistance, and where the price can be declared "overtrending", which means a return to lower levels is likely to happen.
I've chosen mild colors, and set the Adx Color to White, because I use black background, you can easily change that.
Enjoy
-Maurice

Average Directional Index with DI SpreadThis indicator converts conventional triple lined ADX, DI+ and DI- into two lines. First line is the
original ADX line and second line is obtained by subtracting DI- from DI+ which named DI Spread(DIS)
If ADX is greater than 20 there is a trend and if greater than 40 there is a strong trend but ADX does not tell
the trend direction
To determine trend direction, DIS can be used with ADX; Sımply; If DIS is greater than 0, it is an uptrend and If DIS
is less than 0, it is a downtrend.
To sum up;
If ADX is greater than 20 and especially greater than 40 with positive DIS value, this implies an uptrend.
If ADX is greater than 20 and especially greater than 40 with negative DIS value, this implies a downtrend.
*Because of coloration and reference levels used, this indicator is really simple and efficient to analyze trend direction.

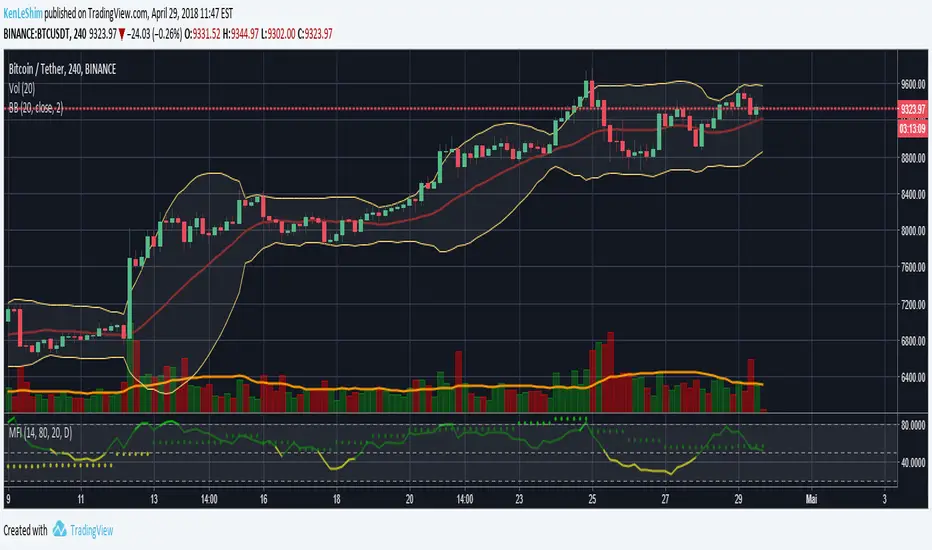
MFI Multi-TimeframeThe Money Flow Index (MFI) is an oscillating momentum and market strength indicator that was developed by Gene Quong and Avrum Soudack. It is also a leading indicator, which means it tends to lead price action, and is similar in calculation as J. Welles Wilder's Relative Strength Index (RSI) with the significant difference being that the MFI uses both price and volume. Like the RSI, the MFI is a range-bound oscillator that oscillates between zero and 100 and is interpreted in a similar way as the RSI. The ultimate aim of the MFI is to determine whether money is flowing in or out of a security over a specified look-back period.
HOW IS IT USED ?
The MFI oscillates between 0 and 100 and a security is considered overbought when its MFI rises above 80 and oversold when its MFI falls below 20. These levels are the suggested overbought and oversold levels as suggested by Quong and Soudack, though they do not suggest these levels as entry signals. Instead, these caution levels warn that the price action and the current trend have reached extremes that may be unsustainable. Quong and Soudack also recommend using the 90 and 10 lines as truly overbought and truly oversold levels respectively. MFI movements above 90 and below 10 are rare and indicate a higher level of unsustainability.
Finally, failure swings from the 20 or 80 levels can also be used to identify potential price reversals and trade entries. A failure swing occurs when the MFI moves over the overbought or oversold level but reverses back before reaching the opposite level. Thus, when the MFI crosses up over the 20 (oversold) level but reverses before it reaches the 80 (overbought) level, it indicates that the uptrend is weak and that it may reverse soon. This signals that you should cover any long positions or go short. Similarly, when the MFI crosses down over the 80 (overbought) level but reverses before it reaches the 20 (oversold) level, it indicates a weakness in the down trend and the probability that the trend will reverse. This would be a signal to close of any short positions; or a signal to long buy.
I added the possibility to add on the chart a 2nd timeframe for confirmation.
If you found this script useful, a tip is always welcome... :)
Exponential Moving Average (Set of 3) [Krypt] + 13/34 EMAsI took Krypt's script and essentially added on to it.
the 20/50/100/200 EMAs should be used together as support and resistance as normal.
Wait for price to break 200 EMA
Wait for 50 EMA to cross 200 EMA
Wait for pullback to 50 EMA to open position
20 and 100 EMAs are for extra information about moving support and resistance
and 13/34 EMAs should be used in conjunction
When 13 EMA crosses 34 EMA, open position
When price gets far from 13/34, close position (because price will attempt to revert back to mean)
This is better for scalping and swing trades than the 20/50/100/200 setup.
Twitter: @AzorAhai06

Gap Gain Test V1.0 by @overratedtraderOddball indicators for entertainment purposes only. This is best used on daily chart.
Look at the 20 ALMA to gauge likelihood of stock following its up or down gap.
- if above the 20 ALMA , follow the gap direction
- if below the 20 ALMA , take counter trend trade
If stock gaps up AND closes higher than it opens, that gain % (close/open) is colored green and if stock gaps down and closes lower than it opens, that gain % (close/open) is colored green
Conversely if the stock gaps up BUT closes lower than it opens, red and if a stop gaps down but closes higher than it opens, red.
Enjoy and follow me on twitter @overratedtrader for more nonsensical and out-of-the-box ideas.

Adaptive Donchian ChannelThis indicator adds a level of adaptivity to the simple Donchian Channel by adjusting the sensitivity (lookback periods) of the channel's upper and lower bounds based on the amount of time that has elapsed since the price has hit/expanded the channel boundaries. Comparing the results of this indicator to the standard Donchian Channel, the readier level of responsiveness may prove self-evident.
METHODOLOGY:
Specifically, the more recently the channel was expanded in one direction, the longer the lookback period grows in that direction. Conversely, if the channel has not been expanded in a given direction, the lookback period will contract so as to allow for a tighter channel.
For example, let the initial lookback period be 20 bars and let the factor argument be 0.1 (or 2 bars to start, as 20*0.1 = 2). Now say the current bar sets a new 20-period high. Then the lookback period for the upper bound is expanded by 2 bars to 22, and the lookback period for the lower bound is contracted by 2 bars to 18, thereby making it simultaneously harder to set new highs and easier to set new lows (and vice versa for hitting new lows). If neither a new high nor a new low is formed, both periods contract by the given factor.

TonyUX EMA Scalper - Buy / SellThis is a simple scalping strategy that works for all time frames... I have only tested it on FOREX
It works by checking if the price is currently in an uptrend and if it crosses the 20 EMA.
If it crosses the 20 EMA and its in and uptrend it will post a BUY SIGNAL.
If it crosses the 20 EMA and its in and down it will post a SELL SIGNAL.
The red line is the highest close of the previous 8 bars --- This is resistance
The green line is the lowest close of the previous 8 bars -- This is support

EMA_ConvergenceFirst I have to give kudos to my son who I asked to take a shot at creating this little indicator. Nice work son!
While trading, one of the things I look for is when price or certain EMA's approach another EMA. The example that I use on this 1 minute SPY chart is an 8 EMA and 20 EMA. I am looking for when the 8 and 20 are within' 3 cents of each other. Many times when they are getting close, price is approaching a top or bottom. I am looking for a candlestick reversal around that area. You may want to know when PRICE is near the 50 EMA: Use EMA 1 and 50 for that. Having it light up on top of the page, or elsewhere, makes it easier to look for the convergence when it occurs. If it lights up for a long period, price may be going sideways. I don't enter into a trade until the EMA starts separating, usually with another candlestick formation.
You are able to change the distance for convergence and two EMA's. Unfortunately you will have to adjust the convergence number up as you increase in time frames. This is designed to see when they are close, not when they cross.
The bars on top of this example are lit up purple due to the 8 and 20 EMA are within' 3 cents of each other.
If you want to overlay the price bars, instead of having it separate, just change overlay to "true"
Enjoy.

BRDN SCANNER - KS CONFIRMATIONS - GOLDBRDN SCANNER:
ENGLISH
Goal: ultra-selective, trend-following entries with automatic confirmations (no manual checks). Optimized presets for Gold (XAUUSD) and US30. The POI/POC logic runs internally (no line drawn). A signal prints only when all filters agree.
What it does
Trend: EMA-20 > EMA-50 > EMA-238 (or reverse) + optional HTF trend and slope.
POI control (internal): Rolling/Session VWAP with a neutral band →
BUY only when price is above the band (buyers in control), SELL only when below (sellers in control).
Volume: current volume > factor × SMA(volume). You can source futures volume (e.g., GC1! for Gold, YM1! for US30) while trading a CFD/spot chart.
Volatility filter: ATR% minimum to avoid chop.
Momentum: RSI > 50 or RSI cross 50 (selectable).
Candle match (pick one):
Breakout close (close > prior high / < prior low + body requirement)
Engulfing (classical body engulf + body requirement)
Strong close (closes near range extreme with short tail)
Sessions: optional trading windows for liquid hours.
Alerts: Buy / Sell / Combined + optional rich alert() messages.
Presets
Gold (XAUUSD) (default)
Volume source GC1!, HTF 60m, Neutral band ~ 0.35%.
Momentum: RSI cross 50 · Candle: Breakout close · Close-only ON.
Sessions: 08:00–11:00 & 13:30–17:00 (chart’s exchange timezone).
US30 (Dow)
Volume source YM1!, HTF 60m, Neutral band ~ 0.35%.
Momentum: RSI cross 50 · Candle: Strong close · Close-only ON.
Session: 09:30–16:00 (US cash hours).
Custom
Full manual control over all inputs.
Signal rules (summary)
BUY arrow = TrendBull ∧ (Slope optional) ∧ RSI ok ∧ HighVolume ∧ ATR ok ∧ Above VWAP band ∧ Not neutral ∧ CandleMatch.
SELL arrow = same, but below the band.
Suggested timeframes
5m–15m for intraday (Gold & US30). Keep Close-only = ON for cleaner signals, especially with MTF.
How to set alerts
Add the indicator → Add alert.
Condition: this indicator → choose Buy, Sell, or Combined.
Frequency: Once per bar close (recommended) or Once per bar.
For rich texts, choose Any alert() function call.
Tuning tips
Too many signals → raise VolFactor, NeutralBand, or Min ATR%; pick a stricter Candle mode.
Too few signals → lower one parameter at a time (e.g., VolFactor 1.8 → 1.5).
Prefer futures volume inputs for more reliable volume on CFD/spot charts.
Notes
No indicator guarantees a win rate. Back/forward test per instrument, timeframe, and market regime, and use sound risk management.
NEDERLANDS:
Doel: super-selectieve trend-volgende entries met automatische confirmaties (geen handwerk), geoptimaliseerd voor Gold (XAUUSD) en US30. De “POI/POC” gebeurt intern (geen lijn op de chart), pas een pijl als álle filters groen staan.
Wat doet het?
Trend: EMA-20 > EMA-50 > EMA-238 (of omgekeerd) + optionele HTF-trend en slope.
POI-control (intern): Rolling/Session VWAP met neutral band → alleen BUY als prijs boven band (buyers in control), SELL als onder (sellers in control).
Volume: huidig volume > factor × SMA(volume). Optioneel externe futures-volume (bv. GC1! voor Gold, YM1! voor US30).
Volatiliteit: ATR%-chopfilter (te lage volatiliteit = geen signaal).
Momentum: RSI > 50 of RSI cross 50.
Candle-match (keuze):
Breakout close (close > vorige high / < vorige low + body-eis)
Engulfing (klassiek omarmen + body-eis)
Strong close (sluit in top/bodem van range, korte staart)
Sessies: optionele tijdvensters voor liquid uren.
Alerts: Buy / Sell / Combined en optioneel rijke alert()-berichten.
Presets
Gold (XAUUSD) (default)
Volume bron: GC1! | HTF: 60m | Neutral band ~ 0.35%
Momentum: RSI cross 50 | Candle: Breakout close | Close-only: ON
Sessies: 08:00–11:00 & 13:30–17:00 (exchange-tz van chart)
US30 (Dow)
Volume bron: YM1! | HTF: 60m | Neutral band ~ 0.35%
Momentum: RSI cross 50 | Candle: Strong close | Close-only: ON
Sessie: 09:30–16:00 (US cash hours)
Custom
Handmatige controle over alle inputs.
Signaal-criteria (samengevat)
BUY-pijl = TrendBull ∧ (Slope optioneel) ∧ RSI-oké ∧ HoogVolume ∧ ATR-oké ∧ Boven VWAP-band ∧ Niet neutraal ∧ Candle-match.
SELL-pijl = analoog, maar onder VWAP-band.
Aanbevolen timeframes
5m–15m voor intraday (Gold & US30).
Close-only = ON voor cleanere signalen (zeker met MTF).
Alerts
Voeg indicator toe → klik Add alert.
Condition: indicatornaam → kies Buy, Sell of Combined.
Frequentie: Once per bar close (aanrader) of Once per bar.
Wil je rijke teksten? Kies Any alert() function call.
Tuning tips
Te veel signalen → verhoog VolFactor, NeutralBand of Min ATR%; kies strengere Candle.
Te weinig signalen → verlaag één parameter per keer (bijv. VolFactor 1.8 → 1.5).
Gebruik futures-volume voor betrouwbaardere volume-input op CFD/spot charts.
Belangrijk
Geen enkele indicator garandeert een winrate. Test per instrument/timeframe/marktregime (back/forward test) en combineer met risk-management. Gebruik alerts verantwoord.

Berdins indicatorMA-POC Momentum System PRO (RSI + MTF + Alerts)EMA-POC Momentum System (RSI + MTF + Alerts)
What it does
• Trend: plots EMA 20 (red), EMA 50 (blue), EMA 238 (orange)
• Key level: simplified POC line = close of the highest-volume bar within a lookback window
• Momentum: Buy/Sell signals when RSI crosses 50 in the direction of the EMA trend
• Filters: optional higher-timeframe trend alignment, EMA slope filter, and minimum distance from POC to avoid chop
• Alerts: separate Buy/Sell alerts or one combined alert (choose in settings)
How to use
1) Add to chart and keep “Confirm on bar close” enabled for non-repainting signals.
2) For intraday, consider enabling MTF Trend (e.g., chart = 5m/15m, HTF = 60m).
3) Optional: set Min distance from POC to ~0.5–1.0% to avoid entries right on the POC.
4) Create alerts via the Alerts panel: choose “Buy Alert”, “Sell Alert”, or “Combined”.
Inputs (quick reference)
• EMA Fast/Mid/Slow = 20/50/238
• POC Lookback (default 200)
• RSI Length (default 14)
• Use Higher Timeframe Trend? (default off) + HTF for Trend
• Require EMA20 & EMA50 slope (default on)
• Min distance from POC (% of price)
• Confirm signals on bar close (default on)
• Use ONE combined alert (default off)
Notes
• POC here is a lightweight approximation and not a full volume profile.
• Signals are informational/educational. Always manage risk and confirm with your own process.

Berdins Indicator - EMA-POC (RSI + MTF + Alerts)EMA-POC Momentum System (RSI + MTF + Alerts)
What it does
• Trend: plots EMA 20 (red), EMA 50 (blue), EMA 238 (orange)
• Key level: simplified POC line = close of the highest-volume bar within a lookback window
• Momentum: Buy/Sell signals when RSI crosses 50 in the direction of the EMA trend
• Filters: optional higher-timeframe trend alignment, EMA slope filter, and minimum distance from POC to avoid chop
• Alerts: separate Buy/Sell alerts or one combined alert (choose in settings)
How to use
1) Add to chart and keep “Confirm on bar close” enabled for non-repainting signals.
2) For intraday, consider enabling MTF Trend (e.g., chart = 5m/15m, HTF = 60m).
3) Optional: set Min distance from POC to ~0.5–1.0% to avoid entries right on the POC.
4) Create alerts via the Alerts panel: choose “Buy Alert”, “Sell Alert”, or “Combined”.
Inputs (quick reference)
• EMA Fast/Mid/Slow = 20/50/238
• POC Lookback (default 200)
• RSI Length (default 14)
• Use Higher Timeframe Trend? (default off) + HTF for Trend
• Require EMA20 & EMA50 slope (default on)
• Min distance from POC (% of price)
• Confirm signals on bar close (default on)
• Use ONE combined alert (default off)
Notes
• POC here is a lightweight approximation and not a full volume profile.
• Signals are informational/educational. Always manage risk and confirm with your own process.

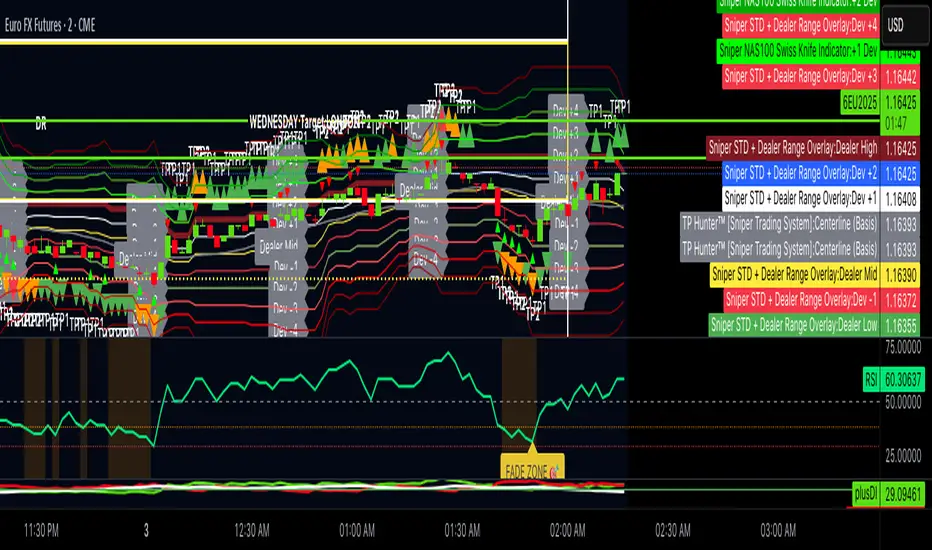
TP Hunter [Sniper Trading System]TP Hunter Overlay — Sniper Trading System Suite
What it is
TP Hunter helps with the hardest part of trading: exits. It plots Take Profit zones (TP1/TP2/TP3) using a standard deviation model around a 20-period moving average (“Centerline”). When price reaches a target, TP Hunter marks it on the chart and can trigger an alert—so you can scale out with discipline.
How it works (plain language)
The Centerline is a 20-period SMA (average price).
The script measures recent volatility (standard deviation) and projects TP levels above/below the Centerline.
If price is above the Centerline, the script treats it as buy context; below = sell context.
When price touches a TP level in that context, the indicator prints a shape (TP1 green, TP2 orange, TP3 red) and alerts can fire.
Inputs
TP1/TP2/TP3 Multiplier: distance of each target from the Centerline (in standard deviations).
RSI Period / Levels: optional filter to avoid extreme conditions (default enabled).
Show TP Hit Labels: toggle the on-chart labels.
Visuals
Centerline (gray)
TP hits:
Buy hits = triangles above bars (TP1/TP2/TP3 = green/orange/red).
Sell hits = triangles below bars (TP1/TP2/TP3 = green/orange/red).
Alerts
TP1/TP2/TP3 hit alerts for both buy and sell contexts.
Suggested workflow: set alerts, scale out at TP1/TP2, reserve a runner for TP3.
Best practices
Use TP Hunter to plan exits after your own entry signal (e.g., time-based or liquidity-based entries).
If you want fewer but stronger targets, increase the multipliers.
If you want more frequent targets, decrease them slightly.
RSI filter can reduce noise during extreme momentum.
Notes & Limitations
This is an overlay tool for exit management, not a standalone entry system.
Shapes confirm on bar close; alerts can trigger intrabar when a level is touched.
No financial advice. Past performance does not guarantee future results.
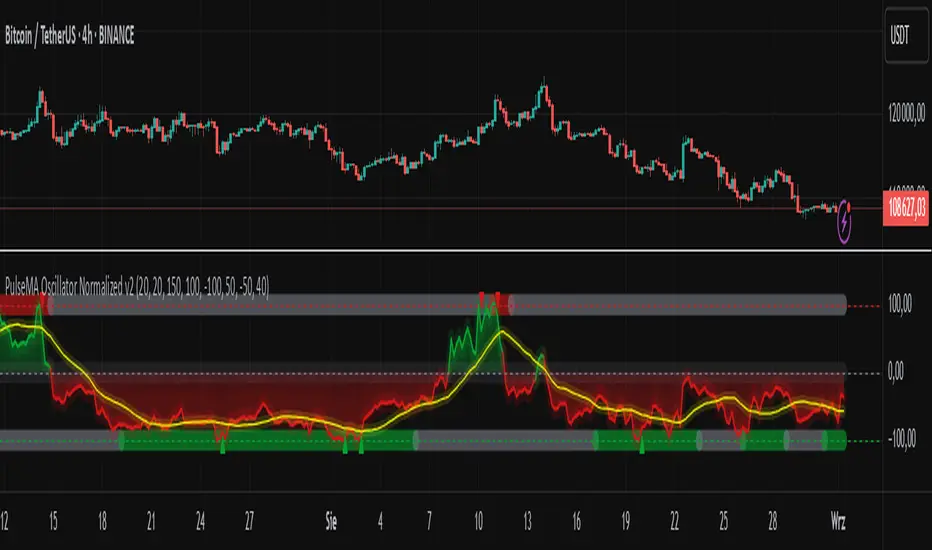
PulseMA Oscillator Normalized v2█ OVERVIEW
PulseMA Oscillator Normalized v2 is a technical indicator designed for the TradingView platform, assisting traders in identifying potential trend reversal points based on price dynamics derived from moving averages. The indicator is normalized for easier interpretation across various market conditions, and its visual presentation with gradients and signals facilitates quick decision-making.
█ CONCEPTS
The core idea of the indicator is to analyze trend dynamics by calculating an oscillator based on a moving average (EMA), which is then normalized and smoothed. It provides insights into trend strength, overbought/oversold levels, and reversal signals, enhanced by gradient visualizations.
Why use it?
Identifying reversal points: The indicator detects overbought and oversold levels, generating buy/sell signals at their crossovers.
Price dynamics analysis: Based on moving averages, it measures how long the price stays above or below the EMA, incorporating trend slope.
Visual clarity: Gradients, fills, and colored lines enable quick chart analysis.
Flexibility: Configurable parameters, such as moving average lengths or normalization period, allow adaptation to various strategies and markets.
How it works?
Trend detection: Calculates a base exponential moving average (EMA with PulseMA Length) and measures how long the price stays above or below it, multiplied by the slope for the oscillator.
Normalization: The oscillator is normalized based on the minimum and maximum values over a lookback period (default 150 bars), scaling it to a range from -100 to 100: (oscillator - min) / (max - min) * 200 - 100. This ensures values are comparable across different instruments and timeframes.
Smoothing: The main line (PulseMA) is the normalized oscillator (oscillatorNorm). The PulseMA MA line is a smoothed version of PulseMA, calculated using an SMA with the PulseMA MA length. As PulseMA MA is smoothed, it reacts more slowly and can be used as a noise filter.
Signals: Generates buy signals when crossing the oversold level upward and sell signals when crossing the overbought level downward. Signals are stronger when PulseMA MA is in the overbought or oversold zone (exceeding the respective thresholds for PulseMA MA).
Visualization: Draws lines with gradients for PulseMA and PulseMA MA, levels with gradients, gradient fill to the zero line, and signals as triangles.
Alerts: Built-in alerts for buy and sell signals.
Settings and customization
PulseMA Length: Length of the base EMA (default 20).
PulseMA MA: Length of the SMA for smoothing PulseMA MA (default 20).
Normalization Lookback Period: Normalization period (default 150, minimum 10).
Overbought/Oversold Levels: Levels for the main line (default 100/-100) and thresholds for PulseMA MA, indicating zones where PulseMA MA exceeds set values (default 50/-50).
Colors and gradients: Customize colors for lines, gradients, and levels; options to enable/disable gradients and fills.
Visualizations: Show PulseMA MA, gradients for overbought/oversold/zero levels, and fills.
█ OTHER SECTIONS
Usage examples
Trend analysis: Observe PulseMA above 0 for an uptrend or below 0 for a downtrend. Use different values for PulseMA Length and PulseMA MA to gain a clearer trend picture. PulseMA MA, being smoothed, reacts more slowly and can serve as a noise filter to confirm trend direction.
Reversal signals: Look for buy triangles when PulseMA crosses the oversold level, especially when PulseMA MA is in the oversold zone. Similarly, look for sell triangles when crossing the overbought level with PulseMA MA in the overbought zone. Such confirmation increases signal reliability.
Customization: Test different values for PulseMA Length and PulseMA MA on a given instrument and timeframe to minimize false signals and tailor the indicator to market specifics.
Notes for users
Combine with other tools, such as support/resistance levels or other oscillators, for greater accuracy.
Test different settings for PulseMA Length and PulseMA MA on the chosen instrument and timeframe to find optimal values.
Extreme Zone Volume ProfileExtreme Zone Volume Profile (EZVP)
Originality & Innovation
The Extreme Zone Volume Profile (EZVP) revolutionizes traditional volume profile analysis by applying statistical zone classification to volume distribution. Unlike standard volume profiles that display raw volume data, EZVP segments the price range into statistically meaningful zones based on percentile thresholds, allowing traders to instantly identify where volume concentration suggests strong support/resistance versus areas of potential breakout.
Technical Methodology
Core Algorithm:
Distributes volume across user-defined bins (20-200) over a lookback period
Calculates volume-weighted price levels for each bin
Applies percentile-based zone classification to the price range (not volume ranking)
Zone B (extreme zones): Outer percentile tails representing potential rejection areas
Zone A (significant zones): Secondary percentile bands indicating strong interest levels
Center Zone: Bulk trading range where most price discovery occurs
Mathematical Foundation:
The script uses price-range percentiles rather than volume percentiles. If the total price range is divided into 100%, Zone B captures the extreme price tails (default 2.5% each end ≈ 2 standard deviations), Zone A captures the next significant bands (default 14% each ≈ 1 standard deviation), leaving the center for normal distribution trading.
Key Calculations:
POC (Point of Control): Price level with maximum volume accumulation
Volume-weighted mean price: Total volume × price / total volume
Median price: Geometric center of the price range
Rightward-projected bars: Volume bars extend forward from current time to avoid historical chart clutter
Trading Applications
Zone Interpretation:
Zone B (Red/Green): Extreme price levels where volume suggests strong rejection potential. Price reaching these zones often indicates overextension and possible reversal points.
Zone A (Orange/Teal): Significant support/resistance areas with substantial volume interest. These levels often act as intermediate targets or consolidation zones.
Center (Gray): Fair value area where most trading occurs. Price tends to return to this range during normal market conditions.
Strategic Usage:
Reversal Trading: Look for rejection signals when price enters Zone B areas
Breakout Confirmation: Volume expansion beyond Zone B boundaries suggests genuine breakouts
Support/Resistance: Zone A boundaries often provide reliable entry/exit levels
Mean Reversion: Price tends to gravitate toward the volume-weighted mean and POC lines
Unique Value Proposition
EZVP addresses three key limitations of traditional volume profiles:
Visual Clarity: Standard profiles can be cluttered and difficult to interpret quickly. EZVP's color-coded zones provide instant visual feedback about price significance.
Statistical Framework: Rather than relying on subjective interpretation of volume nodes, EZVP applies objective percentile-based classification, making support/resistance identification more systematic.
Forward-Looking Display: Rightward-projecting bars keep historical price action clean while maintaining current market structure visibility.
Configuration Guide
Lookback Period (10-1000): Controls the historical depth of volume calculation. Shorter periods for intraday scalping, longer for swing trading.
Number of Bins (20-200): Resolution of volume distribution. Higher values provide more granular analysis but may create noise on lower timeframes.
Zone Percentages:
Zone B: Extreme threshold (default 2.5% = ~2σ statistical significance)
Zone A: Significant threshold (default 14% = ~1σ statistical significance)
Visual Controls: Toggle individual elements (POC, median, mean, zone lines) to customize display complexity for your trading style.
Technical Requirements
Pine Script v6 compatible
Maximum bars back: 5000 (ensures sufficient historical data)
Maximum boxes: 500 (supports high-resolution bin counts)
Maximum lines: 50 (accommodates all zone and reference lines)
This indicator synthesizes volume profile theory with statistical zone analysis, providing a quantitative framework for identifying high-probability support/resistance levels based on volume distribution patterns rather than arbitrary price levels.

Volume Heat ZoneVolume Zones Indicator
This Pine Script creates a volume-based zone analysis tool for TradingView.
Function:
Divides the price range (high to low) into 20 levels over a 100-candle lookback period
Measures volume activity at each price level
Draws boxes at levels with above-average volume (1.5x threshold)
Key Settings:
Lookback Period (100): Number of candles analyzed
Price Levels (20): Price range subdivisions
Volume Threshold (1.5): Minimum volume multiplier for zones
Candle Offset (1): Excludes current candle from analysis
Projection Bars (10): Extends boxes 10 bars into the future
How it works:
The indicator identifies price levels where significant trading volume occurred historically, highlighting potential support/resistance zones. Boxes are redrawn on each confirmed candle, showing dynamic volume concentration areas that traders can use for entry/exit decisions.

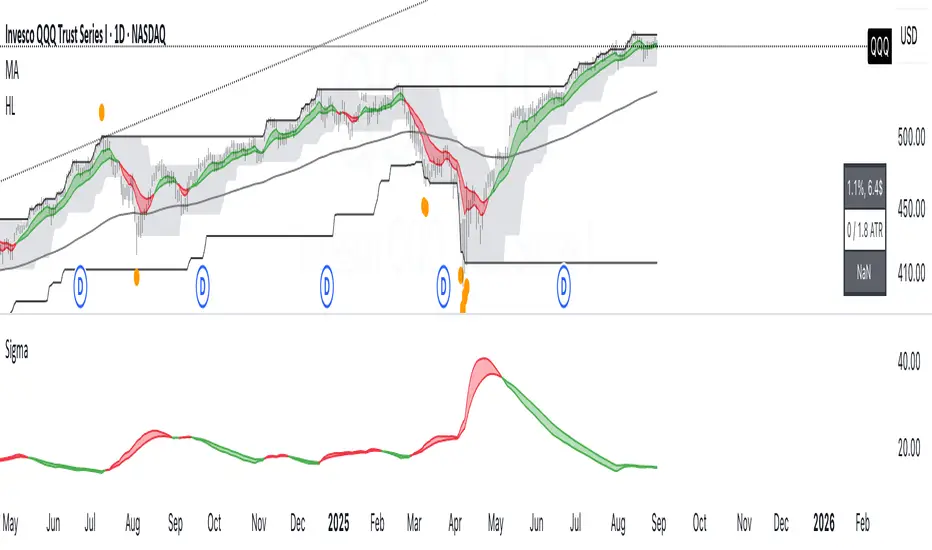
Volatility Forecast/*==============================================================================
Volatility Forecast — Publishable Documentation
Author: @BB_9791
License: Mozilla Public License 2.0
WHAT THIS INDICATOR SHOWS
- A daily volatility estimate in percent points, called sigma_day.
- A slow volatility anchor, the 10-year EMA of sigma_day.
- A blended volatility series in percent points:
sigma_blend = (1 − p) * sigma_day + p * EMA_10y(sigma_day)
where p is the Slow weight %, default 30.
- Optional annualization by multiplying by 16, this is a daily-to-annual
conversion used by Robert Carver in his writings.
METHODOLOGY, CREDIT
The estimator follows the approach popularized by Robert Carver
("Systematic Trading", "Advanced Futures Trading Strategies", blog qoppac).
Current daily volatility is computed as an exponentially weighted standard
deviation of daily percent returns, with alpha = 2 / (span + 1).
The slow leg is a long EMA of that volatility series, about 10 years.
The blend uses fixed weights. This keeps the slow leg meaningful through
large price level changes, since the blend is done in percent space first.
MATH DETAILS
Let r_t be daily percent return:
r_t = 100 * (Close_t / Close_{t−1} − 1)
EWMA mean and variance:
m_t = α * r_t + (1 − α) * m_{t−1}
v_t = α * (r_t − m_t)^2 + (1 − α) * v_{t−1}
where α = 2 / (span_current + 1)
Current daily sigma in percent points:
sigma_day = sqrt(v_t)
Slow leg:
sigma_10y = EMA(sigma_day, span_long)
Blend:
sigma_blend = (1 − p) * sigma_day + p * sigma_10y
Annualized option:
sigma_ann = 16 * sigma_blend
INPUTS
- Threshold (percent points): horizontal guide level on the chart.
- Short term span (days): EW stdev span for sigma_day.
- Long term span (days): EMA span for the slow leg, choose about 2500 for 10 years.
- Slow weight %: p in the blend.
- Annualize (x16): plot daily or annualized values.
- Show components: toggles Current and 10y EMA lines.
- The script uses the chart symbol by default.
PLOTS
- Blended σ% as the main line.
- Optional Current σ% and 10y EMA σ%.
- Editable horizontal threshold line in the same units as the plot
(percent points per day or per year).
- Optional EMA 9 and EMA 20 cloud on the blended series, green for uptrend
when EMA 9 is above EMA 20, red otherwise. Opacity is configurable.
HOW TO READ
- Values are percent points of movement per day when not annualized,
for example 1.2 means about 1.2% typical daily move.
- With annualize checked, values are percent points per year, for example 18
means about 18% annualized volatility.
- Use the threshold and the EMA cloud to mark high or low volatility regimes.
NOTES
- All calculations use daily data via request.security at the chart symbol.
- The blend is done in percent space, then optionally annualized, which avoids
bias from the price level.
- This script does not produce trading signals by itself, it is a risk and
regime indicator.
CREDITS
Volatility forecasting method and scaling convention credited to Robert Carver.
See his books and blog for background and parameter choices.
VERSION
v1.0 Initial public release.
==============================================================================*/
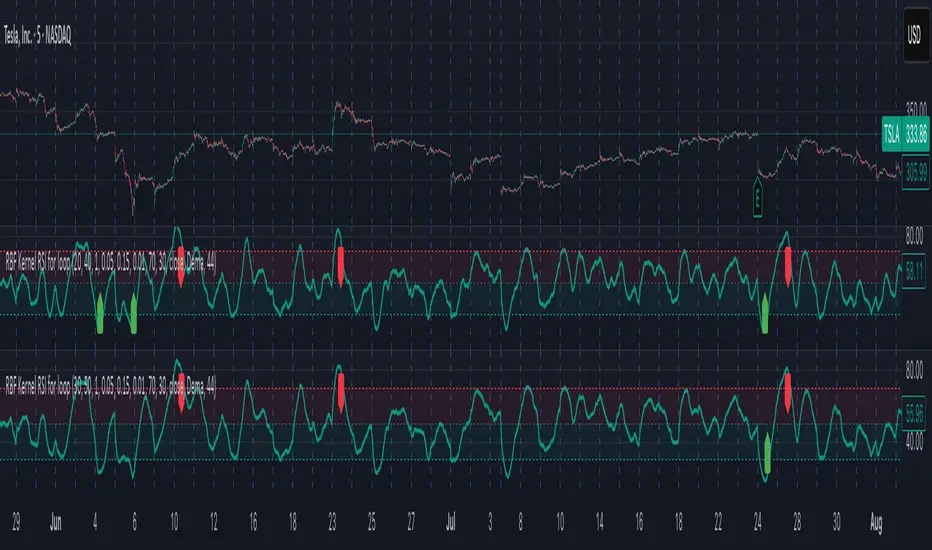
Radial Basis Kernel RSI for LoopRadial Basis Kernel RSI for Loop
What it is
An RSI-style oscillator that uses a radial basis function (RBF) kernel to compute a similarity-weighted average of gains and losses across many lookback lengths and kernel widths (γ). By averaging dozens of RSI estimates—each built with different parameters—it aims to deliver a smoother, more robust momentum signal that adapts to changing market conditions.
How it works
The script measures up/down price changes from your chosen Source (default: close).
For each combination of RSI length and Gamma (γ) in your ranges, it builds an RSI where recent bars that look most similar (by price behavior) get more weight via an RBF kernel.
It averages all those RSIs into a single value, then smooths it with your selected Moving Average type (SMA, EMA, WMA, HMA, DEMA) and a light regression-based filter for stability.
Inputs you can tune
Min/Max RSI Kernel Length & Step: Range of RSI lookbacks to include in the ensemble (e.g., 20→40 by 1) or (e.g., 30→50 by 1).
Min/Max Gamma & Step: Controls the RBF “width.” Lower γ = broader similarity (smoother); higher γ = more selective (snappier).
Source: Price series to analyze.
Overbought / Oversold levels: Defaults 70 / 30, with a midline at 50. Shaded regions help visualize extremes.
MA Type & Period (Confluence): Final smoothing on the averaged RSI line (e.g., DEMA(44) by default).
Red “OB” labels when the line crosses down from extreme highs (~80) → potential overbought fade/exit areas.
Green “OS” labels when the line crosses up from extreme lows (~20) → potential oversold bounce/entry areas.
How to use it
Treat it like RSI, but expect fewer whipsaws thanks to the ensemble and kernel weighting.
Common approaches:
Look for crosses back inside the bands (e.g., down from >70 or up from <30).
Use the 50 midline for directional bias (above = bullish momentum tilt; below = bearish).
Combine with trend filters (e.g., your chart MA) for higher-probability signals.
Performance note: This is really heavy and depending on how much time your subscription allows you could experience this timing out. Increasing the step size is the easiest way to reduce the load time.
Works on any symbol or timeframe. Like any oscillator, best used alongside price action and risk management rather than in isolation.
Session Based Liquidity# Session Based Liquidity Indicator - Educational Open Source
## 📊 Overview
The Session Based Liquidity indicator is a comprehensive educational tool designed to help traders understand and visualize liquidity concepts across major trading sessions. This indicator identifies Buy-Side Liquidity (BSL) and Sell-Side Liquidity (SSL) levels created during Asia, London, and New York trading sessions, providing insights into institutional order flow and potential market reversal zones.
## 🎯 Key Features
### 📈 Multi-Session Tracking
- **Asia Session**: Tokyo/Sydney overlap (20:00-02:00 EST)
- **London Session**: European markets (03:00-07:30 EST)
- **New York Session**: US markets (09:30-16:00 EST)
- Individual session toggle controls for focused analysis
### 💧 Liquidity Level Detection
- **Buy-Side Liquidity (BSL)**: Identifies stop losses above swing highs where short positions get stopped out
- **Sell-Side Liquidity (SSL)**: Identifies stop losses below swing lows where long positions get stopped out
- Advanced filtering algorithm to identify only significant liquidity zones
- Configurable pivot strength for sensitivity adjustment
### 🎨 Visual Management System
- **Unclaimed Levels**: Active liquidity zones that haven't been hit (default: black lines)
- **Claimed Levels**: Swept liquidity zones showing historical interaction (default: red lines)
- Customizable line styles, colors, and widths for both states
- Dynamic label system showing session origin and level significance
- Real-time line extension and label positioning
### ⚙️ Advanced Configuration
- **Pivot Strength**: Adjust sensitivity (1-20) for liquidity detection
- **Max Levels Per Side**: Control number of tracked levels (1-10) per session
- **Label Offset**: Customize label positioning
- **Style Customization**: Full control over visual appearance
## 📚 Educational Value
### Core Concepts Explained
- **Liquidity Pools**: Areas where stop losses and pending orders cluster
- **Liquidity Sweeps**: When price moves through levels to trigger stops, then reverses
- **Session-Based Analysis**: How different market sessions create distinct liquidity characteristics
- **Institutional Order Flow**: Understanding how large players interact with retail liquidity
### Trading Applications
- Identify high-probability reversal zones after liquidity sweeps
- Understand where stop losses are likely clustered
- Avoid trading into obvious liquidity traps
- Use session context for timing entries and exits
- Recognize institutional accumulation and distribution patterns
### Code Learning Opportunities
- **Pine Script v6 Best Practices**: Modern syntax and efficient coding patterns
- **Object-Oriented Design**: Custom types and methods for clean code organization
- **Array Management**: Dynamic data structure handling for performance
- **Visual Programming**: Line, label, and styling management
- **Session Detection**: Time-based filtering and timezone handling
## 🔧 Technical Implementation
### Performance Optimized
- Efficient memory management with automatic cleanup
- Limited historical level tracking to maintain responsiveness
- Optimized array operations for smooth real-time updates
- Smart filtering to reduce noise and focus on significant levels
### Code Architecture
- **Modular Design**: Clean separation of concerns with dedicated methods
- **Type Safety**: Custom SessionLiquidity type for organized data management
- **Extensible Structure**: Easy to modify and enhance for specific needs
- **Educational Comments**: Comprehensive documentation throughout
## 💡 Usage Guide
### Basic Setup
1. Add indicator to chart
2. Configure session times for your timezone
3. Adjust pivot strength based on timeframe (higher for lower timeframes)
4. Enable/disable sessions based on your trading focus
### Interpretation
- **Unclaimed levels**: Watch for price interaction and potential reversals
- **Claimed levels**: Use as potential support/resistance after sweep
- **External levels**: Beyond session range, higher significance
- **Internal levels**: Within session range, may indicate ranging conditions
### Best Practices
- Use higher timeframes (15m+) for cleaner signals
- Combine with price action analysis for confirmation
- Consider session overlap periods for increased significance
- Monitor multiple sessions for comprehensive market view
## 🎓 Educational Goals
This open-source project aims to:
- Demystify liquidity concepts for retail traders
- Provide practical coding examples in Pine Script v6
- Encourage understanding of institutional trading behavior
- Foster community learning and collaboration
- Bridge the gap between theory and practical application
## 📄 License & Usage
Released under Mozilla Public License 2.0 - free for educational and commercial use with proper attribution.
## 🤝 Contributing
As an open-source educational tool, contributions are welcome! Whether it's bug fixes, feature enhancements, or educational improvements, your input helps the trading community learn and grow.
## ⚠️ Disclaimer
This indicator is for educational purposes only. All trading involves risk, and past performance does not guarantee future results. Always practice proper risk management and never risk more than you can afford to lose.
---
*By studying and using this indicator, traders can develop a deeper understanding of market microstructure and improve their ability to read institutional order flow patterns.*

Signal Hunter Pro - GKDXLSignal Hunter Pro - GKDXL combines four powerful technical indicators with trend strength filtering and volume confirmation to generate reliable BUY/SELL signals. This indicator is perfect for traders who want a systematic approach to market analysis without the noise of conflicting signals.
🔧 Core Features
📈 Multi-Indicator Signal System
Moving Averages: EMA 20, EMA 50, and SMA 200 for trend analysis
Bollinger Bands: Dynamic support/resistance with price momentum detection
RSI: Enhanced RSI logic with smoothing and multi-zone analysis
MACD: Traditional MACD with signal line crossovers and zero-line analysis
🎛️ Advanced Filtering System
ADX Trend Strength Filter: Only signals when trend strength exceeds threshold
Volume Confirmation: Ensures signals occur with adequate volume participation
Multi-Timeframe Logic: Works on any timeframe from 1m to 1D and beyond
🚨 Intelligent Signal Generation
Requires 3 out of 4 indicators to align for signal confirmation
Separate bullish and bearish signal conditions
Real-time signal strength scoring (1/4 to 4/4)
Built-in alert system for automated notifications
⚙️ Customizable Parameters
📊 Technical Settings
Moving Averages: Adjustable EMA and SMA periods
Bollinger Bands: Configurable length and multiplier
RSI: Customizable length, smoothing, and overbought/oversold levels
MACD: Flexible fast, slow, and signal line settings
🎯 Risk Management
Risk Percentage: Set your risk per trade (0.1% to 10%)
Reward Ratio: Configure risk-to-reward ratios (1:1 to 1:5)
ADX Threshold: Control minimum trend strength requirements
🖥️ Display Options
Indicator Visibility: Toggle individual indicators on/off
Information Table: Optional detailed status table (off by default)
Volume Analysis: Real-time volume vs. average comparison
🎨 Visual Elements
📈 Chart Indicators
EMA Lines: Blue (20) and Orange (50) exponential moving averages
SMA 200: Gray long-term trend line
Bollinger Bands: Upper/lower bands with semi-transparent fill
Clean Interface: Minimal visual clutter for clear analysis
📋 Information Table (Optional)
Real-time indicator status with ✓/✗/— symbols
Current signal strength and direction
ADX trend strength measurement
Volume confirmation status
No-signal reasons when conditions aren't met
🔔 Alert System
📢 Three Alert Types
BUY Signal: Triggered when 3+ indicators align bullishly
SELL Signal: Triggered when 3+ indicators align bearishly
General Alert: Any signal detection for broader monitoring
📱 Alert Messages
Clear, actionable alert text
Includes indicator name for easy identification
Compatible with webhook integrations
🎯 How It Works
📊 Signal Logic
Indicator Assessment: Each of the 4 indicators is evaluated as Bullish/Bearish/Neutral
Consensus Building: Counts aligned indicators (minimum 3 required)
Filter Application: Applies trend strength and volume filters
Signal Generation: Generates BUY/SELL when all conditions are met
🔍 Indicator States
Moving Averages: Price position, EMA alignment, and crossovers
Bollinger Bands: Price relative to bands and momentum shifts
RSI: Multi-zone analysis with momentum and crossover detection
MACD: Signal line crossovers and zero-line positioning
🎉 Why Choose Signal Hunter Pro?
✅ Multi-Indicator Confirmation reduces false signals
✅ Trend Strength Filtering improves win rate
✅ Volume Confirmation ensures market participation
✅ Customizable Parameters adapt to any trading style
✅ Clean Visual Design doesn't clutter your charts
✅ Professional Alert System for automated trading
✅ No Repainting - reliable historical signals
✅ Works on All Timeframes from scalping to investing

Setup Cripto EMA + Volume//@version=5 indicator("Sinais Multi-Cripto – EMA+Volume (BTC/ETH/BNB/SOL/XRP)", overlay=false)
// Inputs emaFast = input.int(50, "EMA Curta") emaSlow = input.int(200, "EMA Longa") emaPull = input.int(20, "EMA Pullback") volLen = input.int(20, "Média Volume")
symBTC = input.symbol(defval="BINANCE:BTCUSDT", title="BTC") symETH = input.symbol(defval="BINANCE:ETHUSDT", title="ETH") symBNB = input.symbol(defval="BINANCE:BNBUSDT", title="BNB") symSOL = input.symbol(defval="BINANCE:SOLUSDT", title="SOL") symXRP = input.symbol(defval="BINANCE:XRPUSDT", title="XRP")
f_sig(sym) => c = request.security(sym, timeframe.period, close) v = request.security(sym, timeframe.period, volume) e50 = ta.ema(c, emaFast) e200 = ta.ema(c, emaSlow) e20 = ta.ema(c, emaPull) vma = ta.sma(v, volLen) long = (e50 > e200) and (c > e20) and (v > vma) short = (e50 < e200) and (c < e20) and (v > vma)
= f_sig(symBTC) = f_sig(symETH) = f_sig(symBNB) = f_sig(symSOL) = f_sig(symXRP)
// Exibição plotchar(btcL, title="BTC Long", char="▲", location=location.top) plotchar(btcS, title="BTC Short", char="▼", location=location.bottom) plotchar(ethL, title="ETH Long", char="▲", location=location.top) plotchar(ethS, title="ETH Short", char="▼", location=location.bottom) plotchar(bnbL, title="BNB Long", char="▲", location=location.top) plotchar(bnbS, title="BNB Short", char="▼", location=location.bottom) plotchar(solL, title="SOL Long", char="▲", location=location.top) plotchar(solS, title="SOL Short", char="▼", location=location.bottom) plotchar(xrpL, title="XRP Long", char="▲", location=location.top) plotchar(xrpS, title="XRP Short", char="▼", location=location.bottom)

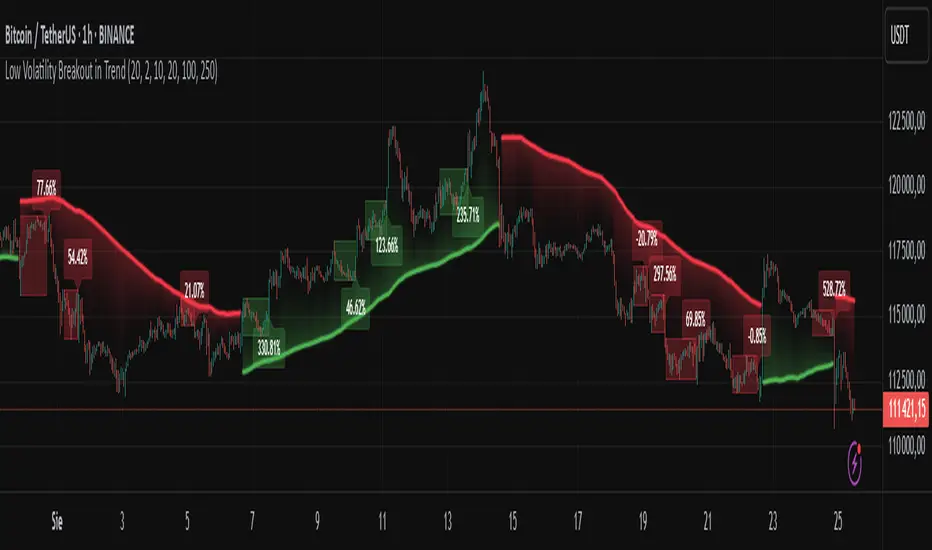
Low Volatility Breakout in Trend
█ OVERVIEW
"Low Volatility Breakout in Trend" is a technical analysis tool that identifies periods of low-volatility consolidation within an ongoing trend and signals potential breakouts aligned with the trend's direction. The indicator detects trends using a simple moving average (SMA) of price, identifies consolidation zones based on the size of candle bodies, and displays the percentage change in volume (volume delta) at the breakout moment.
█ CONCEPTS
The core idea of the indicator is to pinpoint moments where traders can join an ongoing trend by capitalizing on breakouts from consolidation zones, supported by additional information such as volume delta. It provides clear visualizations of trends, consolidation zones, and breakout signals to facilitate trading decisions.
Why Use It?
* Breakout Identification: The indicator locates low-volatility consolidation zones (measured by the size of individual candle bodies, not the price range of the consolidation) and signals breakouts, enabling traders to join the trend at key moments.
* Volume Analysis: Displays the percentage change in volume (delta) relative to its simple moving average, providing insight into market activity rather than acting as a signal filter.
* Visual Clarity: Colored trend lines, consolidation boxes (drawn only after the breakout candle closes, not on subsequent candles), and volume delta labels enable quick chart analysis.
* Flexibility: Adjustable parameters, such as the volatility window length or SMA period, allow customization for various trading strategies and markets.
How It Works
* Trend Detection: The indicator calculates a simple moving average (SMA) of price (default: based on the midpoint of high/low) and creates dynamic trend bands, offset by a percentage of the average candle height (band scaling). A price above the upper band signals an uptrend, while a price below the lower band indicates a downtrend. Trend changes occur not when the price crosses the SMA but when it crosses above the upper band or below the lower band (offset by the average candle height multiplied by the scaling factor).
* Consolidation Identification: Identifies low-volatility zones when the candle body size is smaller than the average body size over a specified period (default: 20 candles) multiplied by a volatility threshold — the maximum allowable body size as a percentage of the average body (e.g., 2 means the candle body must be less than twice the average body to be considered low-volatility).
* Breakout Signals: A breakout occurs when the candle body exceeds the volatility threshold, is larger than the maximum body in the consolidation, and aligns with the trend direction (bullish in an uptrend, bearish in a downtrend).
* Visualization: Draws a trend line with a gradient, consolidation boxes (appearing only after the breakout candle closes, marking the consolidation zone), and volume delta labels. Optionally displays breakout signal arrows.
* Signals and Alerts: The indicator generates signals for bullish and bearish breakouts, including the volume delta percentage. Alerts are an additional feature that can be enabled for notifications.
Settings and Customization
* Volatility Window: Length of the period for calculating the average candle body size (default: 20).
* Volatility Threshold: Maximum candle body size as a percentage of the average body (default: 2).
* Minimum Consolidation Bars: Number of candles required for a consolidation (default: 10).
* SMA Length for Trend: Period of the SMA for trend detection (default: 100).
* Band Scaling: Offset of trend bands as a percentage of the average candle height (default: 250%), determining the distance from the SMA.
* Visualization Options: Enable/disable consolidation boxes (Show Consolidation Boxes, drawn after the breakout candle closes), volume delta labels (Show Volume Delta Labels), and breakout signals (Show Breakout Signals, e.g., triangles).
* Colors: Customize colors for the trend line, consolidation boxes, and volume delta labels.
█ OTHER SECTIONS
Usage Examples
* Joining an Uptrend: When the price breaks out of a consolidation in an uptrend with a volume delta of +50%, open a long position; the signal is stronger if the breakout candle surpasses a local high.
* Avoiding False Breakouts: Ignore breakout signals with low volume delta (e.g., below 0%) and combine the indicator with other tools (e.g., support/resistance levels or oscillators) to confirm moves in low-activity zones.
Notes for Users
* On markets that do not provide volume data, the indicator will not display volume delta — disable volume labels and enable breakout signals (e.g., triangles) instead.
* Adjust parameters to suit the market's characteristics to minimize noise.
* Combine with other tools, such as Fibonacci levels or oscillators, for greater precision.